-
Posts
808 -
Joined
-
Last visited
Everything posted by Michele Oliosi
-
It is almost never problematic to split partitions across tables, especially when the two connected tables are side by side. This is because often the shadings on the two tables are similar, so it makes no difference whether it is a single table or two tables. Here I would recommend to act as if each table was a 1L string (the fact that there is a single module doesn't matter much). In this case I would put 2 partitions in height per table. I agree that intuitively 3 partitions (corresponding to the submodules) could seem to work, but when considering the details of the model over typical DHI/GHI ratios, we found that 2 partitions works better.
-
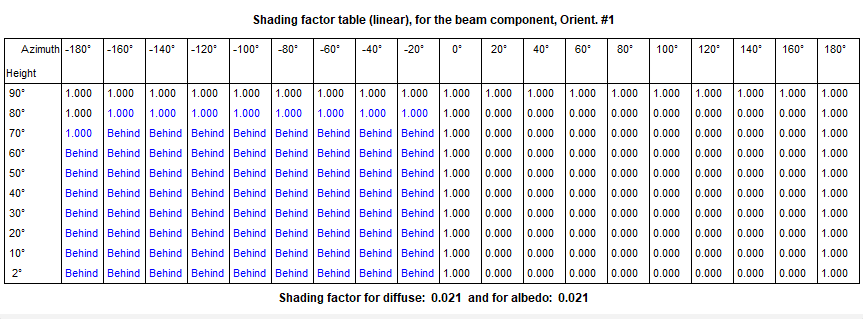
Ah yes, if you see the shading factor table you will notice that the 90° height is always 1, because the sun shines on the side of the table, which is considered full shading. The iso-shading diagram was aimed at interrow shading, so it does not handle this case well. You can disregard the shading lines in the isoshading diagram.
-

[Inquiry] Overload loss(kWh) according to the DC/AC ratio
Michele Oliosi replied to Jonwoo, Bae's topic in Simulations
Regarding where the clipping losses, they are currently encapsuled in Lc : collection loss. This is because we evaluate it based on EArray, which occurs after displacement of the operating point by the inverter. The irradiation data is in the MET file. However the evaluation shown in the “overload loss” in figure 1 and 2, are just preevaluations, that are not yet very precise. The real value is in the simulation. -

Error - You can't use the "Module Layout" tool
Michele Oliosi replied to Freuchet Thomas's topic in Problems / Bugs
Hi, Is the PV module you are using in subarray "Onduleur 4.3" different than the one used in other projects / other sub-arrays ? The message is suggesting that there is an issue with that PAN file. If you are not sure you can send us the file at support@pvsyst.com -
You can save the module as a pan file and open it with a text editor. One line corresponds to muGamma. There should be one more decimal there.
- 1 reply
-
- module details
- diode quality factor
-
(and 1 more)
Tagged with:
-

Advanced Simulation CSV output variables headings
Michele Oliosi replied to katerinaF's topic in Problems / Bugs
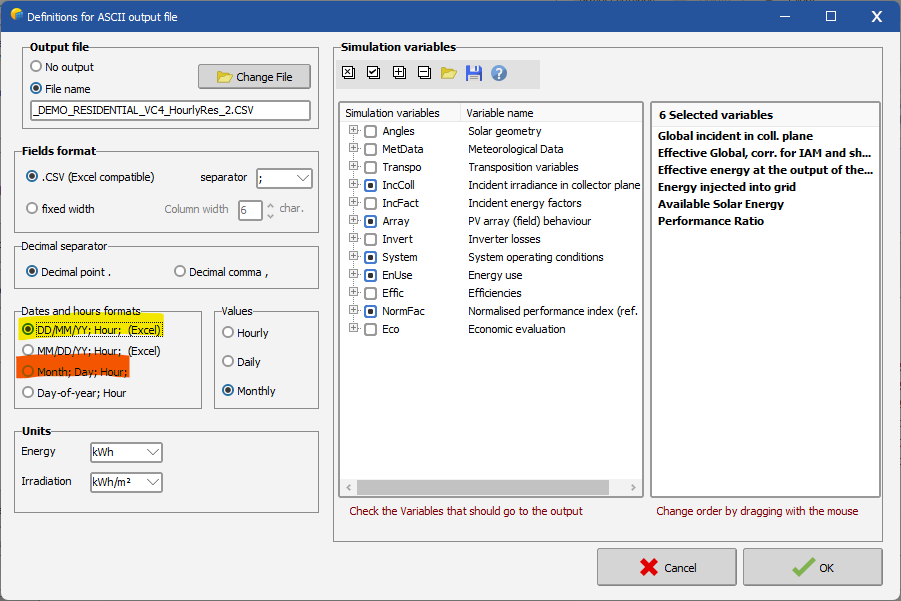
Hi, there is a bug with the "Month; Day; Hour;" option. Please use another one until we fix this bug. Sorry for the inconvenience. -
You find that from the project window > Self-consumption > option "Load values from a CSV hourly / daily file" > Click on "Choose CSV file"
-

Simulate Terrain-Following Tracker Systems
Michele Oliosi replied to Valerie Chan's topic in Shadings and tracking
Honestly, I think the strategy was different there were more operations involved. But as mentioned you should ask the manufacturer directly. Currently I am not able to describe the full procedure. -

Bifacial simulation of system with azimuth and different orientations
Michele Oliosi replied to 793935917's topic in How-to
Hi, at present you can simulate bifacial PV installations that have a single fixed or SAT orientation at least two rows of tables / trackers if you have a single row of tables, you should "duplicate" the scene, basically copy paste all relevant objects and place the copy at a large distance in the 3D scene. This will emulate the situation of a single row, because the original scene and the copy won't affect each other. Note: this is the current workaround. We will try to offer a solution for single row scenes in the future. -
Hi, the iso shading diagram is exactly what the name says, it displays the sky positions that produce the same shading factor as a continuous lines. These iso-shading lines are akin to isolines on a map, which show you the points at a given altitude. In general you can read the lines as follows: take the 40% line: as long as the sun is positioned at a sky position below that line, there will be at least 40% of shaded surfaces. The iso-shading diagram just shows the direct shading factor. The diffuse one is computed separately. On a separate note, I have never seen an iso shading diagram like yours. Please make sure that all the objects in the 3D scene are well defined and do not intersect each other. Also make sure that all PV surfaces have the correct orientation.
-
1) That is correct. You can also adapt the number of partitions in length (X). If there are two strings side by side then you can put 2 partitions in X. 2) No in fact what matters here is that the strings in parallel on a given MPPT are on the same level, so probably will experience the same shading. In this case you should put 2 partitions in Y for 1 V, 4 partitions for 2 V, 6 for 3V, as for 1). In the help this case is named "1L". As above you can put 2 partitions in X. 3) First solar modules are somewhat resilient to shading due to the submodule structure. It is recommended to use "Linear shadings" which doesn't need any partitioning. 4) Yes by assigning strings to different MPPTs there is no change. Since there are two strings in X you can put 2 partitions in X. 5) When cabled horizontally, this is like case 2) i.e. 4 partitions. MPPT 1 in your drawing: in general mutual shading affects 1/6th of the submodules. If the voltage range of the inverter allows for it, the string can just function with 5/6 of the voltage (and power) by bypassing the shaded submodules. MPPT 3 in the drawing: in general mutual shading affects 1/3 of the submodules. This situation is less advantageous and produces a bit more losses. Note that MPPT 2 will be generally unshaded. You can ignore the warning, you are right we should update that. 6) same as 3)
-
both are the same I think.
-
The array virtual energy at MPP is before the displacement of the operating point away from the MPP. It is the maximum energy you could extract from your PV array if your inverter had no voltage / current / power limits.
-
@Whitley Forman indeed at the moment the backside irradiance calculation is based on a view factor model (in 2D) that is completely independent from the 3D shading scene, used for the front side. If there are shading objects close to the backside, you can include their effect in the parameter "Structure shading factor".
-

Polystring option (mixed orientation within a string)
Michele Oliosi replied to julmou's topic in Suggestions
Dear Alexander, No sorry as in the cases above, having a string (1.2.x.x in your drawing) with multiple orientations is not yet possible in PVsyst. -

How to simulate a PV plant with 2 different pitch inside
Michele Oliosi replied to jonipa's topic in How-to
Hi, Indeed. Actually you can change the limit to a higher value (main window > Settings > Advanced parameters), in your case 3° is ok. It doesn't change anything to the calculation. PVsyst computes the backside irradiance as if your trackers were horizontal anyways, so there may be a very small uncertainty on your yield. I would say that for 3° the uncertainty is negligible. -
This is what the help page tries to answer. The examples shown on the page are all for modules with either 3 or 6 (half-cut cell modules) submodules. The fraction for electrical effect should be 100% whenever the shadings are regular (regularly arranged rows, not many shading objects). If you have irregular shadings in that case you can decrease the electrical effect fraction.
-

Possible error in the Performance Ratio´s help section
Michele Oliosi replied to allanfisica's topic in Suggestions
Sorry no updates yet on the issue. -
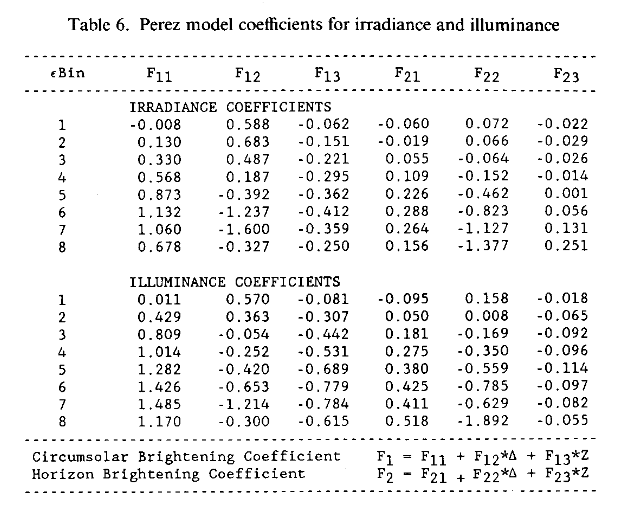
The horizontal diffuse is decomposed in circumsolar, and isotropic diffuse components according to F_1 (clearness, brightness, zenith angle) from Perez et al. 1990, Modelling daylight availability and irradiance components from direct and global irradiance: https://www.cuepe.ch/html/biblio/pdf/perez-ineichen 1990 - modelling daylight (se).pdf In PVsyst the horizon brightening obtained via the DiffuseHI*F_2 is then incorporated to the isotropic diffuse. Then the transposition factors are similar to Hay (meaning just geometry).
-
The following types of shading patterns were typically neglected in version 7.3, and are accounted for in version 7.4 (somewhat overestimated when they are irregular, i.e. not a long mutual shading like in screenshot #2). All of these shadings are due to the topography and should not be neglected, i.e. version 7.4 should be more accurate (albeit somewhat overestimated) than version 7.3. Since these shadings are partly irregular you could consider a factor for electrical effect somewhere around 80-90% to mitigate the overestimations, but it will be very hard for us to give you aprecise value that fits the whole scene: there are many different shading instances on the scene.
-
This is likely not a bug but part of the feature. But we would need to see your scene to be sure. First of all, I would recommend checking the two following posts https://forum.pvsyst.com/topic/3085-electrical-shading-losses-in-versions-73x/ https://forum.pvsyst.com/topic/3312-electrical-shading-losses-partition-model In version 7.3, the electrical shading losses were oftentimes underestimated. Now the partition model tends to overestimate irregular shadings, which is what it was originally intended to do. For irregular shadings (not just mutual shadings), you should use the fraction for electrical effect to mitigate this overestimation.
-

Simulate Terrain-Following Tracker Systems
Michele Oliosi replied to Valerie Chan's topic in Shadings and tracking
Actually the trick used is a bit more complicated. It involves calculating the POA irradiance that trackers would yield and then simulating with that POA irradiance. This is because at the moment it is not possible to import tracking angle data through the MET file directly, one needs to trick their way out of the problem. -

"Limit shading" profile angle
Michele Oliosi replied to Dominik Damberger's topic in Shadings and tracking
Thanks for the remark. Yeah if you consider modules that are less sensitive to shadings (such as half-cut modules) the optimum may change. This page has been written some time ago so I am not surprised it may need an update or two. -

Simulate Terrain-Following Tracker Systems
Michele Oliosi replied to Valerie Chan's topic in Shadings and tracking
Because these terrain-following algorithms are proprietary, at the moment PVsyst cannot model them. PVsyst will at the moment always apply the same tracking angles to the whole scene, to the exception of tracker axis tilt differences which will induce some partially adaptive behaviour. For very irregular topographies, you may change manually the parameters used by PVsyst to backtrack. In the 3D scene > backtracking management, you can manually adjust the top and bottom frames of the tables (increase them), which makes the backtracking a bit more conservative. Finally, some people use a method in which they create a new MET file using the tracker angles they have received from the tracker manufacturer. I believe people at Nextracker may help you with this, or some people on the forum may be able to use this procedure ?

