Search the Community
Showing results for tags 'meteofile'.
Found 7 results
-
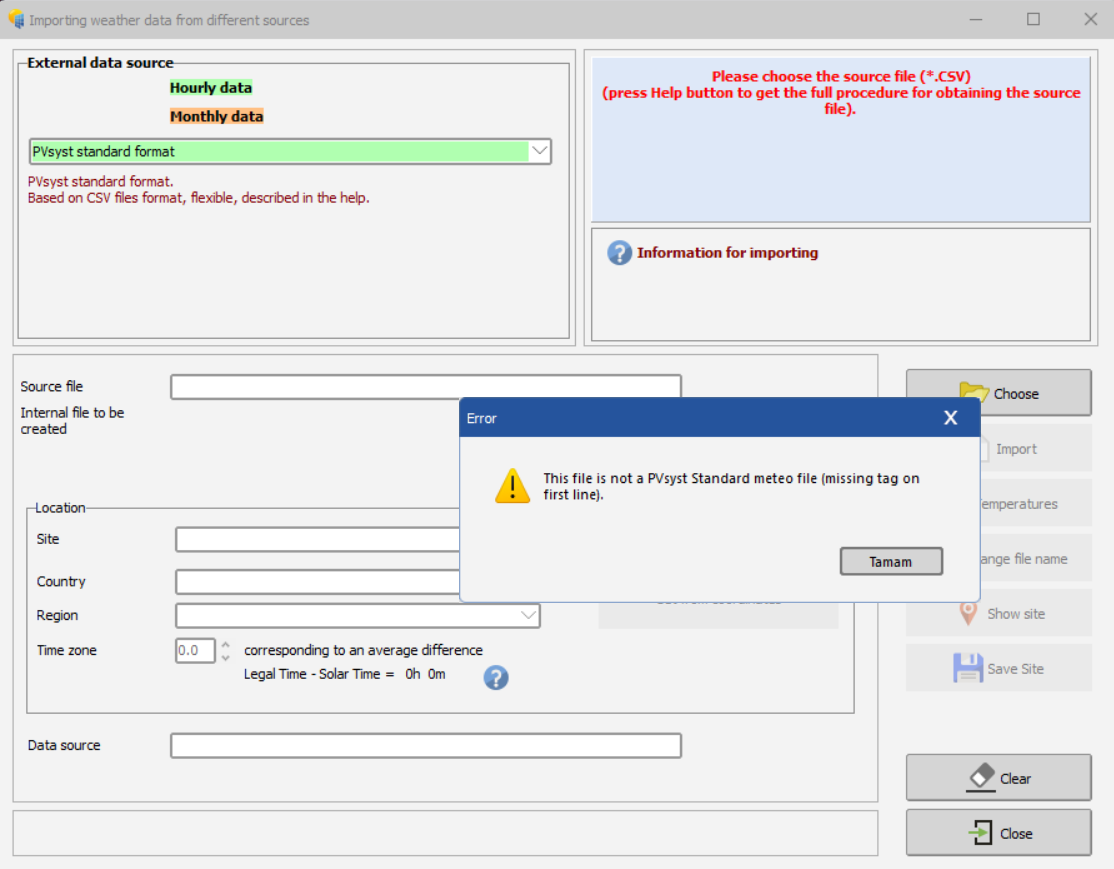
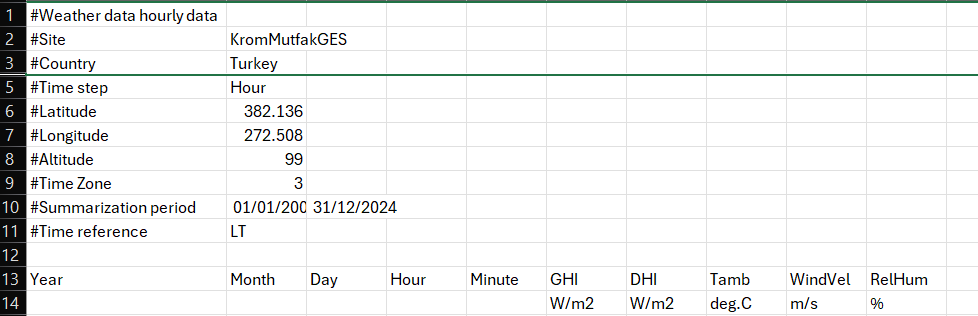
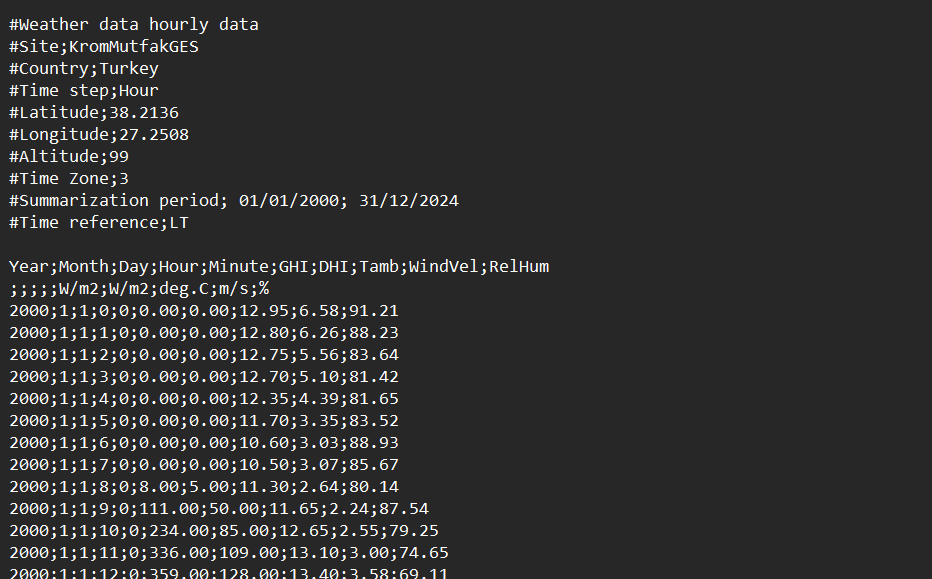
 Hello PVsyst Community, I am trying to import 10 years (e.g., 2014-2023) of hourly weather data (originally from Open-Meteo) into PVsyst as a single file, specifically using the Databases -> Import weather data -> PVsyst standard format tool. My goal is to have the full 10-year dataset available for PVsys's internal TMY generation. I am using PVsyst version 8.0 Following the detailed documentation (Help -> Importing weather data -> PVsyst standard format), I generated a single multi-year CSV file adhering strictly to the specification: First Line: The file starts exactly with #Weather data hourly data. Metadata Headers: Includes all mandatory #Tag;Value headers using semicolon separators. Data Headers: Includes the two required data header lines (first: Year;Month;Day;Hour;Minute;GHI;DHI;Tamb;WindVel;RelHum, second: ;;;;;W/m2;W/m2;deg.C;m/s;%). Data Format: Data rows use semicolon separators and dot (.) decimal characters. Encoding: Saved as UTF-8 without BOM. File Verification: The generated CSV file looks correctly formatted when viewed in Notepad, matching the requirements described in the Help file (See Image 1 - showing headers and first data rows). When I attempt to import this carefully formatted 10-year file using Databases -> Import weather data -> PVsyst standard format, I immediately receive the error: "This file is not a PVsyst Standard meteo file (missing tag on first line)." (See Image 2). This error occurs despite the first line being exactly what the documentation specifies and appearing correctly in the file itself. Has anyone successfully imported a multi-year hourly data file using the "PVsyst standard format" importer in PVsyst V8.0? Is there a known issue with this importer failing to recognize the #Weather data hourly data tag? Any insights on how to successfully import a multi-year file using the "PVsyst standard format" tool in V8.0 would be greatly appreciated. Thank you. İmage 1 İmage 2
-
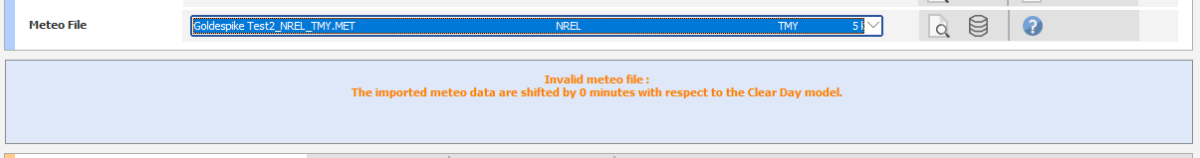
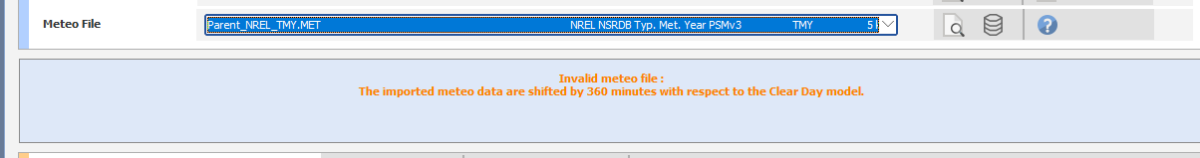
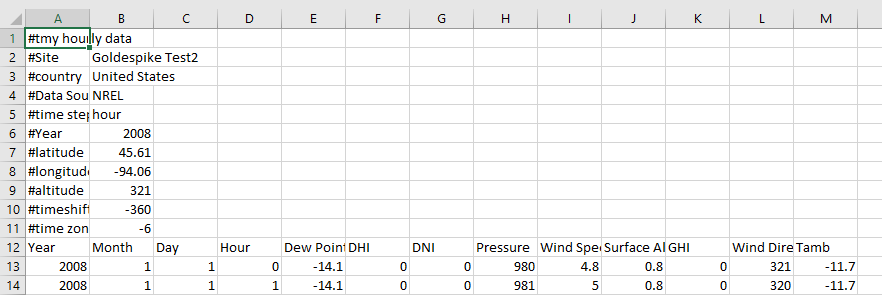
Hello, I was trying to create a .Met and .SIT file for an NREL meteo file. I used the "NREL NSRDB Hourly TMY" Data source and received an error for a 360 minute timeshift. I don't completely understand the functionality of timeshift, but after looking into there didn't seem to be a way to fix the error while still using the "NREL NSRDB Hourly TMY" source. My attempted solution was to take the NREL data and convert it to a PVsyst Standard format with the command #timeshift 360 in the 1st and second column. It appears to have updated the timeshift although I do get two errors now. I get a comment that "This file is not a valid PVsyst Standard Meteo file the line definining the unit is empty or missing". It still lets me go past this where i further receive the error invalid meteo file time shifted by 0 minutes. How can I go about fixing this?
-
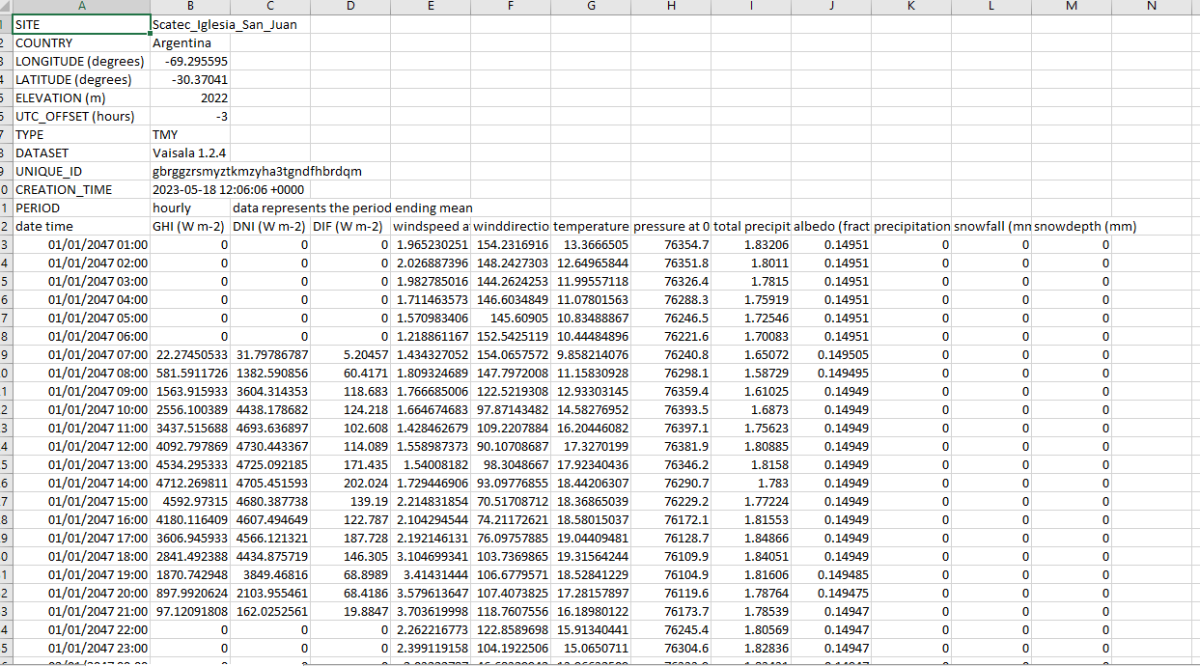
Hi, my name is Raul and I´m trying to import to PVS a TMY file that I did with a 3 year period real life data (see attached image), I did the following: 1) ) I took as a template a vaisala format, and substitute the vaisala numbers by the ones of the TMY I did with the real measure data. 2) I tried to upload the file using the Known format menu at the meteo bata base menu, but it do not recognize the file. Could you please let me know to import real world data into PVsyst for be used in a simulation. Thanks in advance. Best regards
-
Hello forum users, i am doing some research on the various Horizon sources available. i have chosen some meteo data i have used for previous projects and i would like to do a series of analysis for each one of them using: 1 - SolarGIS Horizon profile 2 - Meteonorm Horizon (from PVsyst web sources) 3 - PVGIS Horizon (from PVsyst web sources) my goal is to: compare the "far shading losses" and the Horizon line drawings considering the different Horizon data so to have a general overview of the differences between the Horizon datasets; of course my research will also include the study of the manuals and theory behind the definition of the Horizon profile provided by each one of the three Meteo database. i would like to raise a couple of questions: how far has to be an obstacle to be actually considered in the far shadings? considering the high dependency of the horizon from the exact geographical coordinates, are there any suggestion on the horizon profile choice regarding big PV plants? has someone of you undergone some similar studies? have you found some interesting results? also, considering point 2, a question for the software developers: are you considering a possible software update that would allow the user to set different horizon profiles, perhaps linking a single profile to a single subfield? thank you very much in advance for your contribution! Davide
-
Hello, I want to know the ambient temperature used in the monthly meteo data is which monthly average? Average of High Daily Temperatures Average of Low Daily Temperatures Average of Mean Daily Temperatures Thanks in advance
-
 Hello, I am using PVSyst version 7.2, I have created a template meteo file that contains irradiance (w/m2) and ambient temperature (c) iwhich I import as a custom file into PVsyst with an appropriate conversion protocol file (MEF). The imported file contains hourly expected data for the whole year (8760 hours) with only 24 hours changed to actual values representing the actual temperature and irradiance values of the day I'm considering that come from the sensors at site. In some cases, values for the amb temperature and irradiance are 0, which should result in PVSyst simulating no energy production during that time interval, however when performing the simulation and extracting the output file I notice that the amb temp and irradiance values for intervals that were inputted as 0 have changed and become positive and therefore pvsyst has simulated energy production when there should not be. Has anybody faced similar problems or might know a way around this?
 -
 I imported a SolarGIS TMY into PVsyst (7.2.11) and noticed that the meteo table shows, under the Interval Beginning column, months have fewer than 30/31 days in brackets. Image attached. It doesn't seem to have affected the numbers but a curious issue, nonetheless.