-
Posts
888 -
Joined
-
Last visited
Everything posted by dtarin
-
Export the simulation to excel and you will have hourly data. Include the elec. loss according to shadings in the output.
-

Does PVsyst factor in the movement of the windturbine blades
dtarin replied to Niels's topic in Shadings and tracking
Yes, the turbines in PVsyst will cast shadow, no, they do not rotate. -
If the ground terrain is not set to be a shading object (and hence not cast shadow itself), alternatively, you can leave it as-is. Note that if you do set the ground terrain to be a shading object, your simulation time will increase dramatically. For large sites, it may not be feasible. @Stéphane As far as I am aware, without it being set as a shading object, it is effectively transparent when it comes to the simulation, is this still the case?
-
The reason there was a difference in the attenuation is because I had trees present on the other array (20/0) to create a significant difference in the shading calculation to see how PVsyst compared in individual vs combined runs. With the trees removed, the attenuation in the combined run for the 20/15 orientation now matches the individual run of the same orientation. So it is worth noting there will be a small deviation in shading calculations if external objects or irregular terrain are present (my assumption on the latter).
-
I have not. As noted in the other thread, among the other considerations for bifacial, there is rear side IAM loss, which is not a loss that's provided but built into PVsyst, so there will invariably be a difference (and might be the largest contributor to the difference one sees).
-
This is worth highlighting. If PVsyst enabled this and users were able to define each inverter and their associated tables (or approximately close) as a unique subarray both electrically and with respect to 3D shading, then they each become an independent calculation path down the inverter level, and we could then get individual inverter outputs from PVsyst instead of a single combined figure, in addition to POA and other variables. There are some factors I am probably glossing over and other restrictions still in place (bifacial), but its likely better than a single model all mixed together with averages.
-
A monofacial fixed tilt test with two arrays with different ILR, orientation, and external shading had a difference of 0.05%, comparing the individual runs summed with a single combined run, which is reasonable (all on fast sim). With only a glance, it looks in the shading calculation for the 20/15 orientation there is a difference in the attenuation for diffuse and albedo in the combined run vs the individual run.
-
If PVsyst, removed the restriction to allow identical orientations in the orientations for fixed tilt systems, and allowed multiple orientations with tracker systems under orientation and enabled the option in the 3D scene, then users could model subarrays with independent shading. If there are other restrictions in place for trackers such as with POA or bifacial calculations, then for tracker systems, a straightforward implementation would be to require all orientations to be of the same orientation.
-
The ability for PVsyst to model different portions of a plant in the 3D scene to different subarrays is possible, it's already there for fixed tilt systems, there are just restrictions in place preventing it from working for other systems. For example in fixed tilt, several orientations must be defined in the orientations menu and they must be unique orientations, otherwise it prevents you from moving forward. Computationally there is no reason why we couldnt define two orientations at the same tilt and azimuth, its just a restriction. But if you had two unique orientations in the orientations menu defined, then in the shading scene , you could allocate one or more portions of the plant to different subarrays. I presume that when doing so, the shading calculations will be specific to the modules defined in the orientation menu of the 3D scene and thus apply correctly to the subarrays when using according to strings. For tracker systems, this is not possible, but if the several orientations menu in the 3D scene was enabled and the user allowed to create orientations with certain tables and allocate to different subarrays, then this would separate out the shading losses and be very convenient and moving the software forward to more realistically capture inverter level behavior to match operational data.
-

Bifacial and Monofacial Panels in a same system
dtarin replied to Omama Zaheen's topic in Simulations
Someone reported a difference on the forums . I would run a test, find the delta, then apply in MQF or post-process. -
Have you placed the modules on top of a building or some object in PVsyst? Looks to me that there is intersection between an object and the modules.
-
First solar modules have a linear response when shading is perpendicular to the cells. For flat sites and uniform shading, select linear shading. If there is terrain shading or other non-uniform shading, it may be appropriate to select a partition according to the string size with a low electrical effect, but ultimately depends on your site conditions and installation type.
-

Can we add the mptor gap and piles gap in trackers ?
dtarin replied to Nihal Meena's topic in Problems / Bugs
Increase the number of modules to account for the correct total tracker length or approximately close. The difference in shading calculations with and without actual gaps is not significant. -
You have answered your own question, temperature is considered in the output and losses due to temperature are shown in the simulation reports.
-

different inverter sizes in the same project
dtarin replied to mohamed abdelkader's topic in PV Components
Each inverter will need to be in a separate sub-array. -
What do you mean by unlimited single axis tracking system? Did you model this in the 3D scene editor, or did you use the unlimited sheds method?
-
Depends on the size of the plant and if there is an O&M service involved, etc. If its utility-scale with O&M (guaranteed response times, etc.), 2% is good. If it is a small site, you might want higher.
-
It is set by the user under detailed losses.
-
Horizon files need two columns, azimuth and height in degrees. Horizon data is not usually from a TMY weather file. For horizon data you can use PVGIS from within PVsyst. The PVsyst format there is for when you have Horizon data from another source.
-
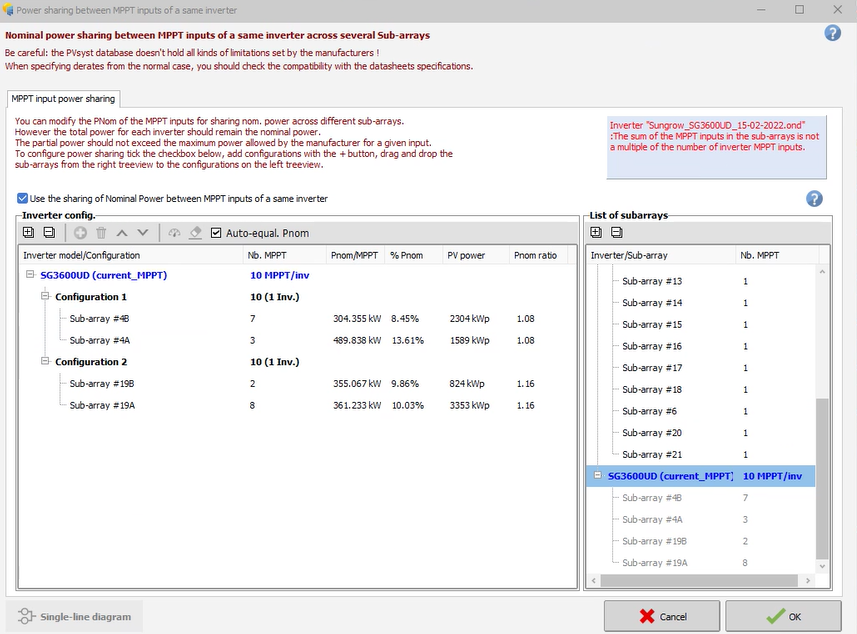
I have created a dummy OND file for power sharing and modeled together with a non-modified OND file. The non-mppt share inverter is showing up in the power sharing list and giving an error. I dont think the inverter should be listed in power sharing. The inverter is listed in the error and noted below with 1 mppt


