
André Mermoud
-
Posts
2075 -
Joined
-
Last visited
Everything posted by André Mermoud
-

Sandia Model Database no longer supported?
André Mermoud replied to linkeshd's topic in PV Components
The Sandia model is completely obsolete. It cannot be used without specific Sandia detailed measurements. And the latest available measurements are those included in the PVsyst database (recorede about 2005 ?). This model had been inplemented in PVsyst just for a comparison with the one-diode model of PVsyst. -
In PVsyst, the only way of creating Reactive power is to set a constant specified Power factor. This cannot depend on the grid voltage, or grid frequency, as these values are not an input variable of the simulation. The grid voltage is supposed nominal, without variations. The power factor may be specified also with grid storage systems.
-
AC Ohmic losses and transformer losses missing
André Mermoud replied to Niels's topic in Problems / Bugs
Probably your second screenshot corresponds to a stand-alone system, where the AC losses are not defined. -
You have 244 strings on 144 MPPT. I.e. 100 MPPT with 2 strings and 44 with one string. This means 244 x 25 modules = 6'100 modules - 1 module. First option: you neglect the string with 24 modules, and define one only sub-array with 12 inverters with "Use MPPT feature" unchecked. This will give a quite reasonable result with an error of 1 /6'100 = 0.2 per mille. The result will be fully reliable in PVsyst. Second option: the problem is that the PNom sharing within an inverter cannot be used when this inverter PNom is shared with other subarrays. In this case you have to define sub-arrays with a number of strings divisible by the number of MPPT inputs. Therefore if you want something more sophisticated, you should define 4 sub-arrays: - SubArray #1 with 11 full inverters and 223 strings (uncheck the option "Use Multi-MPPT feature). I.e. you leave 21 strings for the last inverter. - SubArray #2 with 9 MPPT inputs and 18 strings - SubArray #3 with 2 MPPT inputs and 2 strings - SubArray #4 with 1 MPPT inputs and 1 string of 24 modules. and you will define an explicit PNomsharing between the subarrays #2, #3 and #4. Hopefully this should give the same result as the first option, minus 0.02%.
-
No, we don't have any verification. This is a theoretical hypothesis, expecially for the coherency of vertical bifacial systems. This contibution is low for other orientations (tilts around 10-20°) . It is not taken into account in the simulations without Bifacial calculation.
-
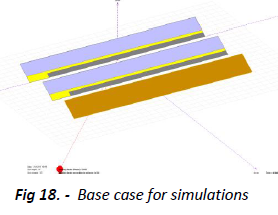
Yes, the optimizers may yield a little benefit, especially with irregular shading situations (building integration). With sheds arrangements, the benefit is really very low. For a simple system in sheds like this (3 rows of 16 modules in landscape on each table) the annual results (at Marseille ) are shown here for different optimizer technologies. NB: most optimizers on the market are "Buck only". Only SolarEdge uses Buck/Boost.

-
The irradiance incident on a tilted plane has basically 3 components: the beam, the diffuse, and a contribution of the reflexion of the sun's rays on the ground in front of (but far) from the collector plane. These 3 contributions are taken into account in the transpostion models. Now with bifacial systems, we work with the albedo of the ground just below the PV plant. This may be different from the albedo of the far terrain in front of the PV system.
-
Just a remark concerning your doubt about the warning "You should define at least one string per inverter or MPPT Input". This corresponds to the SubArray you are just defining: if you define N MPPT, you should obviously define at least N strings, i.e. at least one string per MPPT defined within this subarray.
-
PVsyst is a software for the simulation of PV systems, based on PV modules characteristics. The main parameters used for the establishment of the PV module model are the STC electrical values, i.e. mainly reflecting the efficiency of the module . This efficiency is obviously dependent on the coverage (glass) covering. But this is not dissociated from the efficiency of the PV cell itself. In other words, the glass transparency properties are included in the STC specification. There is no specific study of the glass transmission in PVsyst. Now the simulations are dependent on the incidence angle of the sun's rays. For this we define an efficiency curve, defined with respect to the efficiency at normal incidence. This curve may be measured, but this is a difficult measurement. We strongly trust that this behaviour follows the optical laws of Fresnel. See our FAQ https://forum.pvsyst.com/topic/1190-how-to-determine-the-iam-profile/?do=getNewComment
-
The LID is a loss which arises in the first hours of the array exposition. Therefore it is "present" in any simulation, whatever the simulated year. The aging is applied to each year, as a "yearly degradation". The loss due to the aging for the first year is the average between the beginning and the end of the year. I.e. a yearly loss parameter of -0.4% will induce an aging loss of 0.2% for the first year, 0.6% for the second year, etc. The value mentioned on the datasheets have nothing to do with the average aging degradation. These are the warranty of power for any module in the array. Please see the help " Project design > Array and system losses > Ageing, PV modules degradation "
-
With a PNom ratio of 1.25 you are at the limit of the overload. The global yearly contribution of your peak shaving savings is 33.6 MWh / 18’930 MWh, i.e. 0.18%, i.e. negligible. This cannot motivate the expense of a Peak shaving storage. During these months, you never attain conditions when the system output power exceeds the Power limit, so that you don’t have any peak shaving.
-
First of all: the one-diode model for the low-temperatures is correct down to about -10°C. With most modern modules, the one-diode model fails at very low temperatures, the voltage thermal coefficient is changing sign, meaning that the voltage is decreasing instead of increasing when the temperature diminishes. This may lead to an error in the Voc(TMin) evaluation for the max. nimber of modules. Please check with a linear model (for example by explicitly setting the muVoc value in the PV module definition (page "Additional data"), and specifying that the program should use this value in the "Project's settings"). Now the limitation of such a configuration is mostly dominated by the Power overload. When Power overload occurs, the inverter will move the operating point on the I/V curve towards higher voltages, therefore lower currents. This explains that the current limitation is almost never reached in usual configurations, it is always "preceded" by a power overload. Attaining the current limit is only possible when you define very short strings, at the limit oif the minimum voltage of the inverter. The PVsyst simulation completely manages all these situations. This is explained in the Help " Physical models used > Grid inverter > Inverter Operating Limits"
-
Slight edit to "IL" variable names in PVsyst Help Menu
André Mermoud replied to kjs55's topic in Suggestions
In the Power factor page, I thought that in this context the name E_GridApp is more explicit than EApGrid. This is here a generic value, nor supposed to correspond exactly to the PVsyst variables. The variables acronyms were chosen at the beginning of PVsyst (1992), with the constraint that they shoiuld not exceed 7 characters. -
No sorry, this is not possible in PVsyst in the present time.
-
In PVsyst the relevant capacity parameter is th C10 value. It may be slightly different from the rated capacity, usually set for 0.2C (discharge in 5 hours) or 0.5C (discharge in 2 hours). In the above dialog: the stored energy is calculated from the global values just mentoned above: 9830 V * 473960 Ah * 0.9 = 4193.295 MWh. However, in your screenshot, I can't understand the global capacity value of 473'960 Ah. The product 13'872 * 205 in parallel gives 2'843'760 Ah, i.e. as if there were 6 racks in parallel in your Battery pack. I can't reproduce this problem on my PVsyst installation. Probably there is something incoherent in the definition of your battery file. Please send it to us (support@pvsyst.com), in order that we can analyse this problem.
-
Many questions in a single péost ... Bifacial: I don't see well what you mean by the "calculation in EXCEL". The bifacial model calculation is fully described in the help " Project design > Bifacial Systems" The bifacial feature of the PV modules is described by the only parameter "Bifaciality factor", which is the STC performance of the rear side with respect to the STC performance of the front side. Shading calculations: except with the "Unlimited sheds" option, which uses an analytic calculation in 2D, the shadings calculations require indeed the 3D construction. The Transformer losses may be calculated from the transformer's datasheets parameeters, or generic loss factores for the Copper and the Iron losses. See the help "Project design > Array and system losses > External transformer losses" The auxiliaries losses represent the consumption of auxiliary devices (like cooler, computers, tracker motors, etc) that you want to be "deduced" from your sold electricity in the final balance. PReactive power losses: in the present time, PVsyst doesn't take the impedance (reactive "energy" loss) of the AC circuit and transformers into account. Therefore the power factor defined at the inverter output is the power factor as required by the grid manager.
-
There is no "a priori" constraints. This completely depends on what you want to optimize, the available area, etc... A "normal" DC:AC ratio, ensuring an oveload loss of, say, less than 1%, would be 1.25 to 1.3 (to be checked by the simulation). Now for some PV plants, the power injection to the grid may be limited by the grid manager. In this case it can be interesting to increase the PV array, in order to produce more energy, at the price of some additional overload loss, and therefore a diminution of the PR. Now the PR is not necessarily the good parameter to be optimized. In many cases this may be the total produced energy, the final system profitability, etc... .
-
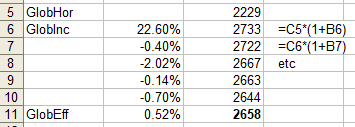
I don't know how you did your calculation. In EXCEL, we calculate:
-
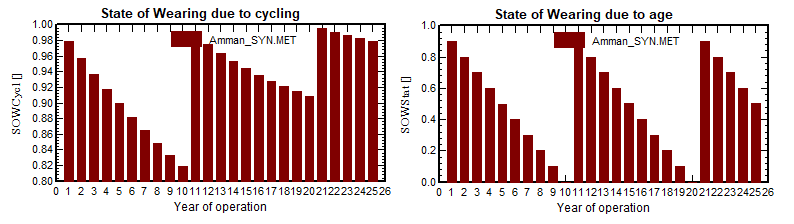
In PVsyst, the wearing state of the battery is evaluated through two variables: - SOWCycl = wearing state due to cycling - SOWStat = static wearing state (specified lifetime whatever it is used or not). These indicators are evaluated during each simulation. When using the "Aging tool", they are "chained" from one simulation to the next one. This indicates when you have to replace the battery pack. You can get them in the results: These losses are based on the battery definition properties. Now in the reality, the aging of the battery results in a continuous diminution of the capacity. The lifetime is usually defined as the time when you attain 80% of the nominal capacity. The simulation of PVsyst doesn't take this capacity diminution along the years into account. This is not very important, as the Capacity is not a crucial parameter during the system running: a variation of 20% has a very low effect on the final performance.
-
In the "detailed losses", you can define "Auxiliaries": this defines some auxiliary consumption, which may be a fixed value, or with a part proportional to the produced power (because the cooling needs may compensate the Power inefficiency loss of the inverter, about proportional to the produced power. This auxiliaries is accounted as a loss of the system, i.e. deduced from your PV production when selling it to the grid. Now it is you job to decide which losses you want to include in this contribution, i.e what you want to deduce from the produced energy. The aging tool (button "Advanced simulation" => Aging tool) ") takes the ageing of the battery pack into account from year to year. It will define when changing the batteries if necessary.
-
In a fixed planes system (sheds), the only effects of the pitch is the mutual shadings, i.e. the shading calculations. In tracking systems with backtracking strategy, the pitch also acts on the tracker's orientation when operating in backtracking mode (i.e. in the morning and evening).
-
This frame "Medium Voltage line" is supposed to treat the line from the output of this MV transformer to the injection. If you have 3 MV transformers, and one only connexion to the injection, the easiest way is to use the same length and a third of the section of the real line. NB: The objective is to evaluate the resistance of the full circuit, as seen from each MV transformer. If you have more complex circuits, you should calculate the global resistances of all your circuits by yourself, and define sections/length corresponding to your external calculation.
-
This is explained in our FAQ https://forum.pvsyst.com/topic/44-how-to-define-the-quotmodule-quality-lossquot-and-the-quotlidquot-parameter/#comment-44
-
Yes, the twin half-cut cells layout is speciified with each module (page "Sizes and technology"). This is taken into account in the "Module Layout calculation", see for example the help " Project design > Shadings > Electrical shadings: Module Layout > Shadings 3D calculation " In the partition in rectangle-strings, you should correctly define the partition. This is explained in the Help " Project design > Shadings > Electrical shadings: Module strings > Partitioning to account for electrical shading losses "
-
my inversor has 5 MPPTs but I only wanna use 4
André Mermoud replied to Estagiario's topic in How-to
I don't understand well. Your system defines indeed 5 MPPT inputs (1+1+2+1). Are you sure that your inverter is defined with 5 MPPT inputs (this is not in the PVsyst database) ? It probably defines 6 MPPT, so that the number of inverters is 0.83 (with one only decimal). The simulation will work correctly. The only effect would be the possible overload losses, as it is not possible to use the Power sharing option with incomplete inverters.