
André Mermoud
-
Posts
2075 -
Joined
-
Last visited
Everything posted by André Mermoud
-
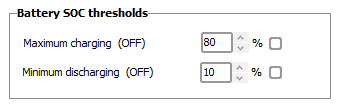
For the first question: as I said previously, please check what you have specified for your discharging hours. This probablx includes 14:00. Note that the values of the hour are shown at the middle of the hour (situation between 14:00 and 15:00 os shown at 14:30. Between 13:00 and 14:00, the graph shows that you have a solar production inferior to 50 MW, so that the battery will discharge itself for complementing it to 50 MW. The situation between 12:00 and 13:00 is a little bit more complex, as during this hour, the solar production passed from overload (charging) to not sufficient (battery discharge) state. Therefore the battery begins the hour by charging, and then discharging. For the second question, I really don't understand what you mean. The max. charging and min. discharging thresholds are specified by the user in the Grid storage dialog, page "peak shaving": If these values are exceeded in your hourly values, please send us (at support@pvsyst.com) the project, using "FIles => Export projects" in the main menu.

-

The Rs value changes after the newly created pan file is opened
André Mermoud replied to lhr's topic in Problems / Bugs
I don't know. Please send us (support@pvsyst.com) the corresponding PAN file, as well as the datasheet of the module -
In this tool, you have probably defined discharging hours which are already active during the end of the day.
-
Want to decrese the Temperture to increase the module
André Mermoud replied to SHOAIB's topic in Problems / Bugs
This frame "Internal Model result Tool" is just a tool for showing the behaviour of your PV module in any chosed GOper and TOper conditions. You can play with these values for getting the corresponding results. But this has no influence on the PV module parameters. The reference lower temperature for the sizing of the PV array is defned in the project's settings, frame "Site dependent design parmeters", item "Lower temperature for absolute voltage limit". -
Please remember the basic "function" of the PR: this represents all the losses in your system, from a reference input energy to the final yield E_Grid. The reference input energy ("nominal theoretical") is the energy you would have with the incident irradiation in the collector plane (Globinc [kWh/m2] * Array area [m2]) multiplied by the power which would be produced by your PV module when working at STC (W per kW), which is defined as the nominal (nameplate) power of your PV array. For this definition the temperature is obviously the STC temperature (25°C). Now the operating losses include the loss due to the array temperature. This is another thing which acts on the PR value. Normally you will have a higher PR in winter than in summer. The PR "corrected for temperature" is a tentative proposed by the NREL for the evaluation of the PR that you should find when you are measuring it on a little period in the year. This correction cannot be absolute, as it is based on an average TArray during a given period, which is not exactly the hourly TArray. However when calculating the PR corrected over the whole year, it should be equal to (close to) the global PR, which involves the instantaneous array temperature.
-
Simulation Losses Incompatible with Array Voltage
André Mermoud replied to Alexandre V Cavalheiro's topic in Simulations
Yes this is normal: with a Vmpp lower than 880V, you have losses due to an excessive current at the MPPT input. This loss is not accounted in your simulation, because in the parameters of your inverter, you have not defined the value "Minimum Voltage for PNom", which is equivalent to a current limitation. Without this parameter PVsyst cannot "know" that the current will be limited in your real system. According to the curve PNom f(Vin) above, this parameter should be set at a value of 880 V. This is fully explained in the help https://www.pvsyst.com/help/physical-models-used/grid-inverter/inverter-pnom-as-f-voltage.html Now in this particuar case, the PNom f(Vin) curve is not quite compatible with the hypothesis of the model described in the help (i.e. the violet curve). You have: At 100%, PNom = 215 kVA. With a voltage = 880V, this means a current = 244A (full inverter) At 40%, PNom = 86 kVA. With a voltage of 500V, this means a current = 172 A. Between these points the maximum current varies on the specified curve, but is constant in the simulation (violet dotted curve in the help). I don't know the "accuracy" of the real behaviour of the PNom limit within the inverter. Perhaps you will have to slightly decrease the value of 880 V for getting your exact waited E_Grid. -
No, we have not yet studied this in detail. And this is not on our urgent priorities.
-
First observation: the usual warranty for any module is usually about 15-20 % loss after 25 years, i.e. a max. degradation of 0.6-0.8%/year. I have never seen datasheets with a warranty of 90% after 25 years. Now in the random choice of the PV modules degradation when calculating the Monte-Carlo for the mismatch evolution, we should indeed limit the lower value to 0.8% * no. of year. This is indeed done as in our Monte-Carlo calculation the dispersion is limited to 2 * sigma, i.e. 2 * 0.4% with the default sigma values.
-
Yes indeed, PVsyst doesn't treat PV modules positioned diagonally on a table. I don't see any workaround for exactly reproducing this situation in the present time. The only way would be to define an equivalent area with usual layout. This will affect the linear shadings in the 3D scene, but the electrical mismatch loss cannot be evaluated. This will be valid for sufficienly big areas, where the sawtooth edges shape can be neglected.
-
No, these parameters IMP RMSDispersion and Vmp RMSdispersion don't describe an average degradation along the year. They are used for the evaluation of the evolving mismatch between modules along the years, due to the fact that the modules are not degraded in the same way. For a given year, each PV module is affected by a Imp/Vmp deviation, randomly chosen according to these parameters (Gaussian distribution). We calculate the corresponding mismatch loss for this year, which is an addiitional contribution to the average degradation loss. The modules are then further randomly degraded for the next year.
-
This is not yet implemented in PVsyst.
-
Yes you are right. The term is not well chosen. Here what is named RMS is indeed the standard deviation (sigma) of the gaussian distribution. You have statistically 68% of modules within the interval -Sigma to + sigma.
-
Diff. Orientations in the same string and same MPPT input
André Mermoud replied to Umut's topic in How-to
No, this is not possible, even in the version 8.0. -
The value shown on the loss diagram is the Pmpp as calculated from the one-diode model. It may be slightly different than the efficiency calculated from the Nameplate value 8PNom / module area). See our FAQ
-
The PV loss due to the cell (or array) temperature is related to this temperature in operation. This is controlled by the U-value in the "Detailed losses" parameters. See the help " Project design > Array and system losses > Array Thermal losses"
-
This is indeed an interesting question. But sorry, PVsyst doesn't provide this calculation. You should do that by yourself, using the suggestions mentione above.
-
The reasoning is the same for any optimizer. However you will not be able to do such a comparison with SolarEdge, as the inverters of SolarEdge cannot be used without optimizers.
-
The optimizers are useful for avoiding mismatch losses between PV modules, i.e. mainly when you have shadings and when you have a mismatch due to the differences between modules performances in a same string. However these devices have also their own inefficiency loss. If this loss is greater than the mismatch benefits, the final yield is lower.
-
Dual Row Trackers - Shading & Backtracking
André Mermoud replied to Adriano's topic in Shadings and tracking
Sorry, we cannot understand what you are doing. The images are completely unreadable. Please explain in more detail. On the other hand, if you try to analyze the differences in electrical shading losses, you are advised to analyse this specific loss on the loss diagram. Moreover, when doing such fine comparisons, you should use the full calculation of the shadings ("Slow" shading calculation, more accurate), -
Question #1: this is a calculation for one particuler sun position, and by clear day. The fraction for electrical effect is a parameters applied to the shadings along the full year. Question #2: by "regular shades", we consider indeed the bottom shades of the previous sheds in a sheds arrangement. However in your case the sheds are not so regular, as the altitudes seem to be different (you have shades on the 4th shed, but not on the second and the first one). For the evaluation of the "Fraction for electrical loss", you can perform a simulation with Module layout, and a simulation with the shadings "according to strings" with 100%. The ratio between the shading losses of both simulation corresponds indeed to the "fraction for electrical loss" that you have to apply.
-
The variance of the meteo data multi-year distribution is supposed to be the same for any future year. Therefore the ratio P99/P50 remains the same whatever the year. You can simply calculate P99 (YearN) = P50(YearN) * P99/P50 (Year0)
-
On this part of the report, the calculated average mentioned on the report is indeed the average of the soiling factors, not the soiling losses. It is not weighted by the effective irradiation. This indeed doesn't have much meaning when the soiling is highly inhomogeneous along the months. However in the simulation, the soiling loss is calculated at each hour, according to the irradiance. It is quite correct.
-
I really don't understand what you mean. The GlobInc value is the result of the transposition on the tilted plane, it doesn't include the soiling losses. The soiling losses are taken into account in the GlobEff result (effective irradiance on the collectors). NB: The GlobInc is not an average, it is a cumulated energy.
-
Inconsistent Inverter Performance with Uneven strings DC Blocks
André Mermoud replied to Marcos's topic in Simulations
No problem. This is quite well addressed by the PVsyst simulation. You don't mention the order of magnitude of the discrepancies between your blocks, but when the DC:AC ratios are not too high, the overload losses are only slightly dependent on the PV nominal power. You can simply try to simulate a simple system, with your different blocks independently, for the evaluation of the overload loss in each case. -
I don't know. The discrepancy is 0.12%, on a bifacial contribution of 5%. I.e. a global discrepancy of 0.006%. This is compltely negligible. This is not necessarily related to the option "according to module strings". We observe sometimes little differences in the simulations, often related to rounding errors. Except in some cases, we usually don't investigate discrepancies lower than 0.1% in yearly simulations.