
André Mermoud
-
Posts
2075 -
Joined
-
Last visited
Everything posted by André Mermoud
-
As i said, this is not yet implemented, but on our roadmap.
-
 The basic irradiation used for the PR evaluation is GlobInc, not GlobHor. I.e. the global incident on the collector plane. This is the irradiance value after the transposition. For example, in your first system: GlobInc = GlobHor * (1 + Global in collector coefficient) = 1994 kWh/m2 * 118.2 % = 2357 kWh/m2 This GlobInc value is also available on the monthly table.
 -
First of all: the simulation with 2 different kinds of orientation (tracking and fixed planes) will be possible with the version 8, to be released within some few months. Now for getting a merged performance ratio betweem 2 different simulations, you should come back to the PR basic definition (cf Help "Project design > Results > Performance Ratio"): PR = E_Grid / (GlobInc * PnomPV) You shoud add each components from both projects: PR (glob) = (E_Grid1 + E_Grid2) / (GlobInc1 * PNomPV1 + GlobInc2 * PNomPV2).
-
In the yearly simulation, the initial battery state has almost no impact on the yearly results. Now the initial state is a choice of PVsyst. There is no reason to suppose 90%, 100% or 10%. However this initial SOC may be modified in the advanced parameters. In the main menu, please open "Settings => Edit advanced parameters => Batteries", iten 301 "Initial SOC for simulation".
-
In your Subarrays definitions, you have defined 3 MPPT in each sub-array. If so, you should indeed define at least 3 strings in each subarray. Now in your case you have one string per Subarray, so that should define one MPPT input in each subarray.
-
The "Powr setpoints" that you mention here is indeed the limit nominal power for this MPPT input. This is not fixed in the inverter. This is the result of the "Power sharing" calculation by PVsyst, for ensuring that the PNom of the whole inverter is the sum pf the PNom of each MPPT input (according to their own number of PV modules). Answers to your questions: 1. During the simulation, each MPPT input is supposed to have a PNom corresponding to the value listed here. In the real system the limitation will be the Pnom for the whole inverter. 2. If you have MPPTs with, for example, 1 and 2 strings, you should always make sure that the Power sharing is activated. If all MPPT inputs of an inverter are within a same subarray, you should uncheck the option "Use Multi-MPPT feature". If the inverter inputs are distributed on several subarrays, you should use this tool for Power sharing.
-
Yes of course, this is what I explained above.
-
The tracking angle optimization doesn't work with diffuse thresholds. At each time step, the simulation evaluates the optimal tracking angle on the basis of the transposition model: the angle is adjusted in order to get the best transposition result GlobInc, considering the Beam and Diffuse components.
-
Find Nb. modules in a specific area using "Unlimited sheds"
André Mermoud replied to Søren Theilgaard's topic in How-to
In the "System" dialog presizing tool, the specified area is the modules area (the sum of all modules), not the ground occupation. -
PVsyst applies the default values (for getting -3% relative efficiency @200W/m2) to the PV modules of the internal database for which the Rserie is not defined. Now for the PAN files defined by the users, this doesn't make sense: the user should be able to define its own Resistance values. Therefore PVsyst doesn't modify these values anymore, except when these are not compatible with the one-diode model (i.e. Rserie > RsMax).
-
Sorry, this is an error in the translation tool. The first sentence should be read as "The PV array operating voltage (XX V) is over the required voltage for direct charging (YY V)" This will be corrected in a next version.
-
The SolarEdge architecture obeys very strict rules, established by SolarEdge. PVsyst strictly applies these rules. These rules namely define the compatibility conditions between the optimizer and the inverter models, as well as some maximum sizing and operating limits. For each association Optimizer - Inverter, there are limits, namely on the number of otimizers in series and the Maximum power. For this association, the Minimum number of optimizers is specified as 14. I don't lknow why. Please ask SolarEdge people.
-
While uploading Pan file the Rseries values is not modifying?
André Mermoud replied to hritik's topic in PV Components
Since V 7.4.6, the Rshunt and Rserie are normally kept as read on the file. However PVsyst ensures that the one-diode model can be applied. Namely, if the RSerie is greater than RSerieMax (the max. value for wich the model can be established), the RSerie is restricted to RSerieMax. If desired, you can modify these values in the dialog (for example, increasing RShunt will allow a higher Rserie). -
I don't see what you mean. I have just tried with the version 7.4.6 and this works quite well. Please send us the PAN file which is not correctly read (to support@pvsyst.com) NB: The Rshunt may indeed be modified, as it is rounded to something like 50 or 100 ohm, I don't remember. This is not significant in the model.
-
The BTR file is meant for use within PVsyst. It is not meant for external use. We don't provide support for it. These variables are internal to the model. For defining batteries in PVsyst, you should use the dialog within PVsyst.
-
How to do series simulation of heterogenous arrays
André Mermoud replied to Pranav Maheshwari's topic in How-to
Sorry, this is not possible in PVsyst. You cannot specify an heterogeneous string this is a simulation. -
This "Euro efficiency" weighted average was proposed by the "Joint Research Center" (center of the European Communities) in the years 1990. These weighting parameters were evaluated from the weather data of their location (Ispra, north of Italy). Another weithing is proposed by the US (CEC), based on the californian climate. It doesn't make sense to redefine these weighting parameters, as this is a "standard" distribution which defines the behaviour of many inverters.
-
Yes, same answer: PVsyst applies the rules edicted by SolarEdge. Please ask them. Now for the odd number of PV modules in a string of SolarEdge optimizers, this is indeed a weakness of PVsyst, that we have to correct in a next version.
-
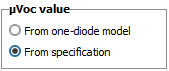
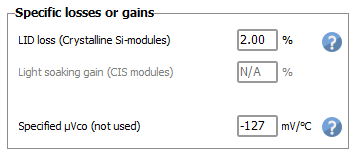
The Voc value as a function of the temperature is calculated from the one-diode model. See the help “Physical models used > Standard one-diode-model” This temperature coefficient muVoc (usually called Beta in the datasheets) is usually not equal to the value mentioned on the datasheets. If you really want to use the value of the datasheets for your sizing, you can define it explicitly in the PV module’s definition, page “Additional data / Secondary parameters”: And specify this option in the project’s settings, page “Design conditions”:

-
Sorry, your understanding about GlobInc seems erroneous. In the simulation, GlobInc is the result of the transposition from the horizontal plane (i.e. from GlobHor and DiffHor, taking the Albedo contribution into account). GlobEff is the resulting irradiance on the PV modules, after several optical losses like shadings, IAM, soiling, etc. Now when defining the PR from the measured POA data, you should make sure that these losses (especially the mutual shading on the diffuse when tracking) are not affecting your POA measurement. For this you should ideally position your solarimeter on the tracking axis, but far from the PV system for avoiding shades of the neighbour trackers. If not, the measured POA will be underevaluated, so that the PR will be increased. NB: The POA measurement may indeed be affected especially by the shading loss on diffuse/albedo. If needed, your final PR calculation result should be evaluated by correcting the measured POA. i.e. by adding the shading losses calculated by PVsyst.
-
Yes, this is a limit of the one-diode model. The one-diode model (Shockley equation) cannot be applied when the Vmp/Voc ratio is too high (greater than about 84% or slightly more). This is a limitation due to the diode exponential shape. In PVsyst we consider that the Voc is not important (not significant during the simulation). Therefore we have sometimes to increase the Voc value at STC for applying the model. This is especially the case for the STC data of new technologies like HJT or TopCON (nothing to do with n-type or p-type). Modifying this Voc value doesn't have a significant impact on the simulation results, whch are always operating around the Vmpp value.
-
The Voc value as a function of the temperature and the irradiance is calculated from the one-diode model. See the help “Physical models used > Standard one-diode-model” This temperature coefficient muVoc (usually called Beta in the datasheets) is usually not equal to the value mentioned on the datasheets. If you really want to use the value of the datasheets for your sizing, you can define it explicitly in the PV module’s definition, page “Additional data / Secondary parameters”: And specify this option in the project’s settings, page “Design conditions”:
-
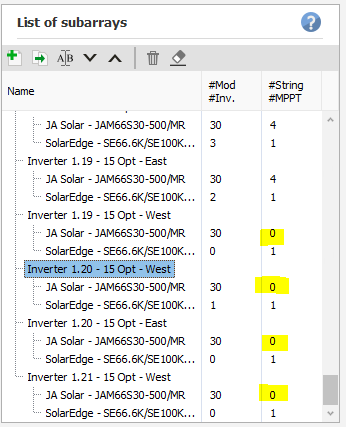
Your variant VC3 is indeed very strange. I don’t know how you got this situation. For correcting this: open “Strings configuration“. Execute “Reinitialize inverter list” and then “Adjust sub-arrays”. Then you come back to the Sub-Arrays definition. You have now at the end of the list: Delete each sub-array with a number of strings = 0 (use the bin in the menu of this frame), beginning by the last one. Then the situation becomes correct. You can add new subarrays if necessary (button “Copy selected subarray”). NB: this way of defining subarrays is not quite correct in PVsyst. As all the inverters are identical, a better way would be to define one only subarray for each concerned configuration (i.e. Number of optimizers – Orientation). Then choosing “Strings configuration” => “Reinitialize inverter list” will reattribute a string to each Inverter input in a more comprehensive way. You should then execute “Adjust sub-arrays” if PVsyst requires it before exiting this window.
-
Please open "Strings configuration" and click "Adjusts sub-arrays".
-
You are using SolarEdge optimizers. In the inverter’s list, you have probably modified the Inverters inputs, and the concerned sub-array is not connected to any inverter anymore. If this is the case, please suppress this subarray.