-
Posts
887 -
Joined
-
Last visited
Everything posted by dtarin
-
Did you save and exit the shading scene? There is often a dialog that appears to require the user to resolve the discrepancy between shading scene changes and the initial orientation.
-
The auto altitude function works for fixed tilt systems, but does not adjust the tilt for trackers. There is an automatic tilt function available when creating a zone of trackers, but if the tables are already created, there is no way to adapt their tilt to the terrain, only their elevation. It would be great to add this feature.
-
The number of transformers doesnt really matter in PVsyst, it will create a single transformer for the transformer loss calculation. For ohmic losses, calculate the total weighted average power loss for the entire system and use that for the medium voltage line input. From your previous post, if the total power loss of both circuits is 0.60%, that is what you will enter for loss fraction at stc (assuming that value was calculated at stc conditions). Regarding your previous post , the average loss would not be 0.1% for each transformer. In each circuit, each "leg" is carrying a different current value. The first leg is 1/3, the second is 2/3, and the last leg is 3/3.
-
Certain software can export PVC files - PVcase (autocad), pvDesign, helios 3D, to name a few.
-
What I described will accomplish this.
-

Nb. of modules in width (unlimited sheds)
dtarin replied to Gonzalo Piedra Mendoza's topic in How-to
Inactive band does not refer to module spacing; module spacing is a separate entry in pvsyst. Inactive band refers to a physical structure extending out past the modules which will cast shadows. -
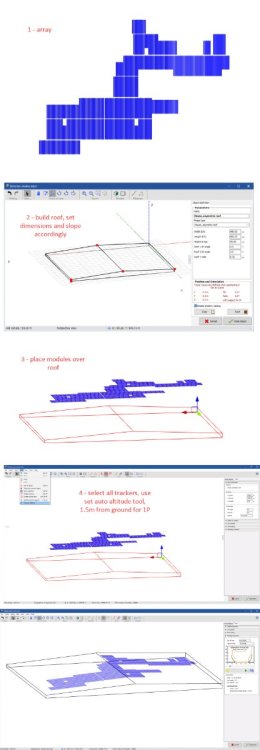
You can import ground terrain in a number of ways, or you can create an object which slopes in the directions you want, and then drop the trackers on top. It will depend on what you're currently working with and what the purpose is. For example, you can create a large house for a very simplistic and uniform E-W slope and select the modules for each side and drop onto each half of the house using Edit > Set Auto Altitude. The tilt for each side of the roof can be easily set from within the block settings.
-

Nb. of modules in width (unlimited sheds)
dtarin replied to Gonzalo Piedra Mendoza's topic in How-to
In a fixed-tilt system, it is related to the number of vertical modules, and defines how many electrical partitions you have in the vertical direction. This determines the electrical effect losses due to shading. Inactive bands are typically set to zero; this refers to a support structure which extends past the module. -
If tilt is zero, you dont need to consider mixed orientations. Just create two subarrays, each with 2 inverters, and the number of modules/strings per roof for each.
-
Also, when using PVC files or you have any shade scene where individual tracker rows are being modeled, you will need to use the backtracking management option and select a representative pair.
-
Shading will be accounted for, and will reflect the different heights and tilts for calculating shading. In terms of tilt, the POA irradiance will be adjusted depending on the average tilt of the shade scene. This is done automatically by the software.
-
Use total module length. This is standard practice
-
Same OND files? Is one using MPPT share and the other not? Post screenshots from System menu showing the arrays for each.
- 4 replies
-
- inverter loss duo to nominal power
- simulation
-
(and 1 more)
Tagged with:
-

DC Voltage drop losses value with Bifacial Modules
dtarin replied to Sergio Alonso's topic in Simulations
Ohmic loss inputs in PVsyst are up to the user to define, so you should be considering the current under bifacial conditions when sizing your cabling and determining voltage drops, etc. PVsyst will consider the hourly I^2 x R losses inclusive of bifacial gain, but this is not determining what the initial input is, that is determined by the user based on their design. -
This approach is necessary, far shading doesnt take into account the electrical losses, only irradiance loss, and not down in the plant level. It is a global loss applied to the entire site, whereas with topography in the shading scene, you might have shading only on certain portions of the plant. If you have complex topography, it would be advised to understand the shading losses in some way or another, whether you account for that inside PVsyst or outside. If you have table penetrations, you have two options. You can increase the table spacing under the zone settings, the default value is 0.2m. Or under tools, disable field interpenetration check. That is quite the terrain you have there. Is this an actual site, or just a test?
-

"Automatic altitude" tool gives same result with all 3 settings
dtarin replied to julmou's topic in Problems / Bugs
Check if that is the case with fixed tilt tables. This feature was made well before we were able to model tracker tables independently and place onto terrain. -
Your screenshot is showing for a high voltage input (P in_DC, P Out_AC) in W
-

Bifacial modules on a flat white roof and microinverters
dtarin replied to Nader Shaheen's topic in How-to
That could be too high, degradation of albedo will mostly occur in the first 2 months to 1 year, and level off after that. It will depend on your roof, materials, location, weather conditions (i.e. rainfall), whether the white roof is new or pre-existing, etc. Look for studies on the subject. -
To do both simultaneously, 1) modify the OND file to the inverter limit, 2) set grid limit to limit at a second value at the injection point, account as a separate loss. You can also do all of this post-PVsyst without modifying the OND file, but you will need to account for the AC losses separately as well.
-
Set to both nominal and max. Generally a limitation at the injection point supersedes, or is more common, than a limitation at the inverter. Setting an inverter limit means the inverters are being curtailed, and are being modified by the inverter manufacturer with an adjusted nameplate (they will be providing a letter to certify the new nameplate, etc.). It all depends on your project requirements, what type of installation, grid requirements, etc.
-

Bifacial modules on a flat white roof and microinverters
dtarin replied to Nader Shaheen's topic in How-to
This should be under 'How-to' or 'Simulations' -
Check your OND file. If on the Output Parameters tab, Nominal AC Power definition is set to Apparent power, you will need to select in Energy management > Power factor "inverter PNom defined as Apparent Power", and if applying a grid limit, on that tab, under specified power factor, select limit in active power
-

Incidence angle and profile angle of unlimited trackers
dtarin replied to Doris's topic in Shadings and tracking
Unlimited sheds are facing south, unlimited tracker at -22 are facing east. -
add dummy mppt to OND file, share the inputs in one of the inverters between two arrays with two different panel types. you will not have one module type per inverter.


