
André Mermoud
-
Posts
2075 -
Joined
-
Last visited
Everything posted by André Mermoud
-

Inverter output power by .OND file
André Mermoud replied to Andrés Fernández's topic in PV Components
It uses the last two points. -
Yes indeed, one only other user reported this error. The error is indeed the unit's name, which should be MWh/year. With this the value itself is correct. I really don't know the origin of this error. I tried to secure some initializations, but I really cannot reproduce this problem, so that I can't be quite sure that it has been corrected. The user who had reported it cannot reproduce it, too. If you get this problem in a stable way, please send us you whole project, using "Files => Export project" in the main menu. Please send it to support@pvsyst.com.
-
No, due to by-pass diodes, the hot spot situation is not supposed to arise in normal operation.
-
Yes of course. If you don't check this option, there will not be any losses due to the HV transformer, nor the line after this transformer.
-
Inverter output power by .OND file
André Mermoud replied to Andrés Fernández's topic in PV Components
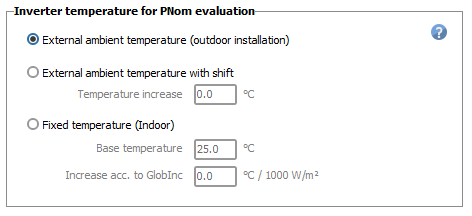
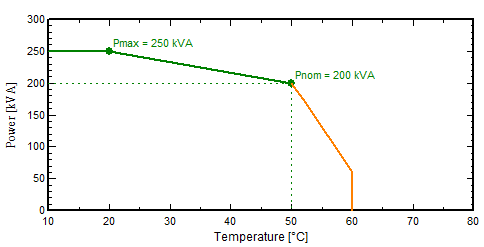
When you have a nominal power, defined up to a given temperature, say 50°C, and an enhancced maximum power up to lower specified temperature, say 20°C, the simulation will use the curve shown in the inverter's definition dialog, page "Output parameters": The inverter temperature to be used during the simulation is defined in the "Energy management" dialog: Now the efficiency curve is specified by points at different powers, and interpolated between these points at each time step. If the actual power is over these points, the efficiency curve is simply extended linearly.
-
Sorry, no progress in the present time.
-
IRev is calculated according to the expression mentioned above, by neglecting Rserie (put Rs = 0). This expression gives the IRev as a function of a specified voltage. Iph is the short circuit current for this shaded cell.
-
In PVsyst, the model for the reverse characteristics is this quadratic expression. This corresponds rather well to the reality, but this is a rough approximation. By the way the values of this model have a quasi null impact on the PVsyst simulation results. Now the term (Rserie * I) is indeed a little contribution (perhaps it should not be taken into account, we will check). You can forget it.
-
This tool shows what happens for a specified current (i.e. imposed by the rest of the string). You can drag the red point of this forced current for analysing what happens at different values. The voltage of this point is the result of the reverse characterisics model: You can find this formula in the help https://www.pvsyst.com/help/physical-models-used/pv-module-standard-one-diode-model/reverse-characteristic-of-a-cell.html The temperature is obtained by applying the U-value on this cell, taking the dissipated power as input parameter instead of GlobInc.
-
First of all: the value 1.9% is related to the total energy flux of the system. The real "round trip" efficiency of the battery pack should be related to the energy passing through the battery. This is mentioned as 5.3% here. I don't know where your affirmation of 85% comes from. This is extremenly fluctuating according to sources. Some Li-Ion battery manufacturer mention 95% on their datasheets (which is probably not realistic), others 90%, rarely less. Due to the extreme complexity of the battery model, especially the SOC evolution according to the charging/discharging balance, the determination of the battery efficiency cannot be quite reliable in the PVsyst simulation. This issue is fully explained in the help https://www.pvsyst.com/help/physical-models-used/batteries/battery-model/battery-efficiency.html?h=battery+efficiency
-
In this tool, PVsyst tries to evaluate the temperature of the reverse-biased cell, as a function of the power consumed in this cell and the U-value (with resp. to 25° ambient). In this case this is not dangerous, but in usual modules the cell temperature may become very high: this is the hot spot problem.
-
Yes, this is an error in the report. This represents indeed the loss at the output MV line of the Transformer. We will correct this for the next version. When defining the wiring losses in PVsyst, the frame "Array wire loss inverter to transfo" concerns the connexions from the inverter to the transformers, and "Medium Voltage Line" the output of one transformer. The evaluation of the wiring loss is indeed a direct calculation of the loss, at each hour, according to the specified wire resistance and the instantaneous current. There is no uncertainty here, as far as the resistance is well defined. When specified as a percentage at a given power, the resistance is directly calculated from this loss (no error). The only uncertainty could be the resistivity variation according to the wire temperature: in PVsyst this is defined for 50°C, the variability being 0.39 %/°C.
-
Some answers to your questions: Module Mismatch Losses: Currently set to 1%. - This depends on the sample of PV modules you are installing. Not on the technology. String Voltage Mismatch Losses: Currently 0.1% - Idem, by the way this is an extremely small correction.. Module Quality Loss: Default. - This is a parameter at your disposal. You can put here what you want. But the default is based on the tolerance, it doesn't depend on the technology. LID Loss Factor: Set to 0% for N-type modules. It is indeed null for N-type cells. Otherwise the value should be set according to the manufacturer if available. For example, HPBC claims better shading performance — can mismatch losses be reduced? - This is indeed implemented in the ModuleLayout calcuation. But don't wait for a significant improvement of the shading loss ! (see the Help https://www.pvsyst.com/help/physical-models-used/pv-module-standard-one-diode-model/pv-module-reverse-lowvoltage.html?h=ibc Are there other parameters I should modify to better reflect these technologies? - If modifications are necessary, they will be in the PV module definition and modelling. We are currently studying this but we don't have definitive conclusions yet. The main workaround we can propose in the present time is to increase the Voc specified at STC when you cannot establish the one-diode model (i.e. when the RSerie cannot be specified for the required low-light performance).
-
Yes, sorry, I completely forgot mentioning this in my last post. The correction I had done in the program has not been taken into account for the published version 8.0.8. This should be corrected in the next version 8.0.9, to be released still this week. In the meantime, the only way of modifying this value is to set the parameter “Arev= 1000” directly in the PAN file. And with this PAN file you should not enter the page “Additional parameters” of the PV module definition dialog.
-
Battery lifetime expectancy - Total energy stored?
André Mermoud replied to Sylvai Vitali's topic in Simulations
The energy stored in the battery during the year - mentioned on this Sankey diagram - is indeed the value calculated by the simulation for the actual battery capacity specified for this simulation. In the present time, the battery capacity decrease according to the ageing is not taken into account in the ageing tool (this feature is on our roadmap, but will not be implemented before several months). Therefore you can indeed perform a simulation for the last year of the battery life, with a battery capacity diminished by 20%. However don't wait for a big difference: the battery use during the simulation is not very sensitive to a diminution of 20%. NB: don't confuse the self-consumption with the capacity diminution, they have nothing to do with each other. The self-consumption may also be dependent on the age of the battery, but we don't have any information about this. -
PVsyst Aging _ Clarification on Degradation Calculation in PVsyst
André Mermoud replied to Kanagavel K's topic in Simulations
Answer to Kanagavel above. No, the ageing represents an ageing from year to year. There is no reason for being different during the first year. The first year differences should be accounted in other loss kinds like LID or Module quality loss. -
PVsyst Aging _ Clarification on Degradation Calculation in PVsyst
André Mermoud replied to Kanagavel K's topic in Simulations
Yes, the red behaviour indicates the global degradation to be applied for each year, taking the mismatch evolution into account. The black line is the warranty of the PV modules manufacturer, that you may define as you like. It is indicative. -
Sorry, I don’t know what should be improved. The result is highly depending on your system. If more than 3 cells are shaded at a time within a submodule, you should not see any difference. Please carefully read the help https://www.pvsyst.com/help/physical-models-used/pv-module-standard-one-diode-model/pv-module-reverse-lowvoltage.html?h=ibc If your system is "regular", there are probably very few hours in the year concerned by this condition.
-
For the storage in batteries, PVsyst treats the AC production as a whole, without discrimination between inverters. But the problem is probably not here: as I understand you want to shift the PV production to hours where the tariff is more favorable. Sorry, this is not yet implemented in PVsyst. This will be done within some months.
-
PV Output considering Irradiance and Temperature
André Mermoud replied to HadiK's topic in PV Components
The usual PV modules operate following the one-diode model, in the same way. The model covers the "extreme" conditions. There is no "special" behavior for some specific modules. -
The LID loss is not related to the long-term degradation. The long-term degradation is applied to the module performance at the beginning of the simulation step. Now applying the LID loss before or after the long-term loss in the loss diagram has no real importance. However you are right: in the present time, during the simulation, the LID loss is accounted as a percentage of the degraded PV module, when it should remain as a percentage of the initial (not degraded) module. The error is very low, but we will correct this in the simulation for a next version.
-
Battery lifetime expectancy - Total energy stored?
André Mermoud replied to Sylvai Vitali's topic in Simulations
The battery end of life is not a well-established criteria. As I said, the number of cycles guaranteed by the manufalctrers is sometimes based on 80% and sometimes on 70%. And the number of cycles you can accept for your own instalation depends on your requirements (kind or use of your system). We will consider to provide this as an option in a next version. -
PVsyst Aging _ Clarification on Degradation Calculation in PVsyst
André Mermoud replied to Kanagavel K's topic in Simulations
Please observe that the degradation specification of the PV module manufacturers is not the degradation factor. It is a warranty on the power of each PV module individually. The long-term degradation of the whole PV system is an average of the real degradations of all PV modules, which is indeed less than the warranty limit. Moreover, the LID is an initial degradation which has nothing to do with the long-term degradation. The initial value of this warranty curve (usually -2 or -3%) may represent sometimes the LID degradation, but also the uncertainty of the Power measurement (at factory) of each PV module. In PVsyst, the LID loss is specified independently in the "Detailed losses". It acts over the whole simulations (i.e. the whole life of the PV plant) as a permanent diminution of the real PV module efficiency. This is explained in detail in the help https://www.pvsyst.com/help/project-design/array-and-system-losses/ageing-pv-modules-degradation/index.html?h=degradation Now for the long-term degradation of a given year, the PVsyst simulation result represents the average degradation along this year, i.e. the average of the degradation value between the beginning and the end of the year. This is the reason why the degradation of the first year uses half the annual coefficient (and the next years use 1.5, 2.5, 3.5, etc). -
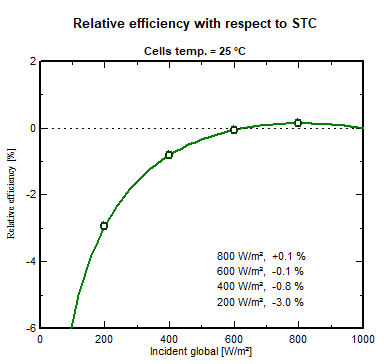
The "loss" due to irradiance level is related to 2 factors: - The low-light performance of the PV module - The irradiance distribution along the period of simulation. Please check the low-light efficiency of your module ( PV module dialog, page "Model parameters => Rshunt-RSerie", option "Rel effic" 😞 The default of PVsyst (reasonable for most modules) is -3% at 200 W/m2. Now when distributing their own PAN files, most manufacturers set the Rserie parameter for boosting this value, to -2% or even -1% . In this case you have a large part of the curve with positive relative efficiency, i.e. a gain during the simulation at high irradiance.
-
Battery lifetime expectancy - Total energy stored?
André Mermoud replied to Sylvai Vitali's topic in Simulations
The capacity slightly decreases when using the battery. The battery life (number of cycles specified by the manufacturer) is defined as the situation when the capacity drops below a given threshold. Traditionnally, this limit was usually 80%. Since some years, several manufacturers consider a drop down to 70% of the initial capacity. This is not always mentioned on the datasheets. The discrimination between input or output of the battery (efficiency, around 5%) doesn't make much sense as the uncertainty on the number of cycles is much much higher.