
Linda Thoren
-
Posts
355 -
Joined
-
Last visited
Everything posted by Linda Thoren
-
Hi, With the latest PVsyst version, automatic mode for diffuse shading calculations for systems that involve trackers has indeed been removed. Now, users are required to manually define a representative tracker for diffuse shading calculations. You define a representative tracker by clicking “Tools”, “Trackers diffuse shading definition”. In this tool you can choose to calculate the diffuse shading factor for all trackers, or select a representative tracker that will be used to evaluate the diffuse shading factors You can find more details about this update and instructions in the PVsyst Help documentation here: PVsyst Diffuse Losses with Tracking Systems. Kind regards,
-
Dear Nikoloz, P90 estimations rely on yearly data. Calculating P90 for monthly values is not advised. Yearly weather data has variation (around 3-4% RMS), while monthly data can vary significantly year-to-year, leading to unreliable probability profiles for each month. You can read more about the P50-P90 evaluations in the Help in the link below: https://www.pvsyst.com/help/index.html?p50_p90evaluations.htm Regards
-

ERROR IN NEAR SHADINGS 3D - ORIENTATION - PVSYST 8.0
Linda Thoren replied to JoaoReis's topic in Shadings and tracking
Hello, Indeed, with PVsyst version 8, automatic mode for diffuse shading calculations for systems that involve trackers has indeed been removed. Now, users are required to manually define a representative tracker for diffuse shading calculations. You define a representative tracker by clicking “Tools”, “Trackers diffuse shading definition”. In this tool you can choose to calculate the diffuse shading factor for all trackers, or select a representative tracker that will be used to evaluate the diffuse shading factors You can find more details about this update and instructions in the PVsyst Help documentation here: PVsyst Diffuse Losses with Tracking Systems. Kind regards -
Your Pv system is not suitable for the bifacial 2D model computation
Linda Thoren replied to Pranav's topic in How-to
Hi, Indeed, a system with different sized tables are not suited for the bifacial 2D model. In the new PVsyst version 8, you can possibly work around this by creating 2 subsystems, one for all the panels with a certain table size and a second for the rest. In the orientation window, define two orientations (even though they have the same tilt and azimuth) and in the 3D scene, separate the tables per table size and assign them to the 2 different orientations you have defined. Like this you can define the bifacial parameters (in the system window) for each "orientation" (sub-system) and thus get around this limitation. Kind regards -
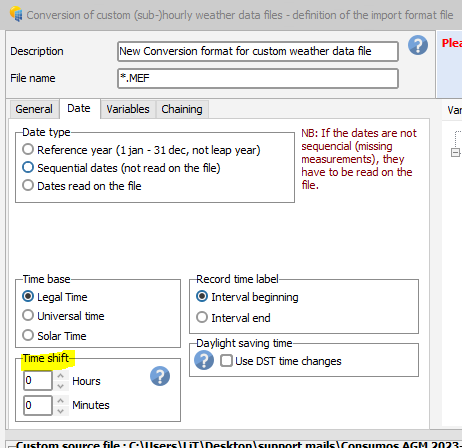
Hello Jig, Indeed your workflow is correct and it is not clear to me what the issue could be, if it is possibly the datafile that is strange our something in the PVsyst reading of it. I note that there is no time zone value (though a local time) in your file. If you add the correct time zone in the data file, does in affect the .MET file? If you look at the Monthly best clear days graph, do they look correct and correspond to the values in the data file? Can you please send us your specific data file to support@pvsyst.com and we can analyze this in more detail. Kind regards
-
Indeed this is now possible in version 8! You should define two orientations, one in west and one east, either with unlimited sheds (that doesn't require a 3D scene definition) or fix tilted planed where you should also define the layout in the 3D scene. Define each sub-system in a sub-array and define the bifacial parameters for each sub-array (height above ground etc)
-
Hello, How have you imported this weather file? through the project window, known format or a custom file? where is your site? If there is a time shift you are recommended to re-import this file and include a time shift in the Date tab (if imported as a custom file, though Meteonorm data and NREL data can be imported with correct format for your site automatically normally if imported directly from the Project window, or as a known format If you have imported your file from the project window or as a known format, please send us your project to support@opvsyst.com and we can review the issue in further detail. Kind regards

-
Hello, As a contrary to the usual architect's conventions, in PVsyst we consider: In northern hemisphere, the plane azimuth is defined as the angle between south and collector plane. This angle is taken as positive toward west, i.e. goes in the antitrigonometric direction. => south azimuth = 0, north azimuth = 180°, west azimuth = 90°, east azimuth = -90°. In southern hemisphere, the plane azimuth is defined as the angle between north and collector plane. This angle is taken as negative toward east, i.e. goes in the trigonometric direction. => north azimuth = 0, south azimuth = 180°, west azimuth = 90°, east azimuth = -90°.
-
Hi, How have you imported this weather file, where is your site and what version of PVsyst are you using? In general, if you try to import Meteonorm data directly in your project, or as a known format this shouldn't be an issue. If the file is imported as a custom file, a time shift can be added in the Date tab. The denomination of a given time interval in PVsyst is always defined as the beginning of this of this interval, contrary to Meteonorm where it is in the end of the interval. Perhaps the issue could also be if you are in-between two time-zones. If you don't find the source of the issue, please send your project/ site and weather data to support@pvsyst.com and we can have a closer look at it. Kind regards
-
Far Shading Increase After Change In Weather File
Linda Thoren replied to dbrown's topic in Shadings and tracking
Hello, The .SIT file includes the coordinates of your system, if the coordinates have changed it is possible that the far shading (the horizon line) have changed too since this is also based on the coordinates of your system. Kind regards -
The performance of your system will degrade with time. The goal with these tools is to evaluate the PR after a certain amount of year. The PR will not be consistent if you are including a degradation and the PR will be a result of the simulation. The aging is further explained in the following youtube tutorial: To simulate the performance of your system every year and evaluate the production after 25 years of production you can also use the aging tool in the advanced simulation:
-
Yes indeed, the performance ratio (PR) will change if the system is aging.
-
Hello, The P90 statistical estimations are based on yearly values. P90 for hourly or daily values (or even for monthly accumulations) doesn't provide meaningful results due to the high variability of short-term weather patterns. Kind regards
-
Great! In the Shading scene window, you have access to a list of your object and their characteristics (azimuth and tilt of your tables for example) by clicking Tools, List and management of objects (or by by clicking Ctrl G). Through this window you can also change these values and your 3D scene will adapt.
-
Hello Vladislav Iliev, To simulate a a vertical East West bifacial system in PVsyst you can as the error message either define the field type "unlimited sheds" (no need for a 3D scene since you here define the parameters such as the pitch etc.) or "Fixed tilt plane" where you need to define regular arrays in the 3D scene. For a East West system you have to define either East or West, and the backside of your bifacial panel will be facing the second orientation. In the current version of PVsyst, Bifacial systems are limited to one orientation only and regular arrays. Please read the following PVsyst help page about the Bifacial model conditions and certain values in the advanced parameters that can be modified to be able to get around some of these constraints: https://www.pvsyst.com/help/bifacial-conditions.htm We also have a series of youtube tutorials of the model conditions and different ways to define your bifacial system: In PVsyst version 8, coming out later this year, it will be possible to simulate a bifacial system with multiple orientations. Kind regards,
-
Hello Oliveira, This can be done by creating a second sub-array (see the list of sub-arrays to the right in the system window) and use the multi-MPPT feature. Please see the tutorial below about how to create several sub-arrays and how to use the Multi-MPPT feature.
-
Hi! The Field type "unlimited sheds" is a great option for a first parameterization to consider mutual, inter-row shadings without defining a 3D scene. You here get the a calculation of your groud cover ratio: A(coll)/A(ground), thus the area of the panels compared to the ground area required. To do the calculation correctly you should verify the size of your panels and make sure the Coll. band width correspond (considering also if you have multiple panels in height, if they are vertical or horizontal etc.) You can here also define the Electrical effect of the mutual shading. The area in the system window only consider the area of the chosen panels, not the layout of the system. To get an approximation of the actual needed area you could use the Ground coverage ratio and the area of the panels in your system. For a precise sizing you should choose the field type Fixed Tilted Plane and create a Near shading scene with the exact dimensions of your roof and place tables in this dedicated available zone. Kind regards
-
Indeed, only the area of the modules. Kind regards
-
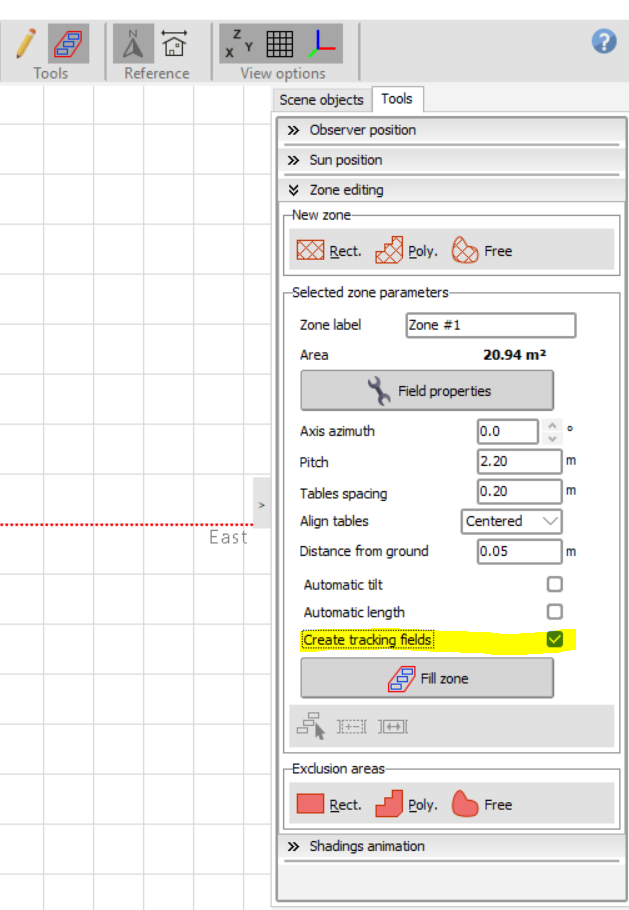
Yes, make sure you tick the option "Create tracking fields" before filling the zone.
-
How to simulate PV+BESS which can store 75% annual production of PV?
Linda Thoren replied to Jarek's topic in How-to
Hello Jarek, Indeed there is no straightforward way to define such a storage strategy system in PVsyst. The final result of the Peak Shaving strategy of course depend on a lot of parameters including the weather conditions on your site, the size of the battery pack, charging/discharging power as well as the grid limitation and discharging strategy. The grid-limitation must be rather restrictive to force the simulation to store the energy in the batteries instead of injecting it to the grid directly. This grid limitation will be the same every hour though so a too strict limitation will risk to hinder the batteries to discharge. It is on the roadmap to improve the battery storage strategies, but this is a very complex task and will not be available in the near future. Kind regards -
Hello, If you are referring to the "Pre-sizing Help" and the "available area (modules)", this consider only the area of the modules (the size of the panels in the .PAN file) and not the spacing of them (mostly relevant if you have a tilted roof with a calculated available areas to put your panels). This is just a Pre-sizing Help that serves a first help to start your dimensioning and indeed not precisely adapted for ground availability. Kind regards
-
Hello, You can generate an hourly output file through the Advanced Simulation. Click Advanced Simulation (below the Run Simulation button), Output File, define Hourly values and choose the relevant Simulation variables. By running a simulation, a csv file will be created and saved in your workspace. Kind regards
-
Hello, In the current version on PVsyst, you can only have one orientation for a bifacial system. As Michele has mentioned above, there are a few regularity requirements that have to be met, you can find the bifacial conditions in this link: https://www.pvsyst.com/help/bifacial-conditions.htm As well as a youtube tutorial on the subject: Note that, as for the Pitch, the tolerance for the Max. tilt axis for the Bifacial 2D model can be modified on the Advanced parameters. Kind regards
-
Hello, You can define multiple sub-arrays and assign different inverters (as well as lengths of strings etc) to each sub-array. You find a list of the sub-arrays to the right in the system window. In the following youtube tutorial about Multi-MPPT and Power Sharing, you see a few examples of how different inverters have been used in one system configuration. Kind regards
-
How to avoid getting consumption/negatives in 8760
Linda Thoren replied to Hillary123's topic in How-to
Hello, If you have defined a transformer that is not disconnected during the night, the negative values could possible come from the Transformer losses. Transformers have a constant iron loss, even if no energy is being produced. To avoid this, you need to enable 'Night Disconnect', in the Ohmic Losses window.