
Linda Thoren
-
Posts
357 -
Joined
-
Last visited
Everything posted by Linda Thoren
-
 I see. Can you please send your load profile (.csv file in correct format) as well as your project as a .zip file to support@pvsyst.com and we can have a closer look at it
 -
Hello, Could it be that the energy demand defined in the CSV file occurs during hours with no production? It seems that the load profile was imported correctly (283 MWh/year), and the energy demand is fully supplied by the grid (energy from grid to user: 283.33 MWh).
-
In PVsyst you have the possibility to import weather data from various weather data providers. If you are using the same weather data, indeed the Global horizontal irradiation will identical.
-
Hello, Since the the power limitation is either in active or reactive power in PVsyst, adjusting the .OND file is indeed necessary to properly account for the inverter’s behavior at pf=0.85. In the output parameters in the .OND file, choose Apparent power and adapt the Nominal AC Power to 140 kVA in the Main parameters window. Make sure you rename the model and the file name to be used only in projects with a pf < 0.89 Regards,
-
Hello, The Sandia model is only an option for panels in the Sandia database. You can choose to filter the Sandia Database among the available panels and there you have an option to change to the Sandia model. In your print screen, you have defined the First Solar Spectral correction. By default PVsyst propose no spectral correction for crystalline modules

-
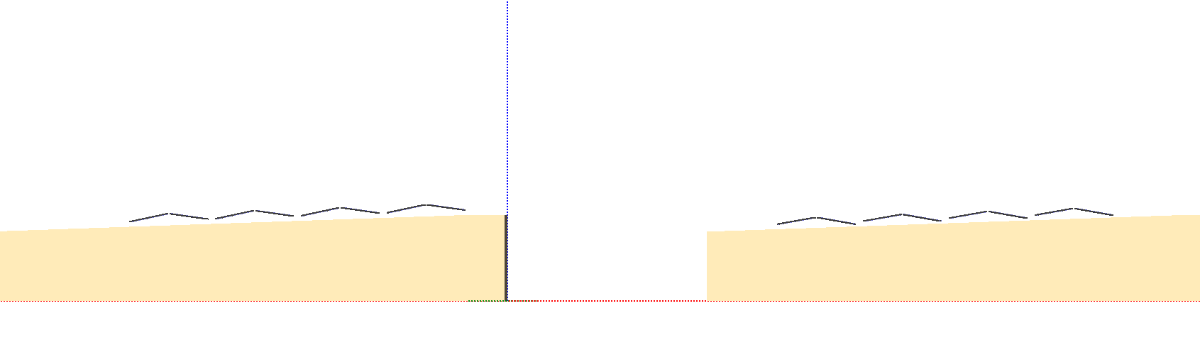
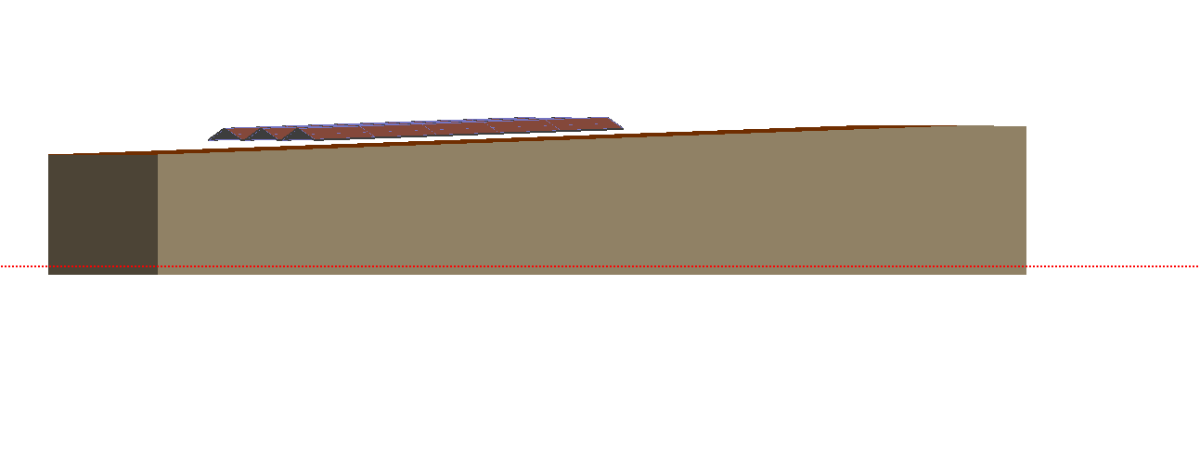
Hello, If the domes are placed along the tilted roof, you can simply add a "baseline slope" of 2° and the domes will follow the roof: In the case the domes would be placed perpendicular to the slope, it is less straight foreword. - By creating an array of domes, right click on the array and "ungroup", then mark all the tables and in the "Scene object", right click and use the "automatic altitude option". This is the alternative to right in the image, where the pair of domes are horizontal, though each pair are following the tilt of the roof. - By creating an array of domes, right click and "convert to domes to fixed tables", then mark all the tables and in the "Scene object", right click and use the "automatic altitude option". The altitude for each table will then precisely follow the tilt of the roof, though the tilt of the panels should be adapted to arrive compensate for the tilted roof. In the "list and management of objects (Ctrl+G), add 2 degrees to the tilt for the lower panels, and reduce the tilt with 2° for the upper panels. This is the alternative to the left in the image. I hope this answers your question
-
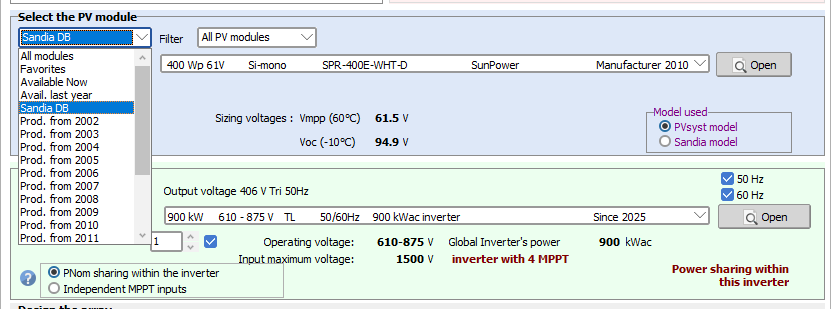
Hi, Indeed you should check the multi-MPPT feature and click on the Power sharing button to activate the power sharing feature (drag the sub-array from the list to the right to the configuration to the left). By defining this correctly, it would be expected to decrease the overload loss over nominal inverter power.
-
Hello, 1/ It is important that you have a multiple between the number of strings and number of MPPT inputs so that PVsyst can equally distribute the strings over the MPPTs, since there is no power sharing within the sub-array, only between the sub-arrays. 2/ I understand that your inverter has 12 MPPTs, some MPPTs with 2 strings and others with 1 strings, some with 18 panels in series and others with 19. You can either define each MPPT individually in separate sub-arrays: - 1st sub-array with 2 strings of 18 panels - 2nd the same - 3rd sub-array 1 string of 18 - etc. Or you can group all the MPPTs with the same configuration in the same sub-array, for instance: - 1st sub-array with 3 MPPTs with 6 strings of 18 - 2nd sub-array with 3 MPPTs and 3 strings of 18 (just to highlight here that it would not be correct to define 6 MPPTs with 9 strings of 18, since it would not be a multiple between the number of MPPTs and number of strings) - 3rd sub-array with 5 MPPTs with 5 strings of 19 - 4th sub-array with 1 MPPT with 2 strings of 19 If you have 11 inverters with the same configuration, you can multiply the number of MPPTs and the numbers of strings in each sub-array with 11 (33 MPPTs and 66 strings in the first sub-array etc.) I hope this clarifies the use of the Power sharing feature. You find more examples in the following youtube tutorial:
-
Hello, Indeed, the first input of the Global horizontal irradiation is different between the two diagrams. Verify that you have the same coordinates and are using the same weather data provider.
-
orientation Pamareters Pvsyt 8
Linda Thoren replied to mohamed abdelkader's topic in Shadings and tracking
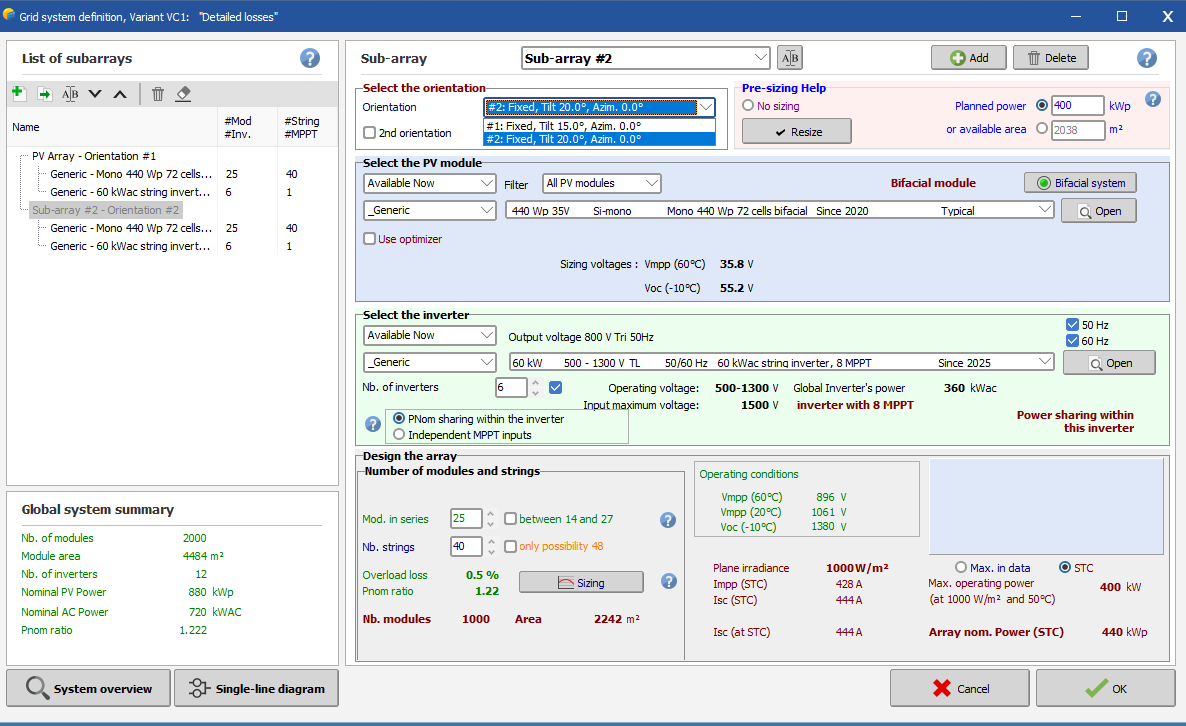
Hi, It seems like you have defined an orientation (Orientatation #2) that has not been defined in the system. In the system window, make sure that all the orientations (shown in the drop down list) has been assigned in a sub-array (list of subarrays to the left)
-
we name "Solar Fraction" the ratio of the user's energy from solar, to the total user's consumption
-
Hello, Indeed, in the Project settings you can define Site-dependent design parameters and the "Lower temperature for Absolute Voltage limit" ensures that an error message is triggered if this limit is exceeded. This value is typically set based on the coldest recorded temperature over the past 10 years to protect system components. Adjusting this value can indeed affect the maximum number of modules allowed in series. However, PVsyst does not currently adjust this setting automatically.
-
Indeed it is normal. With the unlimited trackers field type we assume a perfect backtracking and therefor there will be no mutual shadings.
-
Indeed, you can maximum print 3 decimals in the loss diagram.
-
Hello, You can find all the variables in the Advanced Simulation output file. Some categories in the loss diagram are grouped—for example, Global Horizontal Irradiance, where its individual components are not displayed separately. Additionally, all the intermediate calculation steps are not explicitly represented in the diagram. However, all losses are accounted for, even if not all details are printed. For a grid-connected system, the Performance Ratio (PR) is calculated as E_Grid / (GlobInc * PnomPV). E_Grid printed in the loss diagram is the final result. Best regards
-
The tutorial is from version 7, but the functionality is the same in version 8. For your inverter, you either define "Pnom sharing withing the inverter" or "independent MPPT inputs". Indeed, in every sub-array you have to define how many strings you have in parallel. You can not define strings of different lengths in 1 MPPT.
-
Hello Lukas, It is indeed possible to create a sub-array for each MPPT and in general you are not forced to choose one inverter per orientation. You can even mix two orientations in one MPPT as long as you have at least one string in each orientation Assuming you are importing your 3D scene from another software, creating full tables instead of individual panels is normally done in the external tool. Instead of defining each individual panel, define the complete area of the table (including the spacing of between the panels) and PVsyst will fill the tables with the amount of panels that can fit in that specified area. This would create 14 tables in your scene.
-
Hello, The Unlimited Sheds field type in the orientations management cannot be combined with the 3D scene, since you already will define layout parameters such as the number of tables, pitch etc. You can indeed define a fix tilt plane and instead define the layout in the 3D scene. The model that will calculate the bifacial gain is 2-dimensional calculation - similar to the unlimited sheds orientation and the layout parameters needed can be defined in the 3D scene or in the unlimited sheds in the orientation window.
-
Hello, Indeed, your understanding seems to be correct. For Amorphous panels, you will find the parameters regarding the spectral correction in the .PAN file (Model parameters Spectral correction and the tick-box is activated). If you use a panel in the Sandia database (you can find relevant panel in the databases and in the "Availability" filter choose Sandia DB) you will have a choice to apply the Sandia model. PVsyst provides the option to apply the spectral correction model, developed by First Solar. While this model is particularly relevant for First Solar modules, users may choose to apply it to other technologies at their discretion.
-
Hello Mariyam, The the percentage of grid consumption in the loss diagram shows how big portion of the time you are consuming from the grid. In the bottom of the graph it is indicated how much energy is consumed from the grid. For example, if the electricity consumption is far larger than the PV production, you will have grid consumption 100% of the time, and still have self-consumption to user from solar.
-
Hello, The two print screens in my post comes from the same report (version 7). A simulation in version 8 would normally look the same. Kind regards
-
Orientation error for bifacial panels on carport
Linda Thoren replied to AHMED's topic in Simulations
Hi, Indeed if you have no other shadings this solution would give a rather representative scenario of what you wish to simulate. -
Hello, Sorry your goal is not really clear to me. In the headline you indicate that you have 22 strings with 34 panels in series and 1 string with 33 panels in series (a total of 781 panels). If your inverter has 6 MPPTs you could for instance create 3 sub-arrays with the following configuration: sub array 1: 4 MPPTs 16 strings of 34 (4 strings per MPPT) sub array 2: 1 MPPT 6 strings of 34 (6 strings per MPPT) sub array 3: 1 MPPT 1 string of 33 It is important that the number of strings is a multiple of the number of MPPTs The following youtube tutorial further explains the multiple MPPT feature and the power sharing:
-
This is further explained in the following help page: https://www.pvsyst.com/help/project-design/bifacial-systems/index.html#irradiance-on-the-rear-side-view-factor
-
Energy Generation Difference between Report and Aging Table
Linda Thoren replied to Solaranger's topic in Problems / Bugs
Hello, Is your simulation for year 1? In that case it seems to match well with just some rounding differences of 0.01%