
Linda Thoren
-
Posts
252 -
Joined
-
Last visited
-
The number of rows is only used for the bifacial calculation for the backside irradiance, where the simplified 2D cross section view is needed. For the front side, the electrical shading is fully simulated as defined in the 3D scene.
-
The number of rows refers to the number of rows in the 2D cross-sectional representation of the system, assuming "unlimited long tables", and is relevant for the calculation of the effect of the first and last row of the array. In your case it would rather correspond to 38 rows, imagining the view in 2D. Number of sheds (rows) and accuracy - PVsyst documentation
-
Hello, In general it is fully possible to continue a project made in 7.4 in version 8.0.
-
Indeed, the hours where the wind exceeds the given threshold, the simulation will be done with the trackers in the defined wind stow position. You will not directly see any losses in the diagram though indeed it will result in a less optimized Global Incidence Irradiation. To properly evaluate the impact from the wind stow, you would have to run one simulation without activating this functionality and compare the two simulations.
-

Does Far Shading Impact Near Shading Losses?
Linda Thoren replied to Chae Han Lee's topic in Shadings and tracking
Hello, In general, far shading affects the entire PV field uniformly — at any given moment, the sun is or is not visible on the field. As a result, it can potentially reduce the impact of near shading, since far shading may occur during times when near shading would otherwise be present, typically when the sun is low on the horizon. -
Is there a way to adding load profile for each month?
Linda Thoren replied to Suphanat's topic in Simulations
With the option "Load values from a CSV hourly file" you have full liberty to define the load profile exactly how you wish. -
Is there a way to adding load profile for each month?
Linda Thoren replied to Suphanat's topic in Simulations
Hello, In the version 8.0.13 we corrected a bug and a daily hourly profile is now normalized and saved properly. You also have the possibility to import a .csv file with hourly values for the full year. The different ways of defining a self-consumption profile are further described in this youtube tutorial: -
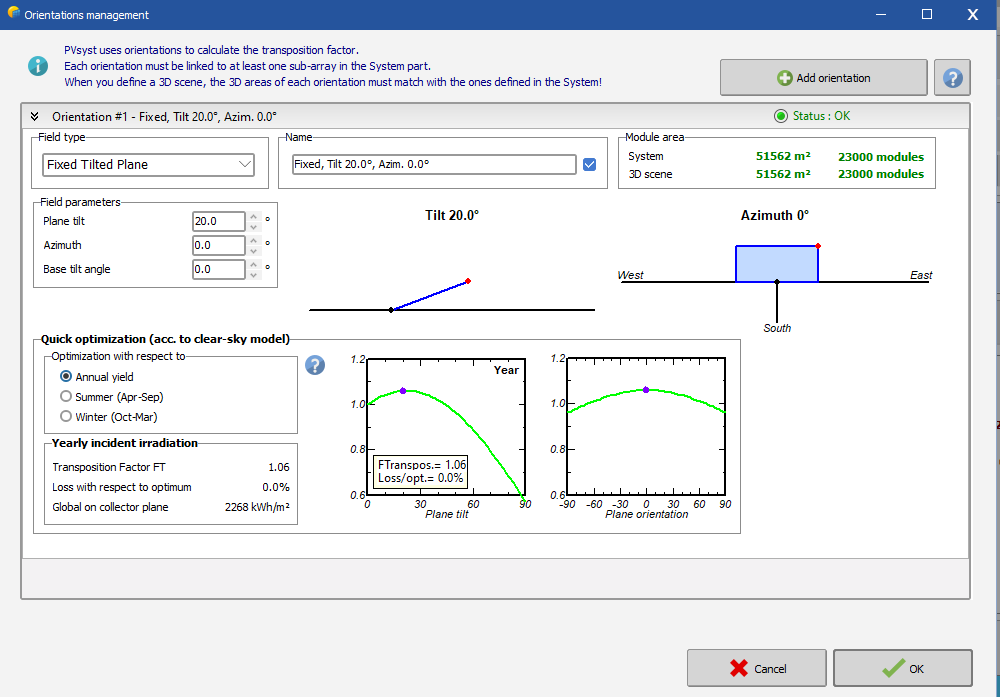
The global irradiance in the plane of the array (GlobInc)depends on the tilt and azimuth of your system. In general, one would choose an orientation of the panels in a way that maximizes this irradiance, which is why the GlobInc is usually higher than the irradiance on a horizontal plane. When defining a fix tilted plane, you find a "quick optimization tool", illustrating in an order of magnitude what you could expect to gain (or lose) compared to a horizontal configuration at your site.

-
Hello, By importing irradiance data in the plane, PVsyst applies a reverse transposition to determine the global and diffuse horizontal irradiation required for the simulation. For the simulation, PVsyst will utilize the Global on horizontal plane as starting point. This is necessary as the optical treatment (shadings, IAM, etc) requires the beam, diffuse and albedo components. The reverse transposition and re-transposition can indeed cause some discrepancies with the original data. Verify that you in the Simulation use the Hay transposition. You define this is the project settings. You can read more about the transposition model in the following help pages: Transposition model - PVsyst documentation The Hay transposition model - PVsyst documentation
-
Hello, I suggest that you run a simulation with the bifacial parameters and export an hourly output file with all the relevant parameters, such as overload losses etc. This can not be done for individual strings but for the full system. Running several iterations should give you a good estimate of the losses.
-
Hello, The most straightforward way to evaluate bifacial gain is to run two simulations: one with bifacial parameters activated and one without. While the current itself does not differ between the front and rear sides, the rear side does contribute to the overall energy production. In PVsyst, the results are presented for the entire system and not broken down per string.
-
Hello, PVsyst is calculating the sun position based on the exact year accounting for leap years, when specific years are simulated. Thus, if you import a specific year that is a leap year though the 29th is missing in the data set, it will be considered as missing data and values will be 0 (similar to as if any other date of the year was missing). So values for February 29th will be zero (e.g., no irradiance), but the date will still be included in the simulation. March 1st will correctly follow as the next day.
-
Hello, You can read about how to adapt you PVsyst simulation to a floating system in the following post: https://forum.pvsyst.com/topic/1346-how-to-adapt-pvsyst-to-floating-pv-systems/
-
Hello Tyler, Essentially, the Global incident in the collector plane will be calculated for each sub-array for the assigned orientation (or possibly a mixed orientation). The GlobInc as the total result is an weighted average based on the Pnom PV
-
Hello, You can use the lasso selection (Ctrl+Shift+L) to mark all the tables that belongs to the concerned orientation and in the "List and management if objects" window (Ctrl+G) you can change the orientation of all the marked tables.