
Linda Thoren
-
Posts
354 -
Joined
-
Last visited
Everything posted by Linda Thoren
-

Bifacial Modeling for the Carport System
Linda Thoren replied to PranavK's topic in Shadings and tracking
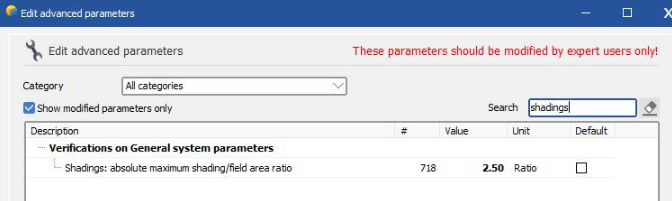
Indeed all tables need to have the same width and you need to have pitch (thus more than 1 row) to calculate the bifacial gain. A possible workaround for the issue of only having 1 row, is to duplicate the scene further away so that PVsyst can detect a pitch. Verify that the tables are well aligned so that indeed PVsyst detects the pitch in bifacial window. Note that the amount of tables in the 3D scene will be double what you have defined in the system and this will create a warning. You can increase this limit in the advanced parameters. In the first PVsyst welcome window, click “Settings” and “Edit advanced Parameters” and find the parameter that triggers the error message – “Shadings: absolute maximum shading/field area ratio”. This will allow you to run the simulation
-
Bifacial Modeling for the Carport System
Linda Thoren replied to PranavK's topic in Shadings and tracking
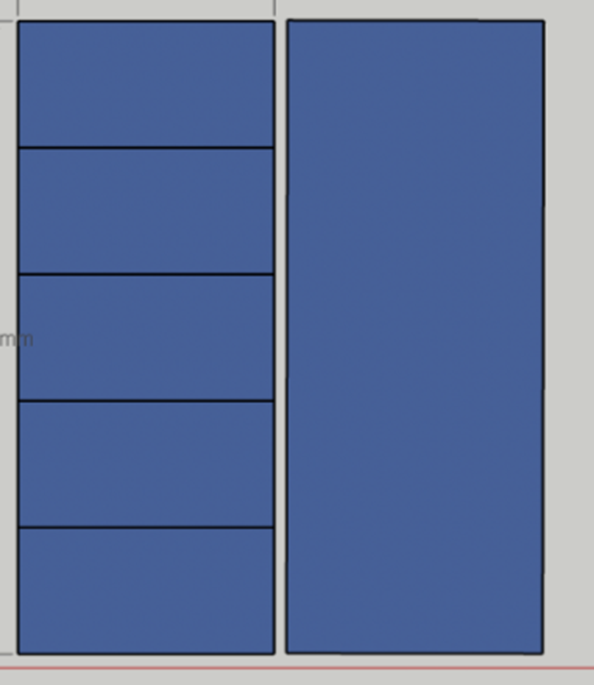
Hi, The issue most likely comes from the definition in the 3D scene, if each panel is defined individually rather than as a table. As the red message in this window indicates (though not very clear so this can indeed be confusing), you can play with the shed's parameters as you like for parametric analysis, though the simulation will be done with the defined values in the orientations window and the table size in the 3D scene, only the pitch and number of rows can be overwritten. To solve this, you need to define tables rather than individual modules. If you are importing the tables from another 3D software, make sure you indeed draw full tables (as the alternative to the right), and PVsyst then normally will fill the total area with individual modules and the area will be considered a table.
-
Broken reference links on the "FirstSolar Spectral Correction" help page
Linda Thoren replied to kjs55's topic in Suggestions
Hello, Thank you for highlighting this. -
Wind stow loss, Subhourly loss and Terrain loss.
Linda Thoren replied to balaji.pc's topic in How-to
Hello, The losses due to the wind stow position of the trackers do not directly appear in the loss diagram. The only way to evaluate these losses would be to run a simulation without wind stow and evaluate the difference between the simulation. If you are using sub-hourly data and the sub-hourly clipping correction model, you find the additional clipping correction printed in the loss diagram. Im not sure what you mean by terrain loss? With the 3D scene, you can evaluate the mutual shadings that might appear due to the terrain, as well as shadings actually caused by the terrain, these will be shading losses. Shadings from shading objects or the terrain will be grouped together. To evaluate them separately, you would need to run several simulations with and without the different shading objects. You can also import a horizon profile to evaluate far shadings. -
Hello, No it is unfortunately not possible to use the plane of the array measurements directly. You can import the horizontal values directly and calculate the POA from the horizontal, rather then doing a reverse transposition from the POA and transpose it back to a POA.
-
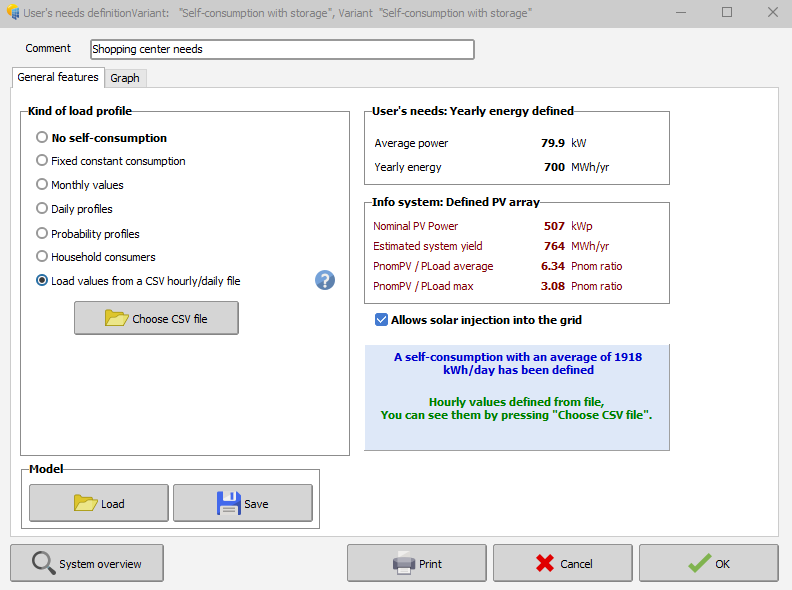
Hello, With a grid connected system with self-consumption, you can un-tick the option "Allow solar injection into the grid"
-
Hello, The P50-P90 statistical estimations are based on yearly values and thus it is not possible to generate monthly values through PVsyst. You can read more about the P50-P90 evaluation in the following help page: https://www.pvsyst.com/help/project-design/p50-p90-evaluations.html?
-
Hello, Yes with different weather data sources the production will vary, since the irradiance data will vary. You find more information about the weather data providers and a comparison in the following PVsyst help page: https://www.pvsyst.com/help/meteo-database/import-meteo-data/data-source-comparison.html
-
Albedo shading component calculation
Linda Thoren replied to ClaireWest's topic in Shadings and tracking
The albedo shading loss will be the same. But with all the parameters set for a bifacial system the variable "ground reflection on front side" is added for the inter-row ground reflection, as described in the help page. For a monofacial system, the irradiance that falls between the rows is not calculated and the contribution of the ground reflection on front side is in general negligible for systems with a low tilt angle. To evaluate this gain, at the moment you need to set the bifacial parameters as described above. -
Hi, The bifacial model presently available in PVsyst is based on a simplified 2-dimensional representation, with similar assumptions as the "unlimited sheds" or “unlimited Trackers” PVsyst simplified calculation. This approximate calculation may be extended to a 3D scene, provided that this 3D scene is sufficiently well represented by the "Unlimited sheds or trackers". Thus, simply use the option "Use unlimited sheds 2D-model" in your second print screen. You find a tutorial about the bifacial model conditions for the 3D scene below:
-
Albedo shading component calculation
Linda Thoren replied to ClaireWest's topic in Shadings and tracking
Hi, Indeed, today the ground reflection between rows is only considered for bifacial systems. In general, this contribution is very low with sheds and trackers systems, but becomes more important with high tilts and large pitch and crucial with vertical East-West bifacial systems. The calculation of the ground reflection of the front side involves an accurate definition of the ground, its albedo, the geometry, and the full calculation of the ground points view factors. So, the ground reflection of the front side is considered for bifacial systems since all of the needed parameters are already defined, but neglected for monofacial systems. The only way to run a simulation including the ground reflection for the front side for a monofacial system today, would be to alter the PAN file (activating the bifaciality and put the bifaciality factor to 0) and run a simulation with the bifacial parameters, though everything except the ground reflection on front side will be 0 given the bifaciality factor of 0. In the following help page, the reflection on the ground is further discussed: https://www.pvsyst.com/help/project-design/bifacial-systems/bifacial-systems-results.html -
Hello, The far albedo in the project settings, will be considered in all projects and correspond to the albedo of the surrounding of the project. The albedo in the bifacial system window is indeed only set for bifacial systems and correspond the the albedo of the ground just underneath the modules. This is not necessarily the same as the far albedo of the surrounding. Kind regards
-
Hello, You should define the number of lines to be skipped, before the line where the (sub)hourly data starts. The general procedure for importing a custom weather data file is described in the following link: https://www.pvsyst.com/help/meteo-database/import-meteo-data/custom-meteo-files/conversion-protocol.html Note that you in this tool are supposed to import a a .csv file with (sub)hourly data, thus one line per time step with irradiance and temperature data and convert the .csv file to a .MET file that you can use in PVsyst to run your simulation. It seems like your source file is already a .MET file with Meteonorm 8.2 (hourly) data. You cannot re-convert an hourly .MET file to include the clipping correction.
-
Albedo shading component calculation
Linda Thoren replied to ClaireWest's topic in Shadings and tracking
Hi, The shading calculation is indeed explained in the second link you have attached. In general, the higher the tilt, the higher the albedo contribution. Most of the albedo contribution will directly be lost (you see that the albedo loss is indeed following the albedo contribution) since we assume that only the first row is "seeing" the albedo, so that the albedo shading factor will be (n-1)/n (n = number of sheds). The albedo loss is a significant contribution to the global shading losses. -
Consideration of .PAN Parameters in Mixed Module Simulations
Linda Thoren replied to Elise's topic in Simulations
The low light performance and temperature coefficient is defined in the individual .PAN files. The thermal parameters are then set for the full system to evaluate the temperature and the thermal losses in each sub-array. Thus if you are mixing panels in the same inverter (though in different sub-arrays), the different temperature coefficient of the different modules are well taken into account. In the loss diagram you will see the results for the full system. You find more information on the subject in the following PVsyst help pages: https://www.pvsyst.com/help/physical-models-used/pv-module-standard-one-diode-model/index.html?h=pv+module+standard+one+diode+model https://www.pvsyst.com/help/project-design/array-and-system-losses/array-thermal-losses/index.html -
Hello, As you indicate, in PVsyst you will first find the irradiance loss (linear shadings) and then the additional electrical shadings. Note that, in the loss diagram, each loss is defined as percentage of the previous energy quantity. Therefore the percent values are not additive.
-
Multi-Year Analysis of Inverter Clipping Losses & Module Degradation
Linda Thoren replied to ASZulu's topic in Simulations
Hello, With lower PV production due to ageing modules, it seems reasonable to see less overload losses. -
Multi-Year Analysis of Inverter Clipping Losses & Module Degradation
Linda Thoren replied to ASZulu's topic in Simulations
You define the year in the batch parameter csv file. As in the video tutorial un minute 7. Now indeed it seems like you are not varying any of the parameters and simulate the same project 25 times. -
Multi-Year Analysis of Inverter Clipping Losses & Module Degradation
Linda Thoren replied to ASZulu's topic in Simulations
Hi, It seams like you have set all the simulations for year 1. In the 15th column "Simulation Year" -
Multi-Year Analysis of Inverter Clipping Losses & Module Degradation
Linda Thoren replied to ASZulu's topic in Simulations
Hi, You find information of how to define the ageing in the following tutorial: The Batch mode is described in the following tutorial: -
Hello, When using the independent MPPT inputs feature, it is very important to have a multiple between the number of strings and MPPTs in each sub-array, or PVsyst can not equally distribute the strings over the MPPTs and you risk incorrect evaluation of the inverter losses over nominal inverter power. The MPPT and Power sharing feature is fully described in the following youtube tutorial:
-
Fraction for electrical effect percentage
Linda Thoren replied to AdelB's topic in Shadings and tracking
Hello, This depends on your system layout. If the majority of the shadings are regular mutual shadings, you can leave the fraction for electrical effect to 100%. If you have several shading objects in the scene causing irregular shadings, you might need to adapt this value. This is furthered discussed in our help: https://www.pvsyst.com/help/project-design/shadings/electrical-shadings-module-strings/index.html#module-layout-reference Kind regards -
The last generated Monte Carlo values is for year 30. You can still simulate a degradation beyond this, though after 30 it is assumed to be a linear trend.
-
In the coming PVsyst version 8.1, several input parameters can be defined as hourly values via a .csv file. This will allow snow coverage (in %) to be specified on an hourly basis if desired. However, we are not currently implementing more advanced snow-coverage models, though this is on our roadmap for a future version.
-
Hello, If you for instance have self-consumption or storage, System production production is not necessarily the same as E_grid. What version of PVsyst are you using? There may be differences due to rounding of results when saving files. However, these differences are necessarily negligible. If they are not, there may indeed be a problem and feel free to export your project as a zip file and send us an email to support@pvsyst.com