-
Posts
329 -
Joined
-
Last visited
Everything posted by Linda Thoren
-

Report shows spectral correction applied even when it isn't
Linda Thoren replied to LauraH's topic in Problems / Bugs
it is the coefficient set for that specific PV module technology. You can find additional information in the following help: https://www.pvsyst.com/help/physical-models-used/pv-module-standard-one-diode-model/firstsolar-spectral-correction.html#spectral-correction-in-pvsyst -

Auxiliary Energy Losses – How is the calculation performed?
Linda Thoren replied to Maynara Torres's topic in Simulations
Hello, In the loss diagram, each loss is defined as percentage of the previous energy quantity. In general, if you have defined a continuous auxiliary loss and export an hourly output file, you will see that this value will remain constant, though the percentage it will represent will of course vary depending on the production (if you for instance look at the loss diagram for the different months). You can read more about the loss diagram and the auxiliary losses in the following help page: https://www.pvsyst.com/help/project-design/results/loss-diagram.html https://www.pvsyst.com/help/project-design/array-and-system-losses/auxiliaries-consumption.html Please let me know if this answers your question. Kind regards, -
Hello, When defining monthly values, it is assumed that the consumption that month is identical throughout the month. Thus from kWh/month to an average power is simply a calculation of how many hours there are per month. Note that the average power need for monthly values are reflecting day and night consumption, thus it does not directly make a very good basis for the needed installed AC capacity, but at least a fist order of magnitude.
-
Dear Shivya and Ben, This is difficult question and we do not have a direct answer. As a first approximation, the structure shading could be estimated as the ratio of the area covered by structures to the photovoltaic area. In this approximation, the effect of structures is therefore their projection on the rear plane. Therefore, it neglects the fact that light may arrive on the rear side from multiple directions, akin to diffuse light. This approximation is hence likely an underestimate of the shading loss, in full generality. Indeed, even if structural elements are not directly in front of the rear side of modules, they may cause significant shading. A better approximation is beyond the present possibilities of PVsyst. Then there is the the variable for the mismatch loss factor, caused by a heterogenous irradiance distribution on the rear side. Any source of heterogeneous irradiance will cause electrical mismatch effects. Such is the case of shading cast by structural elements (but also differences in location relative to the environment and the ground). At present, PVsyst has no easy way to make an accurate estimation for these effects. Based on comparisons with measurement data, we have determined a default value (10%) for a general case. With beams covering the module width directly in front of the rear side of modules, the mismatch losses may increase drastically. In such a case, one can roughly estimate the mismatch effect as follows: as the current in a string is the current in the worst cell, if the structure covers x% of one cell, the shading effect will be x% for the concerned string. For example, the loss may be reduced by a factor of 2 if the structure covers half a cell (or two half cells).
-
No sorry it is not possible to divide your system in the batch simulation.
-
Indeed, the final simulation result always corresponds to the full system. To view the results of the individual inverters, you would need to simulate each one in a separate variant. Depending on how AC losses are defined, the two individual inverters should produce approximately the same as when they are simulated together, although some post-inverter losses may differ due to the lower total system power. If your full system has two inverter before the injection point, this is how you should simulate the system, rather than adding variants together. Separating the inverters into separate variants is a work around to evaluate the individual inverter performance.
-
Hello, Yes if you are defining the MPPTs you have an interest to use the Auto-equal Pnom option, to avoid overload losses in some sub-arrays while other underperform. If you have multiple orientations, you can use the multi-orientation daily sharing option. Kind regards,
-
Hello, Indeed, this is not the expected behavior. Since the grid limitation is applied at the Pnom, we have observed that in certain situations—when the MPPTs operate under very different conditions—this may lead to results that do not perform as intended. To analyze your project in more detail, could you please export it as a .zip file and send it to our support team at support@pvsyst.com? We apologize for the inconvenience.
-

Sudden Load Profile Spikes After Importing File
Linda Thoren replied to Ady's topic in Problems / Bugs
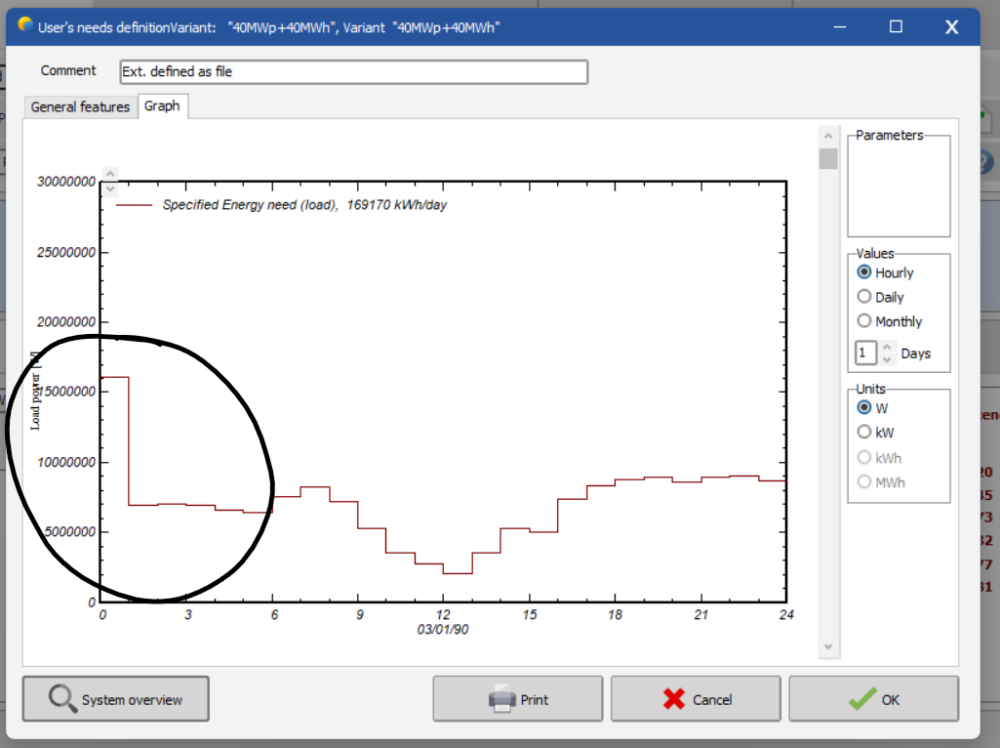
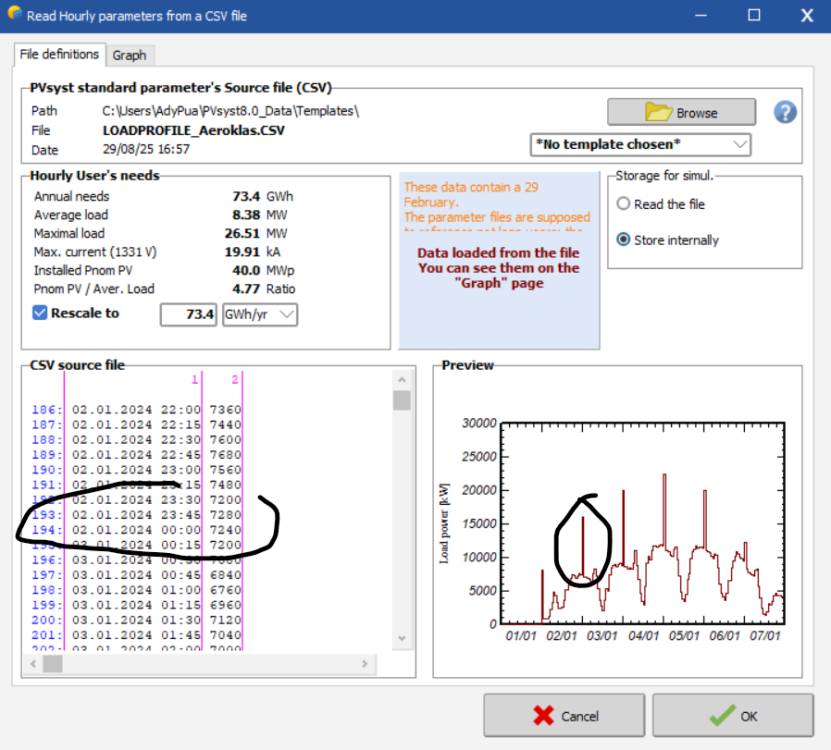
I notice that you have a warning message indicating that your file contains data for the 29th of February. Are you using weather data for this specific year (a leap year) or a generic year ? Try to take out the 29th of February from the dataset. -
Hello, The differences in the databases will be in the global horizontal irradiance, and thus only indirectly on the global incident in collector plane. To calculate the Global incident in the collector plane, the same transposition method can be used for any source of weather data. The difference in direct and diffuse irradiance for instance can have a large impact in the incident in the collector plane. You can read mora about the transposition model in the following help page: https://www.pvsyst.com/help/physical-models-used/irradiation-models/transposition-model.html Indeed, there can be large differences in the weather data and it is difficult to evaluate which one is the most accurate at a specific site. We have done some comparisons that you find in the following help page: https://www.pvsyst.com/help/meteo-database/import-meteo-data/data-source-comparison.html?h=weather+data
-
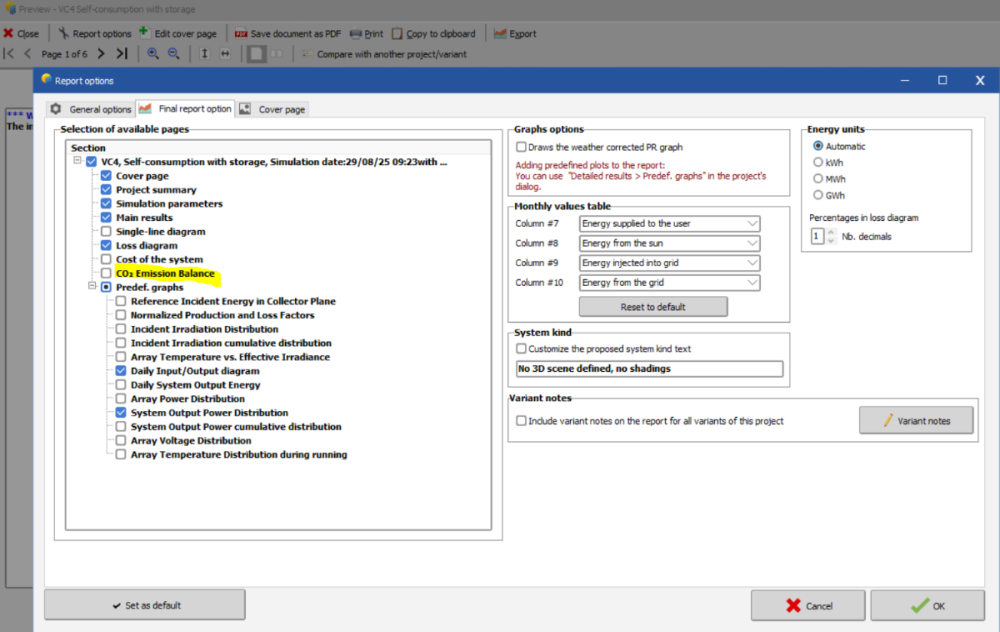
You find the carbon balance tool in the end of the economic evaluation window and you can choose to print the results in the report. In the report option, make sure the Co2 Emission Balance is enabled for the results to appear in the report.
-

Sudden Load Profile Spikes After Importing File
Linda Thoren replied to Ady's topic in Problems / Bugs
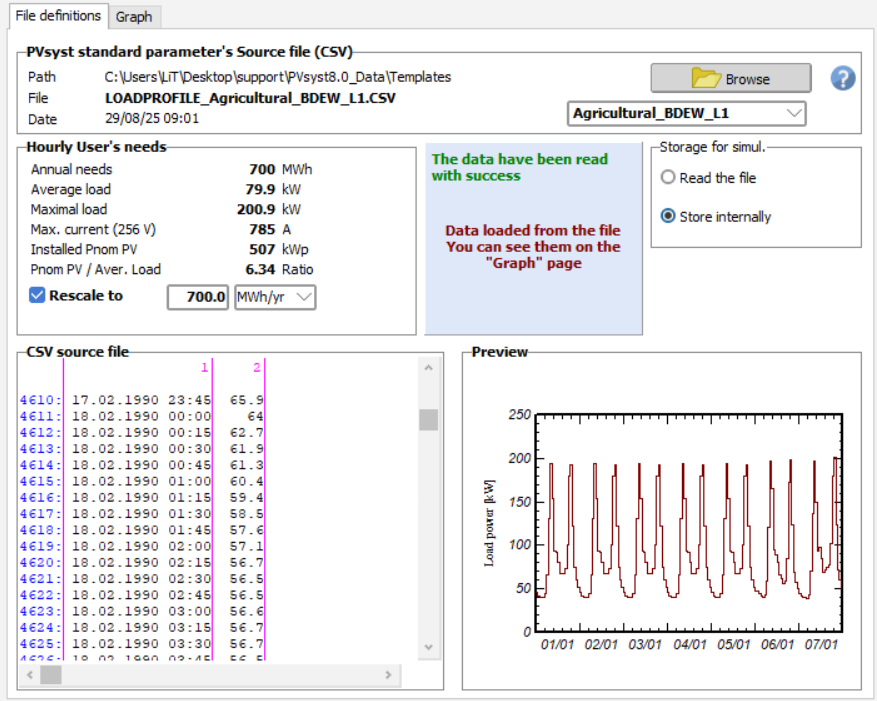
Hello, Does the peaks only appears in the preview graphics or is there in issue with the actual values in the input? Does the Annual need and the CSV source file to the left of the graphic correspond to the original file? You can possibly try to run a simulation and export the results to verify that the simulation is made with the correct values -
Hello, Indeed there can be big discrepancies between databases. It is very difficult to estimate which one is the best suited for a given project or location, and what the probable error is. The following Help page provides comparisons of several databases across different sites: https://www.pvsyst.com/help/meteo-database/import-meteo-data/data-source-comparison.html?h=meteo+comparison#comparison-between-several-data-sources-for-different-continents
-
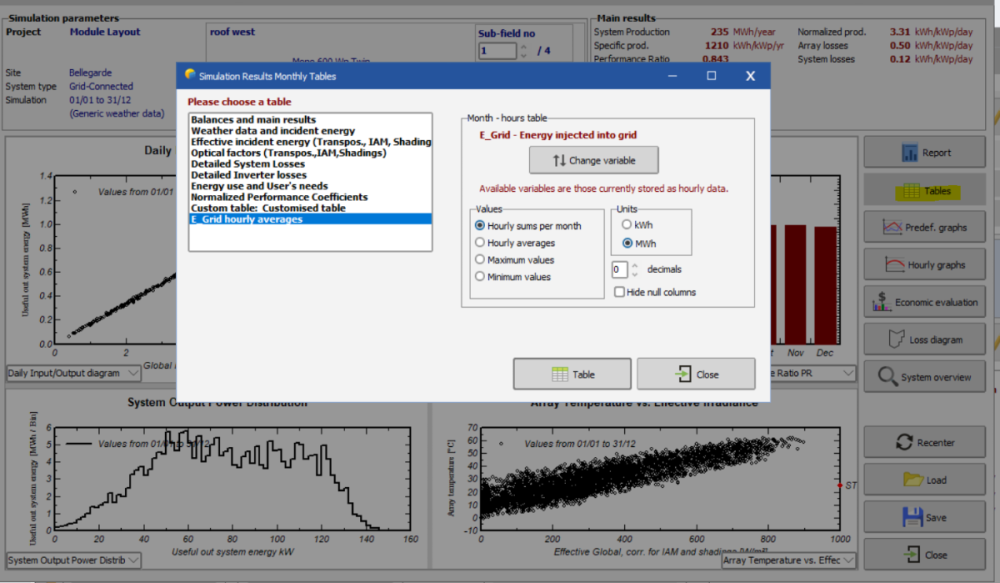
Hello, After running a simulation you have access to the "Detailed Results". In the "Tables" window, you can generate a table like the one in the beginning of this thread with E_Grid hourly averages
-
Hello and welcome ! The first steps of how to import custom weather data into PVsyst is explained in our Help in the following link: https://www.pvsyst.com/help/meteo-database/import-meteo-data/custom-meteo-files/index.html Kind regards
-

the cable loss of strings of bifacial system
Linda Thoren replied to Chen's topic in Problems / Bugs
Sorry I don't really understand what you want to. The Ohmic losses can be defined in the Detailed losses window -
Bonjour, Dans vos exemples, l’inclinaison du toit est de 30° et 10° respectivement, et les panneaux sont-ils installés directement sur le toit incliné ? Dans ce cas, il n’est pas possible de réaliser une simulation bifaciale, car peu ou pas de lumière atteindra l’arrière des panneaux. Si les panneaux sont installés sur un toit plat avec des tables inclinées à 30° ou 10°, la simulation bifaciale est possible. Dans ce cas, l’espacement entre les rangées devrait être supérieur à 1 m si la table mesure près de 4 m.
-

the cable loss of strings of bifacial system
Linda Thoren replied to Chen's topic in Problems / Bugs
Dear, indeed, the total current should be considered. -
In a project you can create multiple variants (both in version 7 and 8). Since the results will be for the complete system, you have to define your sub-system (for instance one inverter at the time) in separate variants. Thus, in the system window etc., define only 1 inverter and run the simulation. You can then make another variant of your project with the second inverter etc.
-
Hello, At the moment, PVsyst only provides yield and performance results for the complete system as a whole. Viewing results per inverter is not yet available (though it is on our roadmap). If you need results for each inverter separately, the current workaround is to simulate each inverter as its own variant.
-
Hi, The execution of the shading factor calculation may take some time, and has to be evaluated at each simulation hour. For speeding-up the simulation execution, we calculate a table of shading factors for specific sky orientations (every 10° in tilt and 20° in azimuth). Then at each step, the simulation can calculate the exact sun's position, and interpolate in this table ("Fast" shadings calculation"). This table is also used for the elaboration of the shading factor on diffuse and on albedo integrals. You find more details in our help, for instance the treatment of the Beam component: https://www.pvsyst.com/help/project-design/shadings/calculation-and-model/treatment-of-the-beam-component.html and the shading factor table: https://www.pvsyst.com/help/project-design/shadings/calculation-and-model/shading-factor-table.html Kind regards
-
Hi, A near shading loss of 2.8% for the system layout shown in your screenshot is within a reasonable range and you probably have to increase the pitch by a lot to see an effect on the near shading losses. The most accurate diffuse shading calculation will be obtained by using the "All trackers" option, as in your current example. For an exercise to better understand the impact of diffuse losses, you can instead select the "Custom tracker" option and choose a set of tables located at the very edges of the system. This option calculates shading only for the selected tables, then applies the same shading pattern to the rest of the system. If you run the simulation with "Custom tracker" selected for tables that have fewer surrounding obstacles, you should observe a decrease in near shading losses. Note that this method is only for testing and exploring the effect of table placement on diffuse shading—it is not the recommended approach for an accurate production estimate.
-
Hello, If you have no shading object or topography and have activated the backtracking, the near shading losses likely stem from the diffuse shading. The diffuse shading definition for trackers can be found in the Near shading window, Tools, Tracker diffuse shading definition. By for instance increasing the pitch, the diffuse shadings will be reduced.
-
Hi, The idea behind the unlimited sheds field type, is to allow for simulation of the shadings without the complexity of the 3D scene. Thus you are always simulating the mutual shading between the rows in a 2D representation (compared to the 3D scene). One simplification with this 2D representation is that the edge effect is neglected, that the rows are unlimited long. The number of sheds are important to define since the first and last row does not have the same shadings as the rest of the rows. Thus if you have 5 rows, 4 of the rows experience mutual shadings. If you have 500 rows, 499 rows will experience mutual shadings and thus this will impact the simulation results. Note that the unlimited sheds always include mutual shadings. To run a simulation completely without shadings, you should define fixed tilted planes and not define a 3D scene (though you can then define a bifacial project since the pitch and table size are needed for the bifacial calculation). You can read more about the unlimited sheds in the following help page: https://www.pvsyst.com/help/glossary/3d-editor/shed.html?h=unlimited+sheds


