
Linda Thoren
-
Posts
351 -
Joined
-
Last visited
Everything posted by Linda Thoren
-
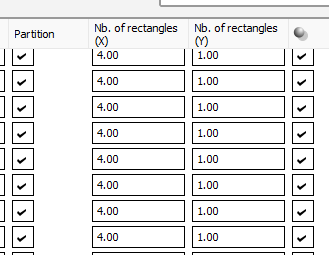
Hello, The two locations to define the partitions are equivalent. If you change one, the other will update. The example below is from the DEMO tracking system Annecy with strings of 20 modules in 2P The partition model is intended to represent the stringing configuration. Therefore, if a table contains one string (e.g., 26 modules), you should define a single rectangle in length (Y-direction), since all modules are electrically connected as one string. If a table contains multiple strings, a separate rectangle should be defined for each string. For example, if a table has 52 modules—corresponding to two strings—you should define two rectangles in length.

-
Yes the number of sheds will have an impact of the performance, considering that the first and the last rows are not accounted for in the same way, since they will not experience the same shading patterns as the tables in the middle of the system. When there are many rows, this difference may be neglected. You can read more about the impact in the following help page: https://www.pvsyst.com/help/project-design/bifacial-systems/bifacial-systems-nbofsheds.html?h=number
-
Hello, In version 8 you can create multiple field types in the orientations window and assign different bifacial parameters to different sub-systems. Thus, even if the tilt and azimuth are identical, create 2 orientations and assign each orientation to a sub-array in the system window, corresponding to the two sub-systems with different pitch in the 3D scene. You find a similar example in the DEMO tracking system Annecy, variant VC5: 2 fields of Trackers with different pitch Kind regards
-

How can I import a quarter-hourly meteo file into PVsyst?
Linda Thoren replied to Nihal Meena's topic in How-to
Hi, Indeed the custom import process can be a bit tricky. In the upcoming release of version 8.1, we will introduce a new assistant to help guide users more easily through the construction of the .MEF file. When importing sub-hourly data, please ensure that the time step is correctly set to 1 minute rather than the default 60 minutes. The warning message you received indicates that the imported irradiance values are very low compared to the site’s clear-sky model. Is the site correctly defined? If you are importing measured data, it may also be worth checking whether the solarimeter requires calibration or whether the units have been properly specified. Feel free to send us your site and CSV file at support@pvsyst.com so we can take a closer look. Kind regards, -
Hello, In the current version you cannot do these manipulations directly in the single line diagram. In the following youtube tutorial you find more information about the single line diagram and the DC and AC cables : The losses in the DC and AC cables can be defined in the detailed losses window as discussed in the following forum posts:
-
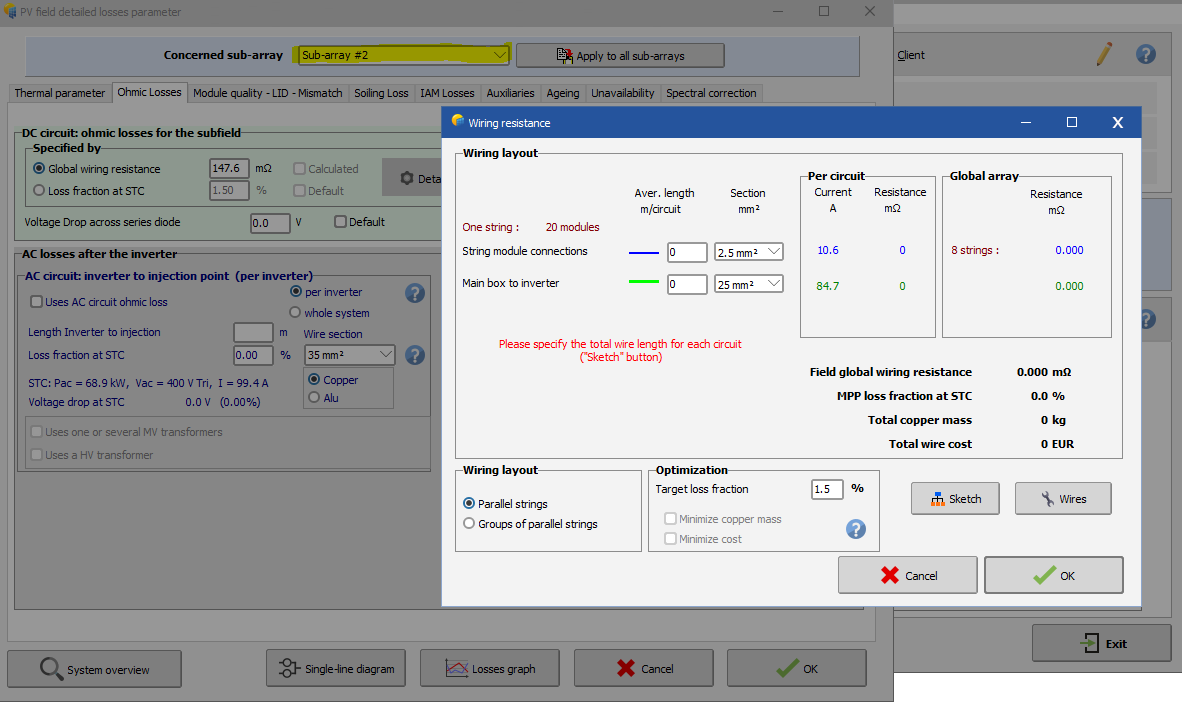
If you have multiple sub-arrays, you can define individual parameters for each sub-array by using the drop down list in the top of the window
-
For certain scenarios it is not yet implemented, such as for multi orientation daily sharing. In the case in your print screen it is probably because you do not have a multiple between the number of strings and MPPTs in the second sub-array. You should have an orange warning in that sub-array indicating this. You should here create an additional sub-array for the strings of 19 modules, one sub-array with 2 strings and 1 MPPT and a second with 1 string and 1 MPPT. This is further explained in the following youtube video:
-
Hello, This can be done in the detailed losses window, Ohmic losses tab.
-
Import GPI data from real values to PVSYST
Linda Thoren replied to Sergio Jimenez's topic in Meteo data
Hello, You can import Measured global on plane (GlPMeas) via the "custom file" tool. You then need to define the Orientation definition and here you can define a tracker. PVsyst will reverse engineer (we use the term reverse-transpose) the GHI and DHI. In the end the discrepancy between the original value and the one in the simulation will differ for a given hour of less than a percent. Over the year the difference should be negligible. You should use the Hay transposition for more robust results with the retro-transposition. This is further explained in the following PVsyst help: https://www.pvsyst.com/help/glossary/solar-geometry/plane-orientation.html -
Unfortunately, it’s not possible to import a PVsyst project created in version 8.0.4 into version 7.4.8. PVsyst files are only compatible from lower to higher versions, not the other way around. To open the project, you would need to use PVsyst version 8
-
Hello, In the current version, PVsyst simulation is hourly based. Thus any sub-hourly phenomenon has to be averaged. Sub-hourly simulation should be available in PVsyst 8.1, but the release date is not yet defined (Normally in the beginning of 2026). Nonetheless, we included a sub-hourly clipping correction in PVsyst 8.0, allowing the simulation to consider sub-hourly irradiance fluctuation for clipping. You can refer to the dedicated section in our help page for more information. The last option is to use the so-called pseudo-subhourly simulation. The idea is to run n hourly simulations (in your case n = 60min/30min -> 2 ) then recombine the results. You can find a PDF tutorial about the whole process in our website: Pseudo sub-hourly Simulation Kind regards
-
Hello, Indeed the PVsyst simulation is hourly based, so any sub-hourly phenomenon has to be averaged. This includes the weather data or self-consumption. The main reason for this limitation is that we currently consider that Perez’s transposition model is not well calibrated for sub-hourly data (EUPVSEC 2023). Sub-hourly simulation should be available in PVSyst 8.1, but the release date is not yet defined (it will be after 2025). Nonetheless, we included a sub-hourly clipping correction in PVsyst 8.0, allowing the simulation to consider sub-hourly irradiance fluctuation for clipping (EUPVSEC 2024) You can refer to the dedicated section in our help page for more information. The last option is to use the so-called pseudo-subhourly simulation. The idea is to run n hourly simulations (in your case n = 60min/15min -> 4 ) then recombine the results. You can find a PDF tutorial about the whole process in our website: pseudo sub-hourly simulation This process can even be automated if you have a PVsyst CLI licence. You can find an application of pseudo-subhourly simulation using PVsyst CLI in python in the help Please note that pseudo sub-hourly simulation cannot be used with energy storage systems. Best regards,
-
Inquiry on Simulating PV Façade Installations in PVsyst
Linda Thoren replied to Sara's topic in How-to
Hello, The available area in the Pre-sizing help in the System window, serves as a guide for a first order of magnitude of how many panels you can fit on a dedicated surface. This tool take only the size of the panels into consideration (not the spacing between the panels or a pitch). If no 3D scene is defined, no configuration other than what is defined in the system and orientation window is considered (no shadings). Defining a 3D scene with the surrounding shading elements, include electrical shading definition etc. will more accurately simulate the system. You find a tutorial for the 3D tool in the following link: Another potential important parameter for a vertical system would be the reflection on the ground. For a monofacial system, this is discussed in the following forum page: -
A Problem with Big Power Plant Designs in Nb. rectangles in width (X)
Linda Thoren replied to Tohid's topic in Simulations
Hi, Indeed the maximum number of rectangles is limited to 100. However, in most cases—even for large-scale projects—each table typically contains only a few strings, so this limitation normally is not issue. For example, if each table includes four twin half-cell panels arranged in portrait orientation, and each row of panels in the table corresponds to a single string, then the table would require eight rectangles in width (x-direction). Could you please clarify how the system layout is defined in your example? You can find more details about the partition model in the following help page https://www.pvsyst.com/help/project-design/shadings/electrical-shadings-module-strings/index.html?h=partition -
Power sharing between MPPTs and within inverter
Linda Thoren replied to ShivamPandey's topic in How-to
Hello, If all the strings have the same length you can indeed use the Power sharing within the inverter. The two options should give the same result. -
Hi, Changing these values in the project settings will not affect the simulation results — it will only have an impact in the triggering of the error message. The error message is designed to protect the inverter from potential damage when the absolute maximum input voltage is exceeded. In this situation, there is a real risk of damaging the inverter.
-
Hello, You set the Lower temperature for Absolut Voltage limit in the Project Settings, Design conditions window. Kind regards
-
The P50-P90 is fully described in the following youtube tutorial:
-
Evaluation of the Impact of Environmental Factors on PV Performance
Linda Thoren replied to Nathan237's topic in Simulations
Hello, In the following youtube tutorial you find how to define the thermal parameters, soiling losses etc. Kind regards, -
Hello, Indeed, since successive losses will affect the active power, the power factor at the injection point may differ slightly from what you entered in PVsyst. Kind regards
-
All the most important losses are illustrated in the loss diagram that is generated after running the simulation. Here you can clearly see what kind of losses your project suffer from. The P90 will depend on the variability and uncertainties you define in the Energy management window.
-
The structure shading factor is design to reflect the area covered by the structures. The electrical effect of this shading should be reflected in the mismatch loss factor. Thus if I understand your example correctly, the mismatch loss factor should be set to 40% if 40% of a cell in the concerned sting is shaded. For the structure shading factor, define only the ratio of the area covered by structures to the photovoltaic area.
-
Report shows spectral correction applied even when it isn't
Linda Thoren replied to LauraH's topic in Problems / Bugs
it is the coefficient set for that specific PV module technology. You can find additional information in the following help: https://www.pvsyst.com/help/physical-models-used/pv-module-standard-one-diode-model/firstsolar-spectral-correction.html#spectral-correction-in-pvsyst -
Auxiliary Energy Losses – How is the calculation performed?
Linda Thoren replied to Maynara Torres's topic in Simulations
Hello, In the loss diagram, each loss is defined as percentage of the previous energy quantity. In general, if you have defined a continuous auxiliary loss and export an hourly output file, you will see that this value will remain constant, though the percentage it will represent will of course vary depending on the production (if you for instance look at the loss diagram for the different months). You can read more about the loss diagram and the auxiliary losses in the following help page: https://www.pvsyst.com/help/project-design/results/loss-diagram.html https://www.pvsyst.com/help/project-design/array-and-system-losses/auxiliaries-consumption.html Please let me know if this answers your question. Kind regards, -
Hello, When defining monthly values, it is assumed that the consumption that month is identical throughout the month. Thus from kWh/month to an average power is simply a calculation of how many hours there are per month. Note that the average power need for monthly values are reflecting day and night consumption, thus it does not directly make a very good basis for the needed installed AC capacity, but at least a fist order of magnitude.