
Linda Thoren
-
Posts
354 -
Joined
-
Last visited
Everything posted by Linda Thoren
-

Inquiry About PVsyst-Generated PDF Password Requirement
Linda Thoren replied to NFI's topic in Simulations
Dear NFI, Indeed, in earlier version the report was protected so that it cannot be manipulated. To use certain graphs, you can instead click "Export" and "copy to clipboard" Kind regards -
In the printed report you can include both the performance ratio and a P50/P90 evaluation, but not a performance ratio of the P90 evaluation. Kind regards
-
Necessary steps while using actual measured data for PVsyst.
Linda Thoren replied to bommu's topic in Suggestions
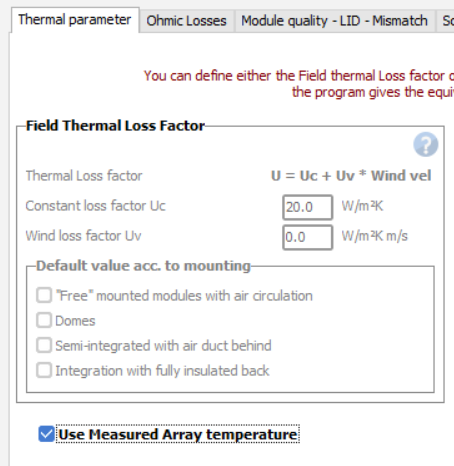
Hello, It is possible to import measured data through the databases window, Custom file. Choose your file, define your site and click New to construct the format file. For measured Global Inclined Irradiance, or Plane of Array Irradiance, choose the Measured global on plane variable GlPMeas and define the orientation definition and albedo. Measured POA irradiance import uses HAY transposition model. Make sure that the simulation is also performed with Hay transposition model to ensure consistent POA. You change the transposition model in the Project settings, Design conditions tab. The module temperature should be imported as the variable TArrMes - measured module temperature. If you do not have any measurements for the ambient temperature, ambient temperatures will synthetically be generated from another source and this function seems to not work correctly. When running the simulation, in the detailed losses window, thermal parameters tab, make sure you tick the option Use Measured Array Temperature and the synthetically generated ambient temperature will not be an issue for the thermal losses. Kind regards
-
Hi, The output will depend on your type of system. A fixed tilted system with an optimum tilt and azimuth will peak when the GHI peak, a east west system will rather peak in the morning and evening. This is also what you see a bit with trackers with trackers with a north-south axis during months where the sun's position is relatively low. Indeed such a drastic peak in the end of the afternoon looks strange, is the irradiance data and the hourly output aligned? Do you have an have an azimuth? Is there a horizon line? To be able to analyze this in more detailed, please send your project to support@pvsyst.com Kind regards
-
Vertical panels - ground reflexion for monofacial
Linda Thoren replied to v.ming's topic in Simulations
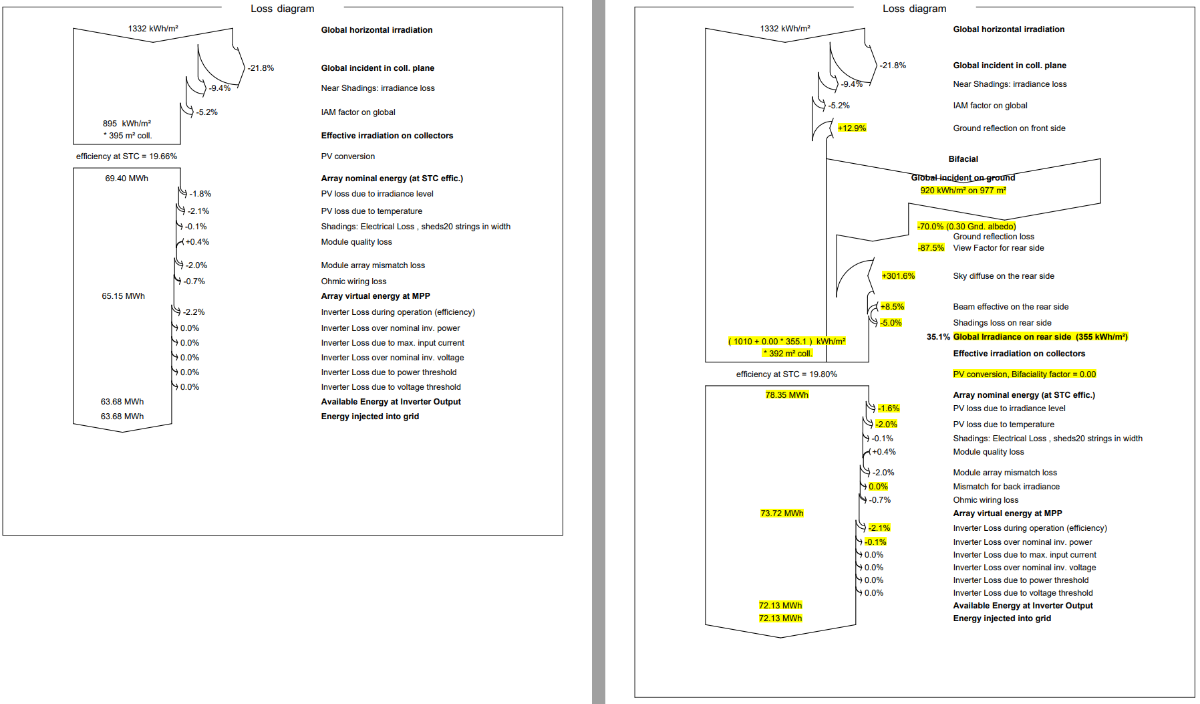
Hi, Indeed, today the ground reflection is only considered for bifacial systems. As you say, the ground reflection for the front side can be rather significant for vertical systems. The only way to run a simulation including the ground reflection for the front side for a monofacial system today, would be to alter the PAN file (activating the bifaciality and put the bifaciality factor to 0) and run a simulation with the bifacial parameters, though everything except the ground reflection on front side will be 0 given the bifaciality factor of 0. In the example below I defined a vertical system using the unlimited sheds, facing south, 2 rows, 20m high and a pitch of 50m, to simulate a system similar to a façade mounted vertical system.
-
Hi, No, the stand alone system will prioritize solar and only use the genset as a backup, thus unfortunately this is not possible to plan charging of the batteries with the genset without a direct use (and possibly waste solar produced energy in the morning if the batteries are already full and there is no direct need). The genset will ensure the recharging of batteries when the solar energy is insufficient to satisfy the user's needs.
-
Getting error when trying to import Standard weather data file
Linda Thoren replied to Mike99's topic in Meteo data
Hi, If you have own measurements, please import them as a Custom file, there you can import a file with any separator or date format. -
Saving the measured data points in custom weather data format
Linda Thoren replied to Mike99's topic in How-to
Hello, The denomination of a given time interval in PVsyst is always defined as the beginning of this interval. This is valid for hourly, daily or monthly values. For weather data, the time stamp is the time interval over which the irradiance measurement (or any other value) is averaged. For example, the time stamp 11:00 corresponds to measurements averaged between 11:00 and 12:00. The time stamp is not defined in this way for all external weather data. Some of them use the end of the interval, some are measurement between 11:30 and 12:30, or any shift within the hour. Therefore when importing weather data, PVsyst has to adapt its internal time interpretation, in order to always calculate the Solar Geometry in the middle of this interval. In general, when importing a custom file, you can import minute data and PVsyst will adapt the format to run hourly simulations. In the databases window, click Custom file, choose your datafile, define your site, click New and define all the relevant parameters (time step, date format, variables etc.). You can read more about the Time Definition in PVsyst in the following link: https://www.pvsyst.com/help/physical-models-used/time-definition-in-pvsyst.html?h=time+stamp#basic-time-dst -
Hi, In PVsyst, the back-up generator is considered as an alternator+rectifier element (Genset), ensuring the recharging of batteries when the solar energy is insufficient to satisfy the user's needs. You find additional information in the PVsyst help page below: https://www.pvsyst.com/help/component-database/back-up-generator.html?h=back+up+generator+(genset)
-
Hello, There is no straight foreword way to calculate the PR for a probability distribution, (defining the GlobInc for instance). If there is a standard for this, we will implement it.
-
Hi, Indeed, PVGIS 5.3 will be available in the next version of PVsyst (8.0.7) being released next month. Until then you can export your PVGIS data as a .csv file, and import this as a Custom file in PVsyst. Go to databases, Custom file, choose your PVGIS file from your computer and define your site. Click New and define all the relevant parameters, such as the Time step, numbers of head lines to be skipped before the data starts, format of the date, in which column what variable can be found etc. By clicking ok you can then start the conversion of your data to a .MET file that can be used to run your simulation. Kind regards
-
Hello, Indeed if you still have a valid license you can simply update from PVsyst 7 to PVsyst 8 and two ways you explain should both work. Kind regards
-
Hello, We are aware that since December 18th, PVGIS has modified their format for the TMY output, which has affected the functionality of our API. This will be corrected in the next version that will be released this week. You can also see a work around in the following post: Kind regards
-
PVGIS TMY 5.2 giving error in every version of the software.
Linda Thoren replied to Niels's topic in Problems / Bugs
Hello, We are aware that since December 18th, PVGIS has modified their format for the TMY output, which has affected the functionality of our API. This will be corrected in the next version that will be released this week. You can also see a work around in the following post: Kind regards -
Weather data Import_ error with PVGIS TMY v. 5.2
Linda Thoren replied to StefanoS's topic in Problems / Bugs
Hello, We are aware that since December 18th, PVGIS has modified their format for the TMY output, which has affected the functionality of our API. This will be corrected in the next version that will be released this week. You can also see a work-around in the following post: Kind regards -
Importing actual weatherstation data on to PVsyst
Linda Thoren replied to Sydwell's topic in Meteo data
Hi Sydwell, The idea with the Custom file import is that you will customize the import based on the specific format of your file. Thus in this tool, you will be prompted to define that for instance 4 lines should be skipped to arrive at the data, the date is found in column 1 and has de format YY/MM/DD HH/MM, the GHI is in column 4 and the temperature in 7 etc. -
Importing actual weatherstation data on to PVsyst
Linda Thoren replied to Sydwell's topic in Meteo data
Good day Sydwell This can be done through importing a Custom file. Click Databases, Custom file, choose your source file, define your site and click New to start the process of converting the source file to a format that is supported by PVsyst. In this new window you have to define variables such as the file's time step, the format of the date and in which column you find what information. By saving and running a conversion of the data, you can then use this new file in your Project simulation. Kind regards -
The best way in general to import and export projects, is to first export the project as a .zip either by clicking "File" and "Export project" in the welcome window, or "Export" in the Project. Like this you are sure to include all the needed files when you then import the project to another work space. With a complete project file you can import by clicking "File" and "Import project" or similarly click "Import" in your project. If you only have the .PRJ and .VC1, you can import a folder containing these files similarly to how you import other components, through the "Import components", or by placing the files in in the "Projects" folder in your workspace.
-
Dear Stewart, Do you mean that you have a .SIT and .MET already that you want to use in another project in another workspace rather than create new ones? In this case, one way is to use the "import component" function, that you find under "File" in the PVsyst welcome window and import a folder containing the relevant files. Another way is to simply to open your current workspace (you find your workspace in the bottom right corner in the first welcome window in PVsyst, by clicking on the link you find a folder structure that is saved on your computer) and place the .SIT file in the folder "Sites" and the .MET file in the folder "Meteo". Like this, the files are saved in your database and you should be able to find them in the list of sites and weather files. To create a site file and weather file in general, I invite you to read the tutorials available on our website, as well as the video tutorials on the subject in the links below. https://www.pvsyst.com/pdf-tutorials/
-
Hi, Unfortunately this function is not available yet and indeed to see the production of each individual PV field you have to separate the fields into individual variants. Kind regards
-
Representing unavailability of part of the system
Linda Thoren replied to Mojailat's topic in How-to
Dear Mojailat, Indeed, there is not yet a straight foreword way of defining unavailability per sub-array. This use case has been identified and it is on our roadmap to add this function for a future version, though it will not be available in the near future. Kind regards and thank you for highlighting that this indeed would be a valuable feature -
Voc gets reduced when decreasing temperature
Linda Thoren replied to Dominik Damberger's topic in Problems / Bugs
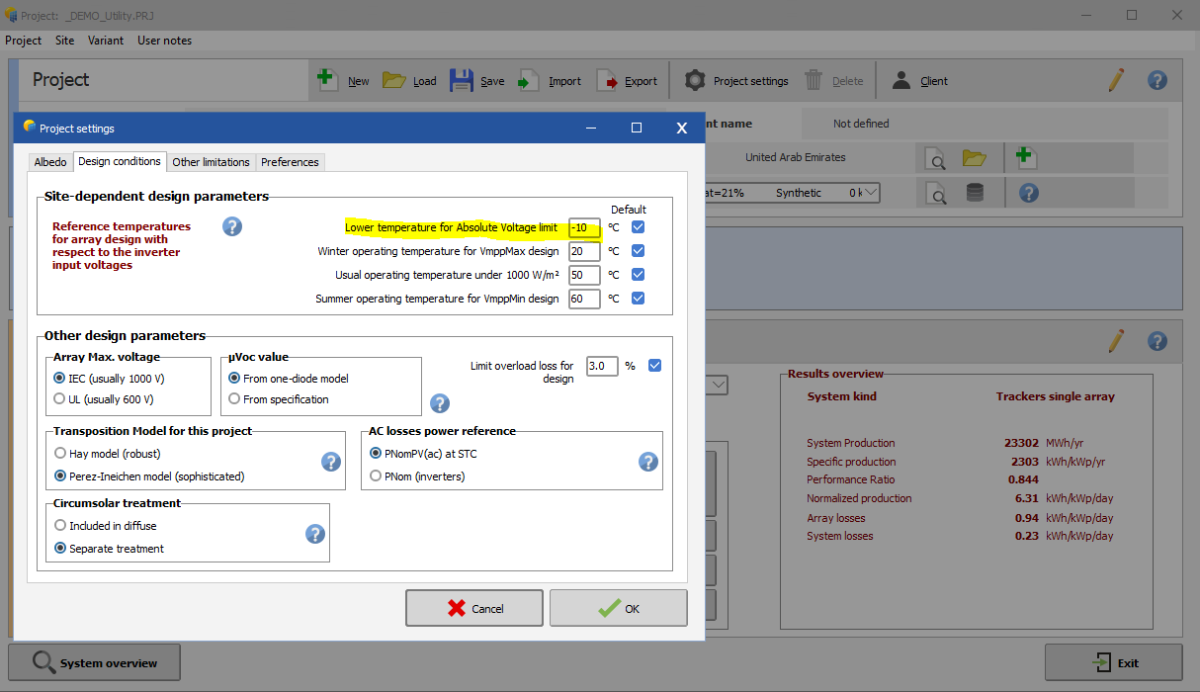
Hi, On the "Basic data" page of the PV module's definition, the frame "Internal Model result tool" allows to display the main electrical characteristics under chosen operating conditions. This tool is only informative. It doesn't hold any parameter for the definition of the PV module. To change the threshold that triggers the error message, go to Project settings, Design conditions, see below Kind regards
-
Grid-connected PV plant with battery storage and no self consumption
Linda Thoren replied to Vasil Janevski's topic in How-to
Dear Vasil Janevski, Yes indeed, in PVsyst we have 3 storage strategies and the "Peak shaving" correspond well to what you are describing. Following youtube tutorial further explain this feature in PVsyst: Kind regards -
Hi, It is difficult to evaluate without more information about your system and the layout, it could well be that there is not much shading and thus normal that the shading would be 0%. Please export your project as a .zip file to support@pvsyst.com if you wish that we have a closer look. Kind regards
-
Hi, With the latest PVsyst version, automatic mode for diffuse shading calculations for systems that involve trackers has indeed been removed. Now, users are required to manually define a representative tracker for diffuse shading calculations. You define a representative tracker by clicking “Tools”, “Trackers diffuse shading definition”. In this tool you can choose to calculate the diffuse shading factor for all trackers, or select a representative tracker that will be used to evaluate the diffuse shading factors You can find more details about this update and instructions in the PVsyst Help documentation here: PVsyst Diffuse Losses with Tracking Systems. Kind regards,