All Activity
- Today
-
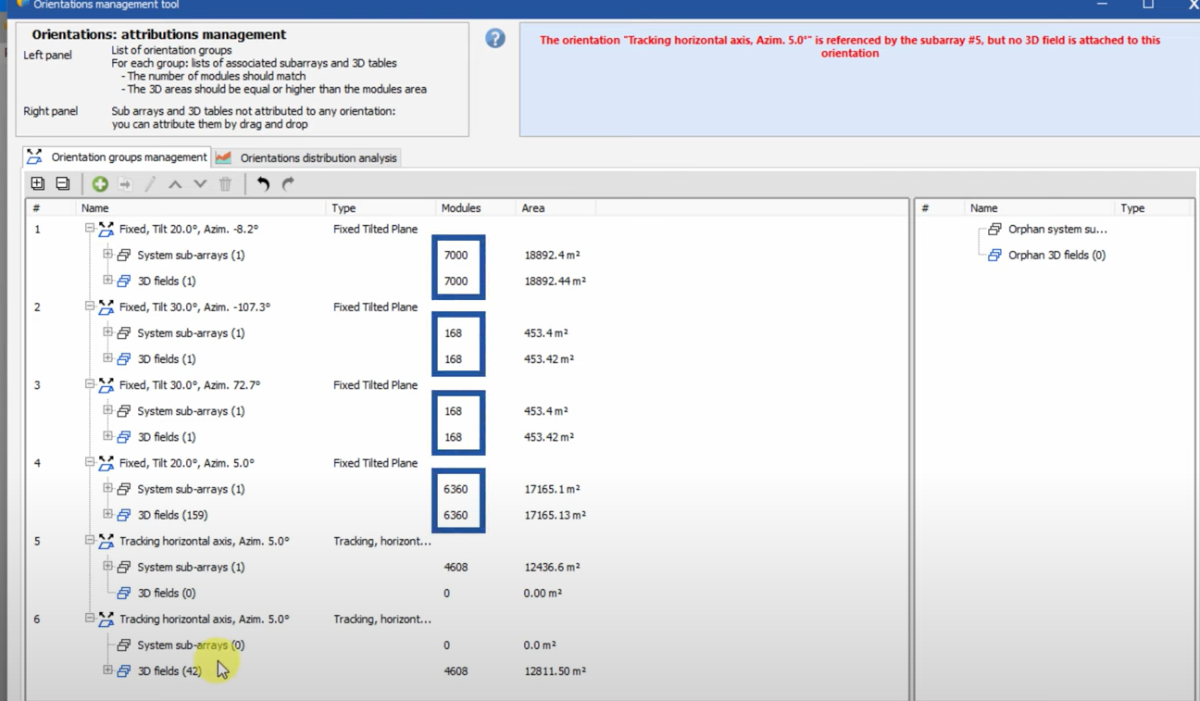
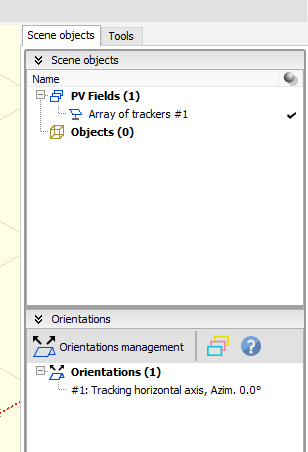
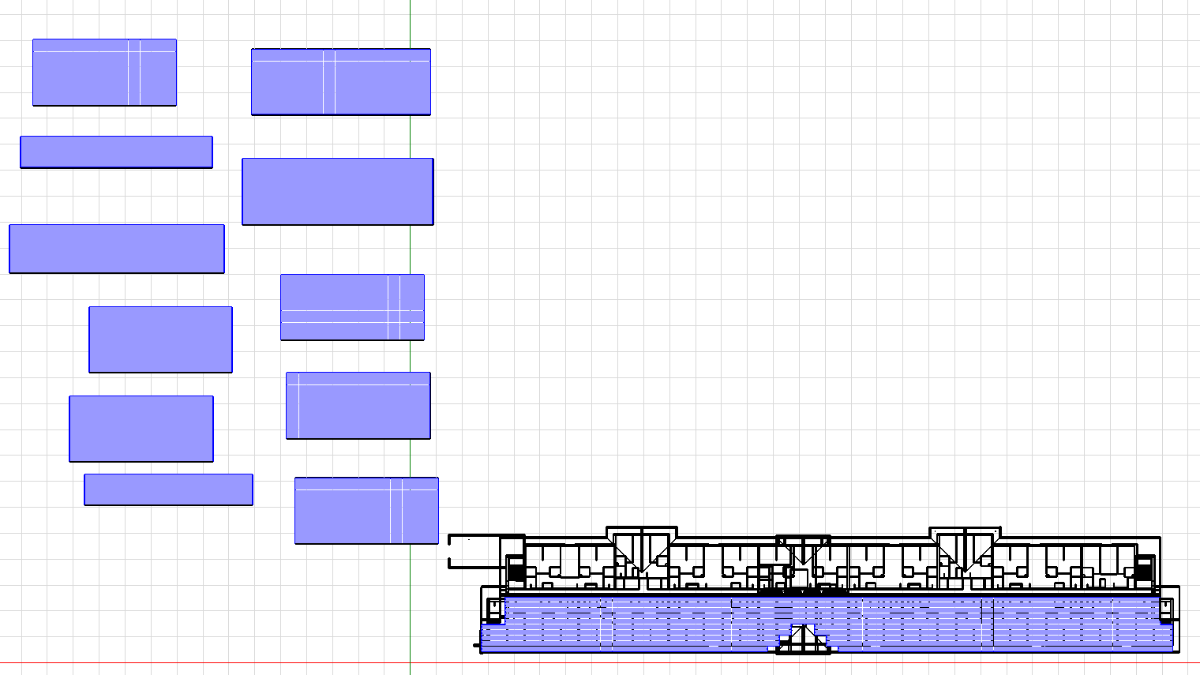
In your print screen you see all the details of the number of modules in each sub-array and each table assign to the defined orientations. The difference between your print screen and the video is that the folders are collapsed. Click on the small minus icon collapse the folder and see the total of modules in the system/3D scene for each orientation. If they do not match, you need to add/substract the modules defined in the 3D scene, or in the system.
-
 Ariyan joined the community
 -
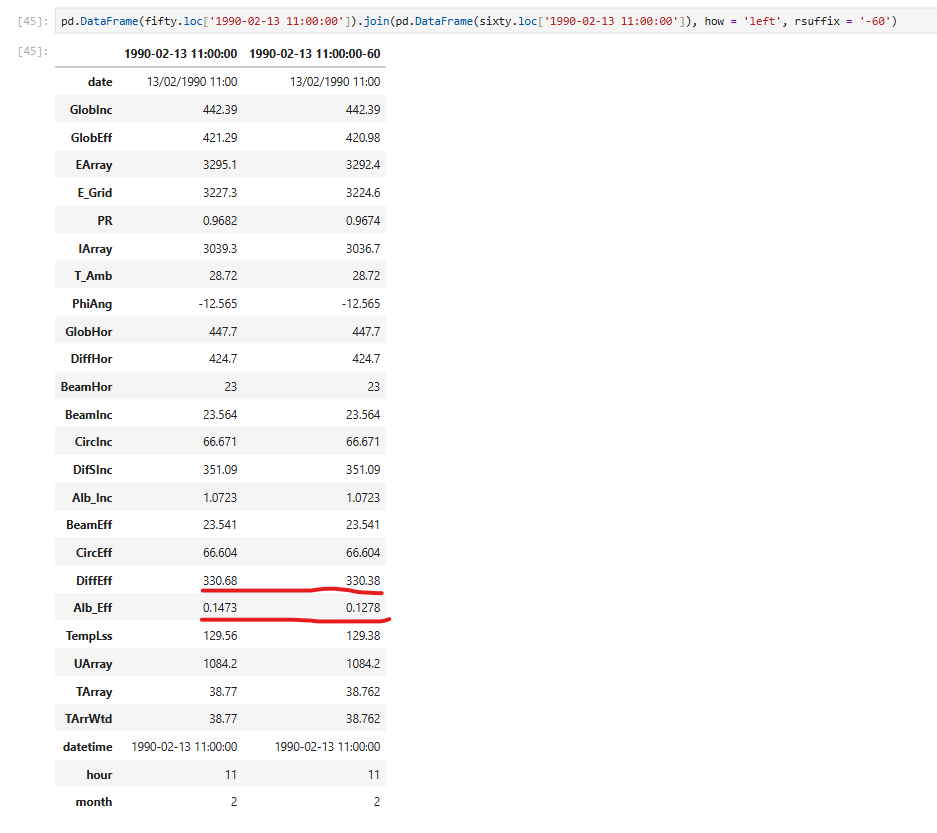
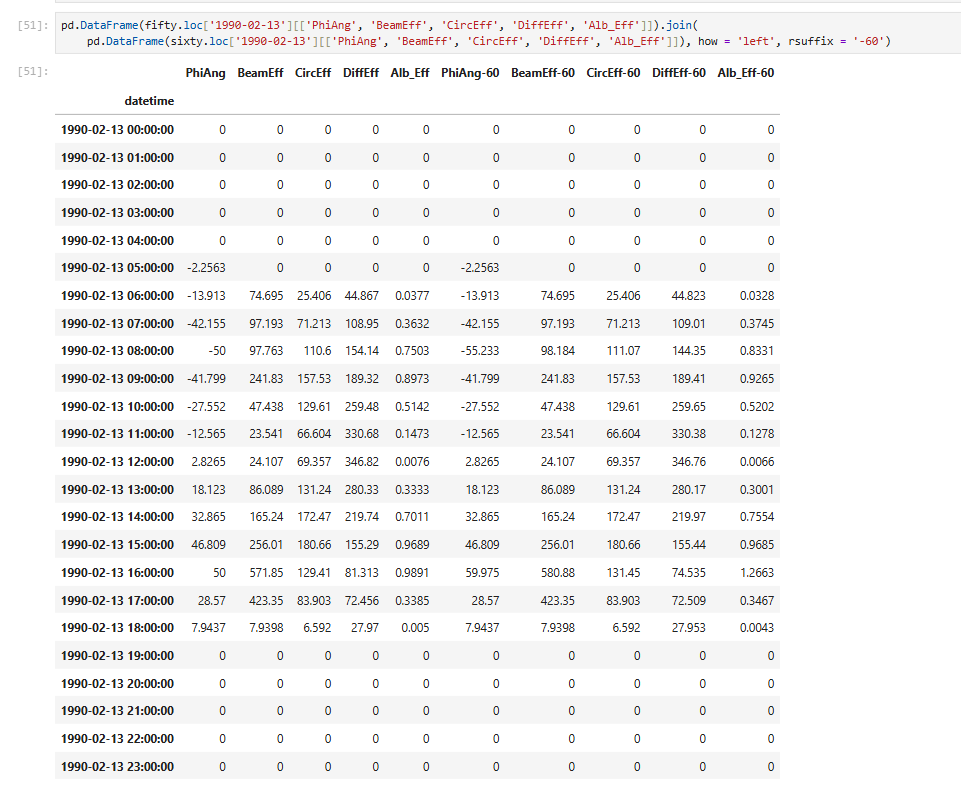
 Hi PVSyst team, I've been doing some investigation into the effect of how energy production is affected by changing the SAT tracker angle limit from 50deg to 60deg. I've created a project with a SAT with +/-50 degrees tracking limit (PhiAng). I've copied this project and changed the tracking limit to +/-60 degrees (PhiAng). No other parameter or input was changed - same weather file, same components, no changes to tracker geometry, 3D model or site configuration. Interestingly, output reduces slightly with a +/-60 degrees limit. While investigating this reduction, it appears that I'm getting a difference in effective irradiance components between the 50 degree and 60 degree simulations at times when the trackers are at the same phi angle. I'm assuming that the difference in calculated effective irradiance components is then driving the differences seen in temperatures, current and energy production. I have attached a screenshot of a single timestamp for both simulations, and a comparison of effective irradiance components and PhiAng across an entire day. At the time shown (11 am, southern hemisphere summer), the two systems should be in *identical* states (same weather data, same system definition, geometry and layout, well outside any periods of backtracking), any ideas why changing the only tracker angle limit would result in these different calculated irradiance values? Thanks
-
Nathan M joined the community
-
 John Phillip Magpayo joined the community
 - Yesterday
-
I've watched the video, but the video does not show how to match the number of modules between the 3D fields and subarrays... how do I make my orientations management tool window look like the one in the video??
-
In the 3D scene you can define each table by modules. In the Orientations management you find detailed information about what is defined for each orientation In the following youtube tutorial you find examples of how to define a 3D scene and how to navigate in the window: On our website you can do a request for a training sessions on various topics: https://www.pvsyst.com/en/training/consulting/
-
Also, I am noticing the following limitation of the software: in the 3D scene there is a way to specify the width and the length of a PV surface while in the system definition there is only an option to specify the area of a PV surface making the whole process of matching the number of PV modules between the 3D scene and the system definition cumbersome at best... unless I am missing something
-
 Dear @PranavK, this is new to us and unfortunately I cannot say much without looking at the project. Can you send it over at support@pvsyst.com ?
 -
Thank you for your response, but the reason why I posted to this forum is because I could not correct the errors myself. Is there a way to request a call via MS Teams so I can share my computer screen and someone from PVsyst support will provide the assistance?
-
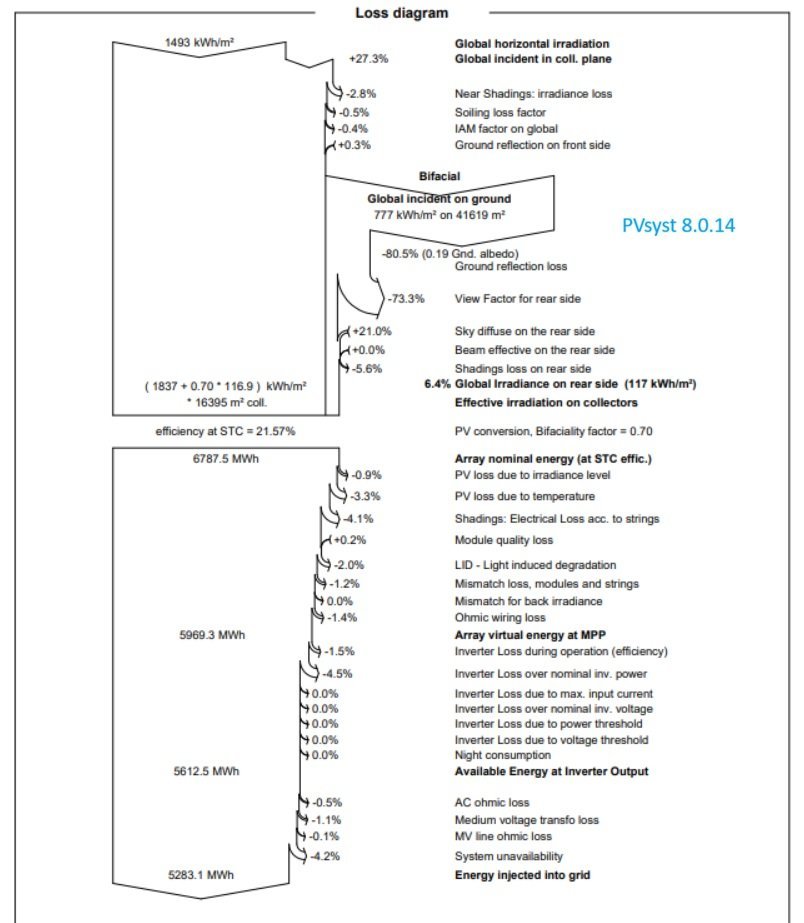
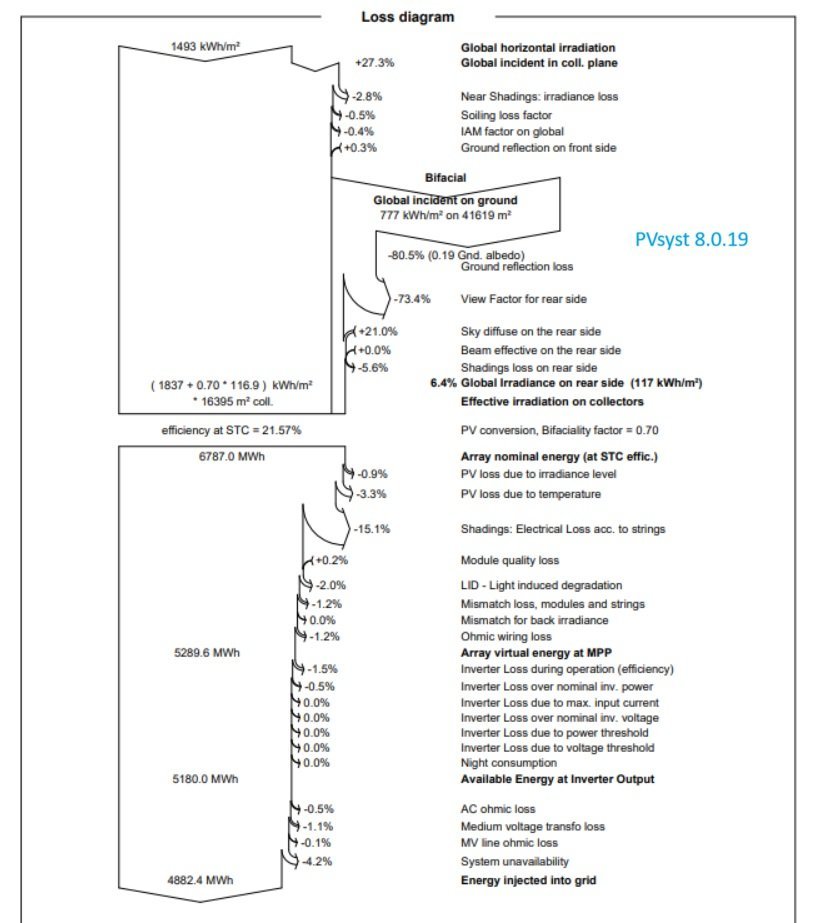
 Hi @Michele Oliosi, I am experiencing a similar issue currently. I've run two iterations of the same project in two different versions 8.0.14 and 8.0.19. All the parameters are the same. The Shadings: Electrical Loss acc. to strings in the latest version jumps to 15.1% compared to 4.1% from the previous version. Also, the Inverter loss over Nom. inverter power loss was 4.5% previously which later decreased to 0.5%. The loss diagrams from both versions are attached. Could you please help with this?
-
 First of all, the definition of the "Solar Fraction" SF = EUser / ELoad is valid for Grid-connected systems. In Stand alone systems this is more complex: it is the Output of the PV system (EOut converter), minus the battery energy balance: SF = ( EOutConverter - EBattCharge + EBattDischarge ) / ELoad. The battery balance (EBattCharge - EBattDisch) includes the difference in SOC between the beginning and the end of the interval, and the battery losses. Therefore: - Over la short period, the Solar fraction is not relevant because of the battery SOC difference, - Over a long period, the SOC difference contribution becomes lower, but may still alterate the real value of the Solar Fraction. Now the battery losses are extremely difficult to evaluate, especially due to the variability of the effective capacity of the battery according to the Charge/Discharge rate: in PVsyst this is an approximation, which may sometimes lead to "positive" battery losses in some cases (depending on your load profile definition). This seems to be the case in your project, where the differences are very low (some few permille). See the Help https://www.pvsyst.com/help/physical-models-used/batteries/battery-model/battery-efficiency.html?h=battery
 -
PranavK joined the community
-
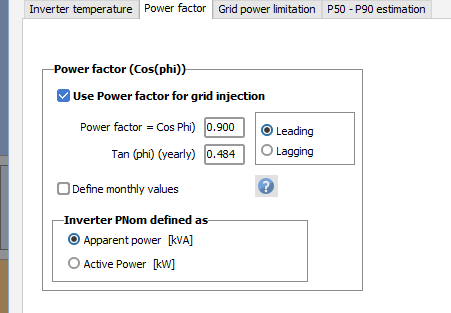
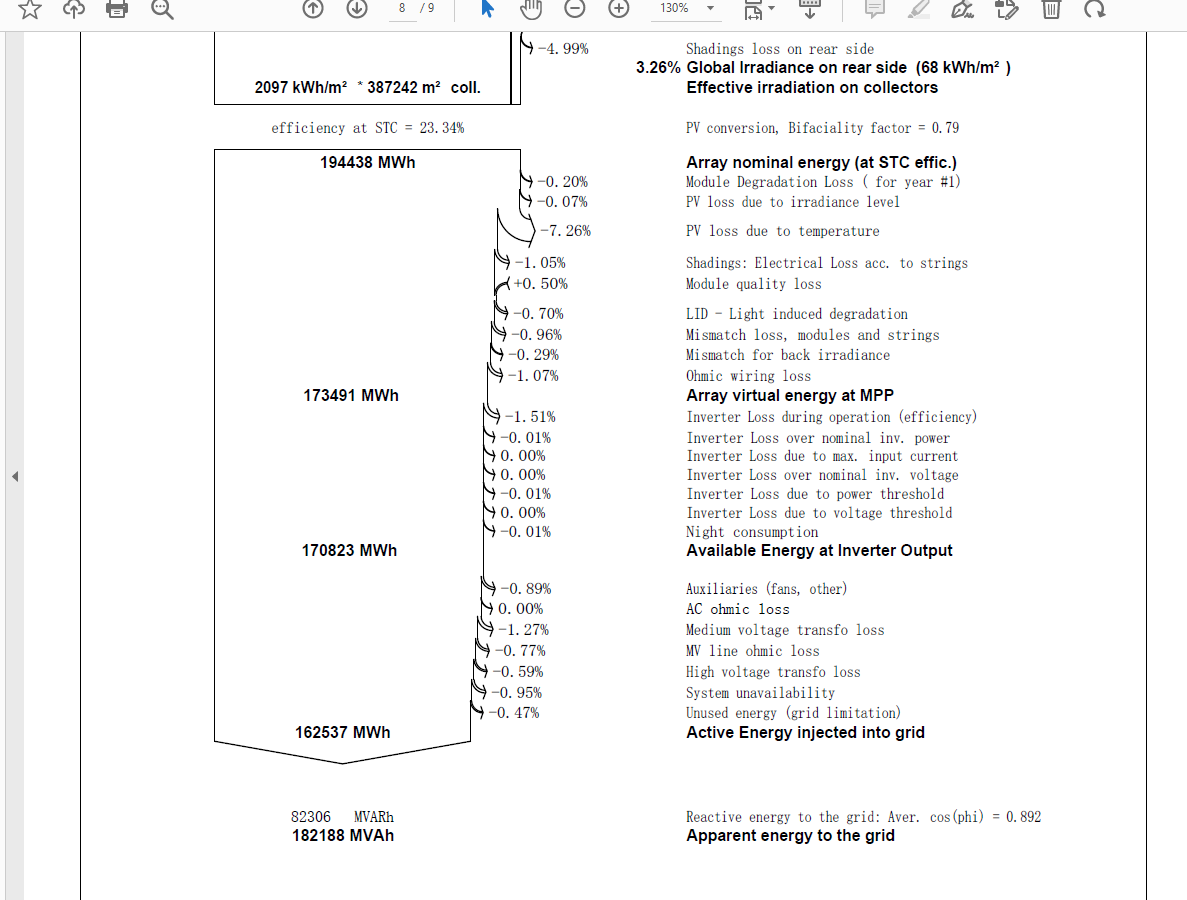
 You can find the detailed explanation to your question in our documentation on the power factor : https://www.pvsyst.com/help/project-design/grid-connected-system-definition/power-factor/index.html Check in particular: https://www.pvsyst.com/help/project-design/grid-connected-system-definition/power-factor/Simulation results.html In short: the power factor that you set in the menu "Energy management", here cos(phi)=0.9, is the power factor at the inverter level. The reactive power will be computed from the available power at the output of the inverter as EReGrid=EOutInv×tan(ϕ). We assume that there is no loss of reactive energy from the inverter to the injection point. However, we assume active energy loss in the AC circuit. Therefore, the power factor at the injection point will be decreased compared to the setting at the inverter output.
 -
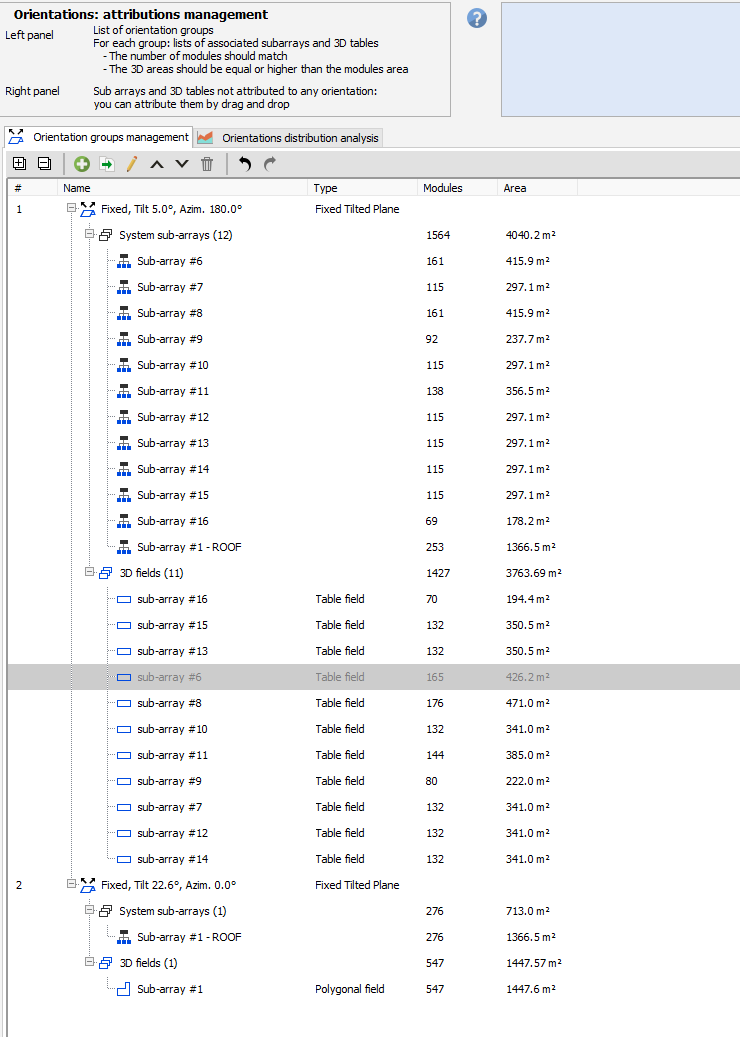
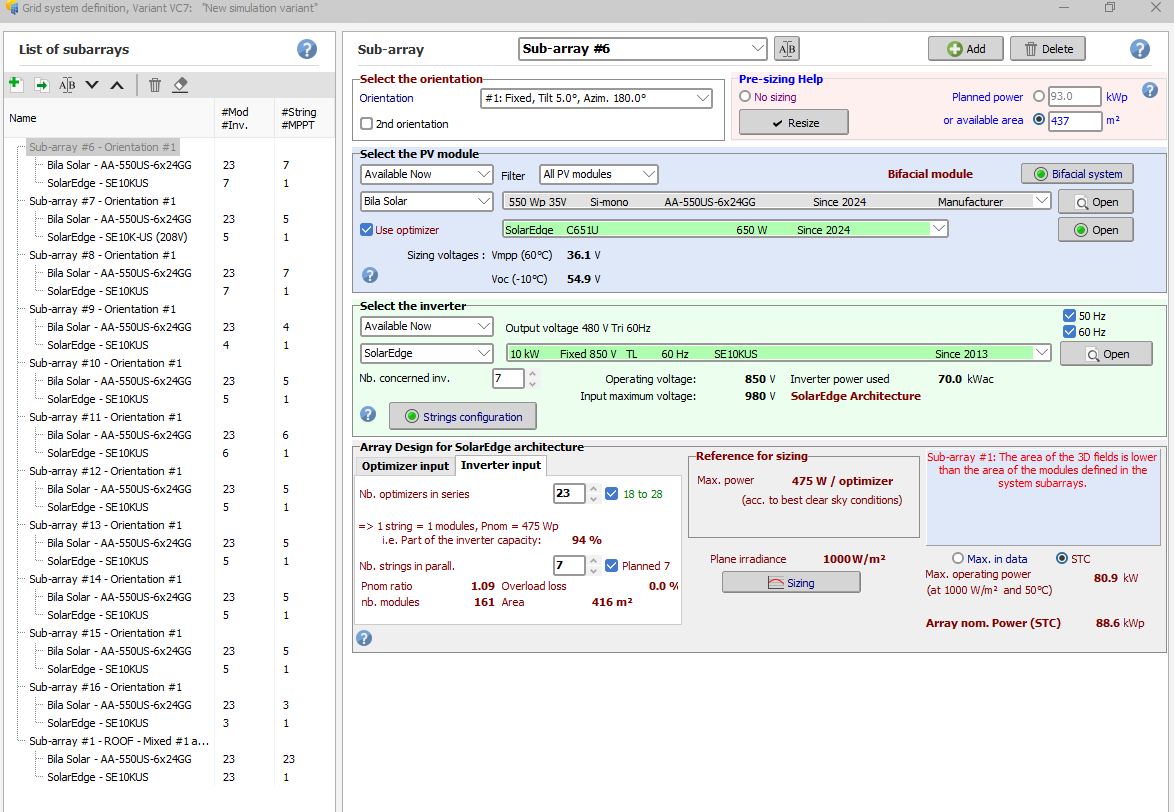
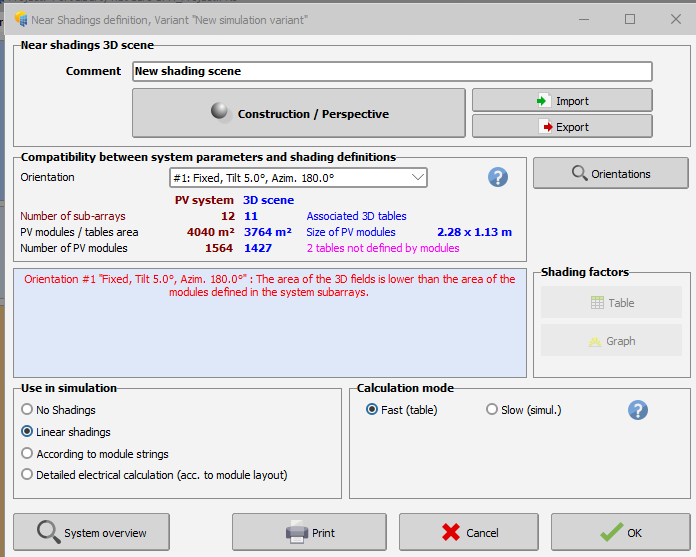
Hello, The error message indicated that the 3D scene and the system definition does not match. For instance, in the first orientation (tilt 5° and Azimuth 180°), 1564 modules are defined in the system but only 1427 in the 3D scene. Verify also that the orientations, are correctly defined. In PVsyst, Azimuth of 0° is towards the equator, and 180° thus the opposite orientation (North is the northern hemisphere and South is the southern hemisphere)
- Last week
-
I am designing a hybrid (roof + carport) PV system and getting several error messages referenced in the attachments. Could you help me to correct the errors?
-
-

Nominal discount rates, LCOE and PBP calculations
Hizir Apaydin replied to Gavin M's topic in Suggestions
Dear Gavin, Thanks for the detailed analysis. These are valid points and we agree that the current LCOE formulation in PVsyst does not strictly match the standard, financing-neutral definition commonly used in the literature. We also confirm that the discount rate used in PVsyst is the nominal one. We’ll take a closer look at this internally, both to better clarify what the current indicator represents and to evaluate how we could move closer to commonly accepted LCOE formulations (project-level, WACC-based) in the future. Appreciate you taking the time to raise this and share your perspective. Best regards. -
 USPE joined the community
 -

Difference in Produced Energy while comparing with the ageing
Linda Thoren replied to hritik's topic in PV Components
Please send your project to support@pvsyst.com and we can have a closer look. Kind regards -
 AlbanLovense joined the community
 -

Difference in Produced Energy while comparing with the ageing
hritik replied to hritik's topic in PV Components
Yes, First Year is selected in the ageing tab, The latest version of PVSYST i'm using. 8.0.19 -

Tracker Power Supply Demand - Where to mention?
dtarin replied to Job Sebastian's topic in Shadings and tracking
Auxiliaries tab: proportional to inverter output power (i.e., 1 W/kW = 0.1%, etc.). -
 Robera Daba joined the community
 -
Indeed, the unlimited sheds only consider the row to row shadings. For a more detailed analysis of the shadings from objects such as trees and buildings, you can define a 3D scene and simulate the electrical shadings with the module layout. The following youtube tutorial illustrates haw to create a 3D scene, and the following link to our help page, describe how to define the module layout: https://www.pvsyst.com/help/project-design/shadings/electrical-shadings-module-layout/index.html
-
hello, In the print screen you have activated the "multi MPPT feature" and defined 3 MPPTs, though your inverter has 2MPPTs per inverter, this 1.5 inverters with a total of 15kWAC for a nominal PV Power of 13.9kWp. The following youtube tutorial shows in detail how to define your system configuration (in version 7):
-
hello Jack, thanks for your message. What you reported is not a bug and has been done by design. This window has been limited in size, otherwise it would display big empty spaces without any additional information. regards, Laurent
-
 buraq12 joined the community
 -
Optimizers won't necessarily increase the system production. Optimizers are especially useful when a part of the string is partially shaded, and has a different Impp (current at max power point) from the rest. Without optimizers, the whole string have to use the current of the worst module, leading to a lower overall production. With optimizers, the shaded and unshaded modules can operate at their own optimum current, the optimizers ensuring the output current to be the same. But when you don't have partial shadings, optimizers cannot improve anything. And since optimizers have their own efficiency, they end up increasing the system losses, leading to a lower PR.
-
Hello, In the second print-screen, you must activate the option "Use the sharing of Nominal Power between MPPT inputs of a same inverter". You find a full tutorial of how to use this tool (version 7) in the following youtube video: Kind regards
-
Difference in Produced Energy while comparing with the ageing
Linda Thoren replied to hritik's topic in PV Components
Hello, Thank you for reaching out. Please first verify that you are indeed simulating the first year (that in the aging tab in the detailed losses window, year 1 is defined). What PVsyst version are you using ? Some discrepancies and rounding errors can appear Kind regards, -
 "I want to know whether such calculation results are normal and what the reasons for such differences are?
 -
I have a question regarding the power factor. I set the power factor(cos phi) to 0.9 in PVsyst Version 7.4, but the energy flow diagram in the calculation result report shows it as 0.894. I would like to know the reason for this discrepancy.