

dtarin
-
Posts
873 -
Joined
-
Last visited
Posts posted by dtarin
-
-
You have answered your own question, temperature is considered in the output and losses due to temperature are shown in the simulation reports.
-
Each inverter will need to be in a separate sub-array.
-
22 hours ago, Afshin said:
Hello,
I am using an unlimited single-axis tracking system for a 100 MW utility-scale PV system. To determine the inter-row spacing, I currently analyze shading 10% of the whole area using that shading animation tool in PVsyst for December 21 (Winter Solstice). The GCR is 36.5% and the tracker spacing is 6.6 m. If I were to conduct a comprehensive shading analysis for the entire 100 MW system, would the results differ?
What do you mean by unlimited single axis tracking system? Did you model this in the 3D scene editor, or did you use the unlimited sheds method?
-
Depends on the size of the plant and if there is an O&M service involved, etc. If its utility-scale with O&M (guaranteed response times, etc.), 2% is good. If it is a small site, you might want higher.
-
It is set by the user under detailed losses.
-
-
Horizon files need two columns, azimuth and height in degrees. Horizon data is not usually from a TMY weather file. For horizon data you can use PVGIS from within PVsyst. The PVsyst format there is for when you have Horizon data from another source.
-
-
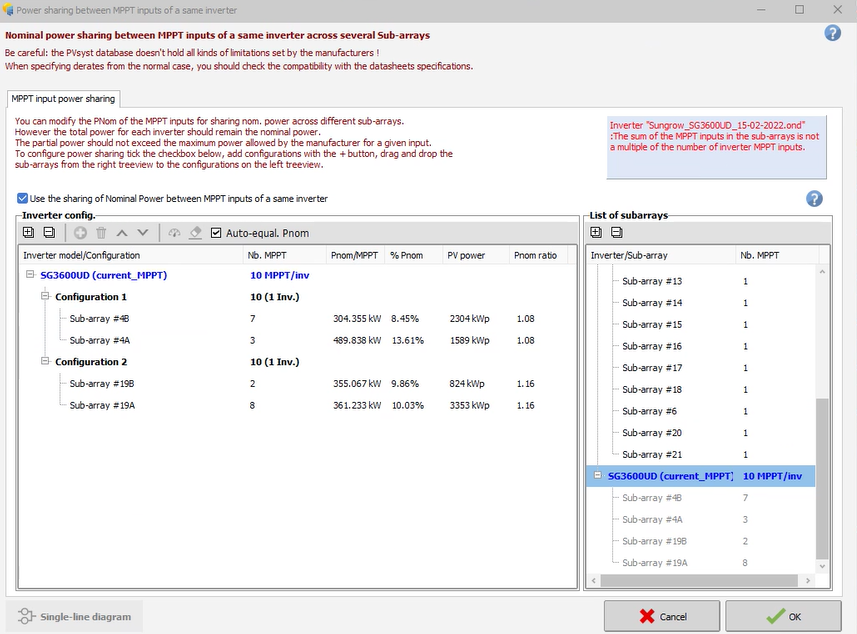
I have created a dummy OND file for power sharing and modeled together with a non-modified OND file. The non-mppt share inverter is showing up in the power sharing list and giving an error. I dont think the inverter should be listed in power sharing. The inverter is listed in the error and noted below with 1 mppt

-
TMY p50 for standard energy estimates. you can also import the time-series data if you wish to run time-series models.
-
-
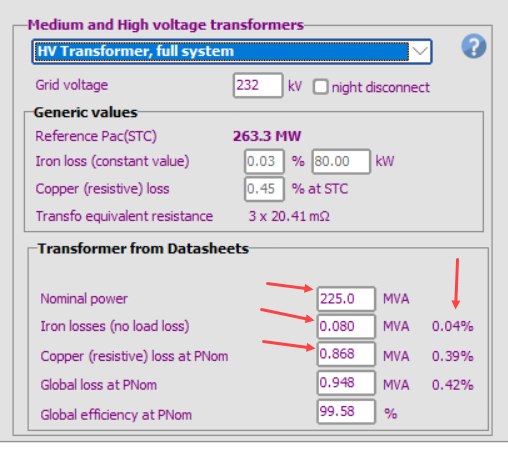
In PVsyst, the inputs for HV transformer are in MVA. Ensure that the percentages shown match what you have there. PVsyst should then calculate correctly. Your MV waterfall loss looks appropriate for the inputs.
-
Go to advanced sim > output file, select to create a file, select the variables you wish to include. Then, go to batch sim, set up your items there, and confirm the output variables there in the last tab.
-
Grid connected PV system. After entering in your system and losses, under advanced simulation, you can run batch mode to run multiple simulations and specify the tilt angle to use. Output the results to excel file (.csv).
-
Run yearly simulations at every tilt angle, analyze the 8760 at each hour to determine tilt associated with desired current.
-
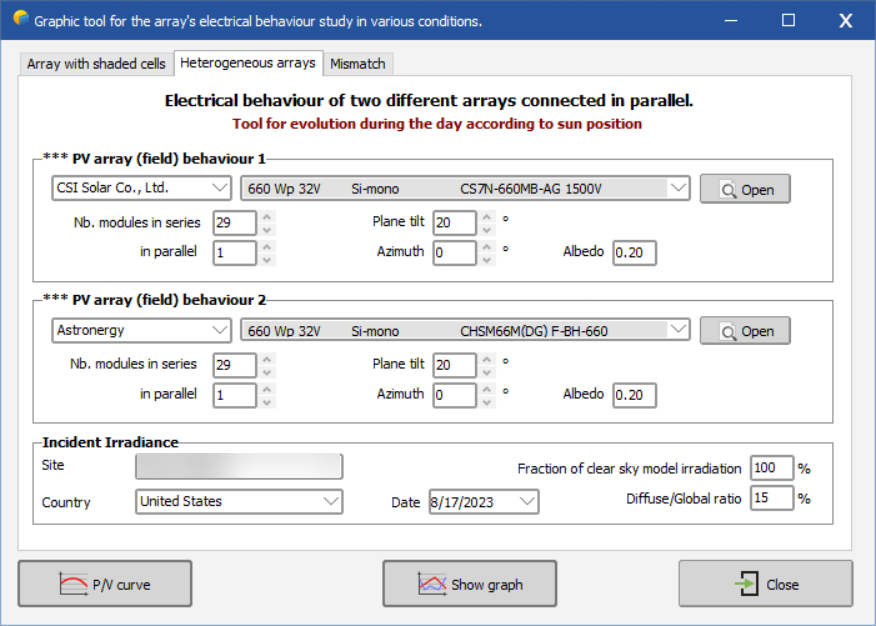
In the heterogeneous array tool, we can select modules at a given string size and view the graph, but it would be very useful if we could also export this data to csv, similar to how we can when viewing the graphs in the PAN file. If there were the ability to select string size and # of strings in parallel from the PAN file with the different variable options that are there, that would be even better.
-
I do not think there is anywhere (where someone would build solar) that has a low temperature of 30 degrees C, and I wouldn't recommend forcing the design to accommodate what the customer thinks is correct. As Michele noted, you are not concerned with average site temperature, but the lowest temperature at which there may be sufficient irradiance. If you design to 30 degrees C, your inverters will most likely have frequent start-up issues and the warranty of all components will be in jeopardy. That is not a 1,500V design.
-
The best way for Autocad is assuming that you have contour lines,
- Remove/freeze everything from the drawing but the topography (contour lines)
- Explode down to minimal size (each polyline will breakdown to have a segment of three points)
- Run dataextraction command, select "line", and select the data for "Start X, Start Y, Start Z", export to csv
- If your drawing is in feet, convert to meters for PVsyst, save into .CSV value with one header row, X, Y, Z
- Import into PVsyst. You may need to take a screenshot of the autocad drawing with terrain and with modules and import also into PVsyst so that you can then line everything up in the shade scene.
-
Create two separate variants, they cannot be modeled together. You can export the final outputs to excel and combine.
-
13 hours ago, Katinka89 said:
Dear dtarin,
thank you very much for your quick reply.
I already know this procedure. I then enter the weighted average of the losses and only one transformer and add all the no-load and full-load losses of the transformers. Is this correct?
I just wonder if it is also possible to calculate the weighted average of the lengths to run the simulation?
Because in PVSyst, under detailed losses, you have the option to enter either the length of the wire or the loss fraction.
Determine the total, weighted loss fraction and use that. PVsyst will auto-calculate length based on the wire size. Let it do that, as long as the loss % is correct, and you end up with a representative value in the waterfall.
-
You can select multiple items and change a parameter for all selected items at once. I don't think this can be imported.
-
Possibly, but why are degradation and degradation dispersion are so high for 1st year?
-
You can use software or do it manually. You know the conductor size, length, max current carried, etc. in each segment. Calculate the loss for each segment. Then you can combine into a total loss, or keep separate. Each segment should be treated separately. If the loop is from MVPS 1 to 2 to 3 to 4, the current along the way will increase.
-
And to extend what Ander provided, what I have done in the past is if there are ground obstructions/collisions with the tables or trackers, lower the ground image in the Z coordinate just enough so that it clears everything once the tables have been set to the terrain-specific elevations. It will then still capture most of the impact of the terrain. You can run the check for interpenetrations tool to see if it has been resolved.
It is often the case though that there may be irregularities in the terrain data, for example if you are looking at existing terrain conditions for a tracker system, the tracker may extend over odd and irregular areas of ground terrain since they are so long. If your site is small the number of instances are few, you can edit the ground terrain directly. If you have a large site and many instances, lowering the entire ground image may be most efficient.
Can we add the mptor gap and piles gap in trackers ?
in Problems / Bugs
Posted
Increase the number of modules to account for the correct total tracker length or approximately close. The difference in shading calculations with and without actual gaps is not significant.