

dtarin
-
Posts
777 -
Joined
-
Last visited
Posts posted by dtarin
-
-
Have you tried the different filling schemes under auto distribution? You can also set strings manually. I think if you find something sufficiently close, it will be good enough. I am not familiar with sketchup, but looking at that scene there, you can probably do it in the 3D scene creator in PVsyst easily with zones, and then set as tables as you want.
Also, if you do have a table, PVsyst in the module layout method there will still fill module by module, whether it is a table or individual module. I am not sure it will make a different with this shading method.
-
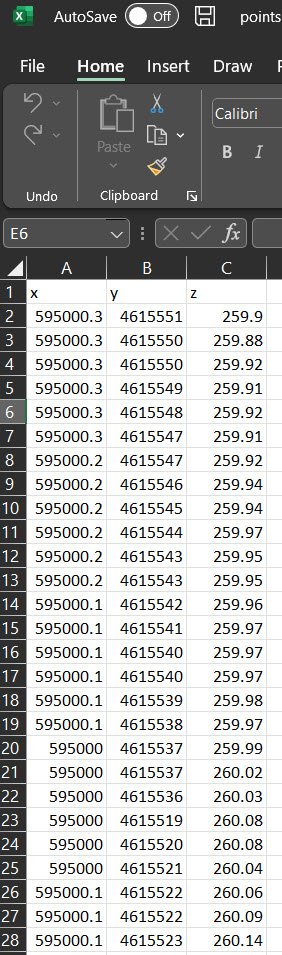
If you are importing ground data in x,y,z format, you need to have three columns with x,y,z data respectively, and one line as a row header OR no line header. It must be comma-separated in a .csv file. I would guess you have a different delimiter variable in your file and it has ignored all of the data.

-
100 is a good default number. For a very large site, selecting higher is fine too, but it comes down to your system size. Shading losses most of the time are higher in the unlimited sheds model compared to a 3D scene (I have never seen it less but maybe in some cases it could be), so that is not unusual.
Nb trackers is the number of rows. The unlimited sheds method excludes edge effects for the most part and assumes the rows are infinitely long.
-
Unless someone here has already reached out to PVGIS and received an answer for this question, my guess would be no. Most (all?) satellite TMY data will not. Ground measured data can take horizon into account. PVGIS has a separate tool for determining horizon losses. They are pretty responsive (at least in my prior experience), give them a shout.
-
6 hours ago, Michele said:
Hi dtarin,
thanks for your reply!
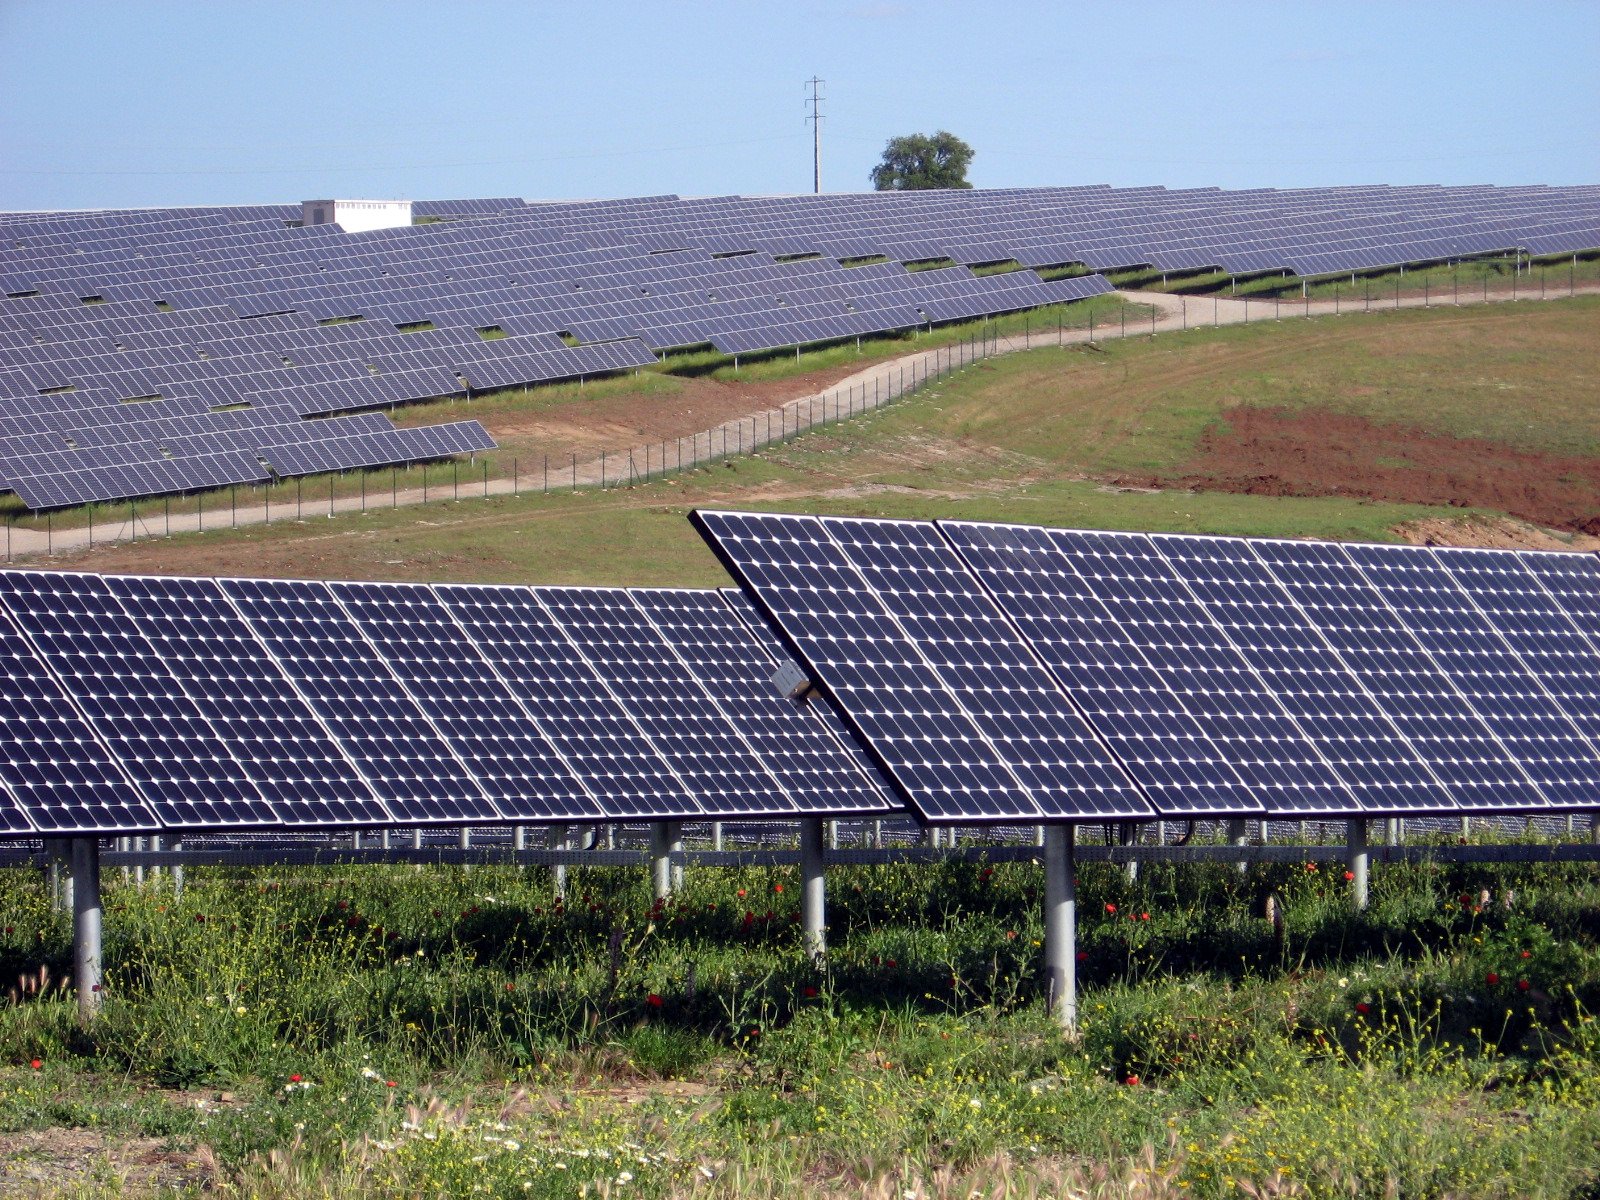
I tried just to be sure but nothing changes...For a 20 MWp plant, simulating horizontal trackers in backtracking with a 3D scene or not (unlimited HSAT) doens't make any appreciable difference in results. This is because the whole shading factor table for beam will be always zero in both cases thanks to the (ideal) perfect backtracking and because the edge effects may be neglected for medium/big plants.
I see, yes, if perfectly flat, there will not be. In the image above, I thought your "LOT 1 - Flat" was the "flat" case you were considering. It looks like those modules are at different elevations (if even by a little), so there would be an electrical effect loss. There really are no completely flat sites, and ones that are very close will still have some electrical effect depending on the design.
-
How many of these locations where you need to fill are there? The answer can lead to two more questions:
1) What is the impact on the shading loss? Is it material? Have you captured shading losses sufficiently without filling these areas? If your site is very large (100s of MWs) and the number relatively low, it probably wont matter much.
2) If the number is low, a manual add would not be very time consuming. Create a block of individual trackers at the pitch, then copy/paste into the areas, and giving it an exact pitch spacing from the adjacent tracker.
This doesn't answer your question on development queue, but more to provide an alternative perspective/work-around.
-
Also, simulate your "Flat" scenario according to strings. It looks like you have modeled it with linear shadings, so this isn't a good comparison.
-
What does the module strings table look like? This table confirms the near shading loss. For confirming electrical loss, run the shading analysis in the shade scene and it will graphically show the electrical effect losses, can help get an understanding of why your elec. eff is high.
-
For the extruded polygon, it is allowing the edit of heights when multiple polygons are selected. For example, when opening the equipment list, the properties of the polygons cannot be edited. It would be great to allow height to be edited in this field.
-
Never mind, I see, maybe set to 12 and 36 inputs for workshop 1
-
Pull configuration 3 out, it is not sharing any inputs? Try having 15 inverters with MPPT share, and 5 without, in which the 5 are for configuration 3 - workshop 3
-
Each zone receives its own definition for the table size, so create a zone with table dimensions A, then create zone 2 and go to field properties and create second table dimensions.
-
I would answer yes to your question but with some fine print. For FT as you say, PVsyst can be set to use different averaging intervals to arrive at up to 8 distinct orientations for monofacial simulations. Maybe this could be lifted since we can have unlimited sub-arrays now? For bifacial systems, a single orientation is needed. This is true for both FT and SAT; however, SAT doesnt have the same checks that FT does. Placing two tracker arrays at different azimuths does not activate any errors when it should.
When placing trackers on terrain, the Z coordinate does not matter for bifacial. The tilt is calculated as an average automatically, and trackers are placed at the same azimuth. If you place trackers at a different azimuth, the software will not detect and it will select the last change detected (or something to that effect). There are some things you can do to have PVsyst detect the orientation is incorrect, but it will always just select one of the arrays and then let you proceed, which that in itself is also incorrect. I have not tried multiple azimuth tracker systems from PVcase, though, so not sure how PVsyst handles it. We dont see those in designs though so probably not worth looking into.
In any case, the different with SAT is that 1) tilt is calculated automatically as an average 2) they're always at the same azimuth, so bifacial has no problems. There is a single orientation used for the calculations. With FT and terrain, you can use bifacial, but you must average it out to a single orientation.
-
This seems to be a normal occurrence for high irradiance, low temperature conditions. You want to look at EArrayMPP as this is the energy going into the inverter. EArrayMPP - InvLoss = EOutInv. My understanding is that the MPP point results in higher production than what EArray is calculated at during these conditions (high irradiance, low temperature), and the former is what is used for inverter output calculations. PVsyst perhaps can comment with more detail as to what EArray in physical terms.
EArray - Effective energy at the array output
(taking inverter operating point displacements into account - not represented on the Loss diagram)
-
Yes. Yes, along with setting the correct pitch and height from ground. You also have the option to define a center gap if the tracker has one.
-
Hello,
A couple of suggestions/requests here:
- Add relative humidity as an output variable in the 8760
- Allow extruded polygon height to be edited from the equipment list
-
Hello,
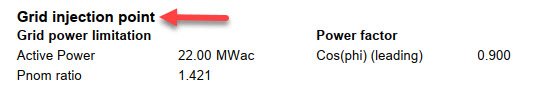
When using power factor and applying a grid limitation, the pvsyst report makes no indication of where the limit is applied. We are thus unable to verify how it was implemented when reviewing a report. If a user selects account as a separate loss, this loss always appears after the AC losses, but the amount will vary depending on if it is applied at the inverter or at the injection point.
- One suggestion is to rename "Grid Injection Point" or "Inverter Injection Point" depending on the selection (see photo)
- Another, possibly in concert to the above or in place of - Re-position the unused energy loss (due to limitation) according to the appropriate selection; at the end of the waterfall for grid injection point (aka point of interconnection), or after the inverter losses for inverter level limitation
-
The total ohmic loss is a single loss, the sum of the weighted averages. This would correspond to a single transformer loss, the sum of the transformer losses. If you wish to use three then use the straight average. My preference would be to use the former. Run both and check the difference
-
-
Either is correct, you can enter 3 and average the no-load and full-load loss, or add them into one. Since you have combined the MV ohmic losses into a single loss, I suggested to do the same with the transformer, perhaps a bit more accurate instead of averaging them, since pvsyst is using the total power into the transformer
-
3 minutes ago, jonipa said:
As an example, if I have two parallel circuits with 3 transfos in series each, and the total power loss of both circuits is 0,6% I should enter and average loss of 0,1% for each transfo, right?
Thank you very much.
Your total power loss is 0.106%. The first segment carries 1/3 of the total power. The second segment carries 2/3s. The final segment carries 100%. That is total loss for the entire plant. Enter that for the MV ohmic loss %.
-
Calculate the weighted average and enter 1 transformer. If you have the no load and full load losses for the transformer add them together when entering 1 transformer
-
Thanks, Michele.
-
If the user selected a backtracking pair under the backtracking management menu prior to computing the initial shading table, is there still a possibility for this to occur? Typically I do not generate the shading table from the shading menu, and instead have it compute during the simulation process. Is there any difference? One last question, what is the approximate error in % you are seeing?
How to design system with no grid injection
in How-to
Posted
I don't quite follow what this means. What is the minimum grid capacity and actual grid capacity? I can create a "connected to grid" simulation with a single module.