
André Mermoud
-
Posts
2075 -
Joined
-
Last visited
Everything posted by André Mermoud
-
As I understand, this seems to work exactly like a storage integrated in your system. The only difference is the battery efficiency, including the charger and discharging inverter losses. You can define high values for their efficiencies. I don't see what you mean by "no load time". In your case, the cost of the battery (purchase + wearing depreciation) is replaced by the rent fees.
-

Connecting PVsyst simulation results to a local API
André Mermoud replied to Mouad's topic in Simulations
We don't consider offering an API for PVsyst in the near future. -
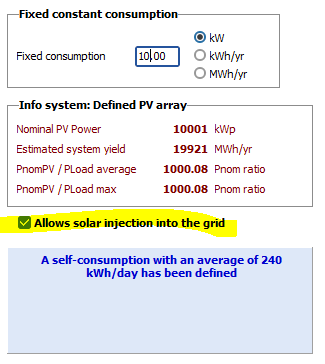
In the version 7.2.17 of PVsyst, we have implemented the option of forbidding the grid reinjection when self-consumption is used, without storage. This option appears in the User's load definition dialog: In the Loss diagram, this will result in a n "Unused energy" loss.

-
Inverter Huawei - Notification before simulation
André Mermoud replied to yajmarc's topic in PV Components
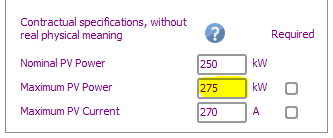
This comes indeed from optional parameters sometimes defined in the inverter's specifications: If the case "required" is not checked, this is just an advice of the manufacturer. Don't care. It doesn't make much sense to impose such limitations on the PV array, as limits are managed by the inverter during operation. If the case "required" is checked, this is a contractual requirement: if you define a system overcoming this requirement, the warranty may be dropped. In this case PVsyst forbids this configuration during sizing.
-
Sorry, I don't identify the apparition of this fleeting little mark. It is probably a Windows artefact that I have never noticed. But this has nothing to do with the indication that this case is checked or not, which appears as a blue-background check mark. However it is indeed not always possible to get the default value of Rshunt (depending on the other parameters, especially Rserie). And this is not really necessary, often a higher value (1000 ohm or more) is more suitable as it increases the RSMax value. See the help (little blue questionmark).
-
Sorry, I wrote a stupidity. I did not find the dialog for the HV line up to the grid injection, as it only appears when you choose the HV transformer in the combobox. I was really aestonished of that, I did not remember that I had programmed this as such (a long time ago).
-
I don't understand well what are your power stations, and what you mean by "PS1-PS2", PS2-PS3" and "PS3-SET". If these are transformers in series, PVsyst only treats two stages, i.e. a section "Inverter => MV transfo", and a section "MVTransfo => HV transfo". The wire between HV transfo and Injection is indeed not taken into account (this is a weakness of PVsyst). In this case the losses (in percentage) should indeed be added, as they concern the same power or energy flux. Now when you define 3 MV transfos as you did, this means 3 circuits "Inverter => Transfo" in parallel. In this case the losses have obviously to be added in terms of energy (kWh). And the loss in percentage will be the total loss in energy, divided by the total transferred energy. Please carefully read the Help "Project design > Array and system losses > AC ohmic loss from inverter to injection point" And also "Project design > Array and system losses > External transformer losses"
-
PVsyst crashes when loading a "grid unavailability profile"
André Mermoud replied to julmou's topic in Problems / Bugs
Sorry, I tried many manipulations, and I really can't reproduce this problem. Please explain exactly what you do before the crash, and send a screencopy of the crash conditions / message. And send us your full project, as well as the concerned CSV file (support@pvsyst.com). -
Suggestion : Add "Export function" (Components database)
André Mermoud replied to sunbi's topic in Suggestions
The database of PVsyst is meant for internal use within PVsyst. You have indeed a tool for managing the components that you are using yourself. We don't intend to develop a feature for exporting big parts of this database. -
Odd Numbered Strings in SolarEdge Architecture
André Mermoud replied to jack.keane's topic in How-to
Defining one only module in an optimizer belonging to a string of optimizers with 2 modules in indeed not possible in PVsyst in the present time. There is no workaround. -
You don't tell which Storage strategy you have used for this result. Probably a self-consumption system. In this mode, you have a user's consumption that may be satisfied either by the solar resource, or from the grid, according to the PV availability. It is quite normal that if the solar resource is not sufficient, the energy drawn from the grid is superior to the energy provided to the grid.
-
Sorry, this strategy has not yet been implemented in PVsyst. We cvonsider doing this in the future, but we don't know when. I don't see any way of doing so with the presently available features.
-
Yes sorry: the label has been displaced. The units are indeed % of PNom
-
You are right, this is a really necessary development in the present time. This is on our roadmap, but I don't know when we will have the possibility of developing this feature. Probably several months. This requires some new parameters definitions in the controller, and to analyze all the converters of the database for identifying which ones propose this feature. Then we will have to implement this in the simulation.
-
Loss diagram not displayed properly in certain configurations
André Mermoud replied to julmou's topic in Problems / Bugs
Thank you for the information. Yes we now this problem, it is on our roadmap since some time. However knowing how to reproduce it is very useful. We will correct this in a future version (perhaps not the next one). The management of the loss diagram is really a headache ! -
Bug with subfield, string configuration and 3d shading
André Mermoud replied to Pierre-Vincent's topic in Problems / Bugs
I see that you have defined a sub-array equipped with SolarEdge and a mixed orientation. This association is not useful, as with SolarEdge each string is considerd independently. You should define 2 different subarrays, one with each orientation. After that, you willbe able to associate any combination of strings (subarrays) to each physical inverter. This association has not been foreseen, and is probably not well treated in PVsyst. PVsyst should not allow it. -
The case of the trackers (as a function of the latitude) is quite different than the case of the sheds. For trackers with N/S axis, at first sight, the "optimal" pitch should not be directly dependent on the latitude. Now in your studies, you should define what final indicator you are considering, what you want to optimize and which constraints you have. The indicator may be the total Energy yield, the system efficiency (with respect to the occupied ground), the price of the kWh, the total investment, the real seasonal electricity needs, etc. Each of these criteria will lead to different optimal decisions. These criteria should be your first choice. After that, the optimization is multi-criteria. The conditions may be the price of the PV modules, or of the full system, the price of the occupied area, the investment, the price of the sold electricity, the grid power limitation, the real needs of energy, etc. As an example, if the terrain availability is not a problem, you can increase the pitch for limiting the mutual shading losses. If the module price is low, you can accept more shadings or misalignment (i.e. accept more losses). If the needs are mainly in winter, you may prefer higher tilts and larger pitch, etc... Each situation is different. The only way of performing such studies is the simulation.
-
For the Mismatch loss, I have indeed implemented that for the next version 7.2.17. The mismatch will be null for one module in series, and half the default value for 2, 3, or 4 modules in series. Either for optimizers inputs, and for any other subarray (i.e. Micro-inverter) For the Input circuit resistance, it is not straightforward to decide that the inverter is directly mounted on the PV module when there is one, two or three modules in series. . Therefore we let the user define a null-resistance if this is the case. For the interconnexion of several micro-inverters in a single bus, the problem is not quite simple. If you decide a same section for the whole bus, and a distance Lseg between inverters: let us define Rseg = the resistance of one segment between two inverters. The loss will be Ploss = Rseg * ( I² + (2*I)² + (3*I)² + ... ) etc. = Rseg * I² * (1 + 4 + 9 + 16 + ... ). Now in the PVsyst definitions, you have one wire per inverter, the total loss is to be accounted for the average length. Therefore the total loss is PLoss = Ninv * Raver * I² Finally: Raver * NInv = RSeg * (1 + 4 + 9 + ... + NInv²), from which you can easily calculate Raver to be put in the PVsyst tool. NB: as R = Length/Section, and Section is constant, you can replace R by Length in the previous expression: Laver = Lseg * (1 + 4 + 9 + ... + NInv²) / NInv
-
Sorry, we don't know the LisePV software.
-
The "Module Layout" is a copy of the real 3D system, shown as a 2D representation. In this framework, PVsyst attributes a new "matrix" name to each table: it tries to identify lines and columns in this 2D representation, and redefines table names according to this matricial disposition. Each table may be seen using the original shading object in the 3D scene, or this matricial redefinition. You have the choice of seeing one or the other of these names. Note that if the 3D object is an array, its 3D name will be the same for several tables, and PVsyst has to complete it with "Row#1, Row@2, ...) In your case, the name in the combobox is the name of the 3D object, when the name on the plot is the Module Layout matrix name. The list of inverters is defined according to the sequence in the SubArrays. In the present time PVsyst doesn't identify "physical" inverters (i.e. No of inverter and No of MPPT input), but only deals with "MPPT inputs". This will be improved in a next version.
-
Hourly energy production results stops before sunset
André Mermoud replied to raul.martin's topic in Problems / Bugs
Please carefully check your management of the DST (Daylight Saving Time). As most of the Climatic data files, PVsyst doesn't take the DST into account: the Summer time is shifted towards Winter time. It seem that you are waiting for a production during "your" Summer time, when the PVsyst simulation works in Winter time. -
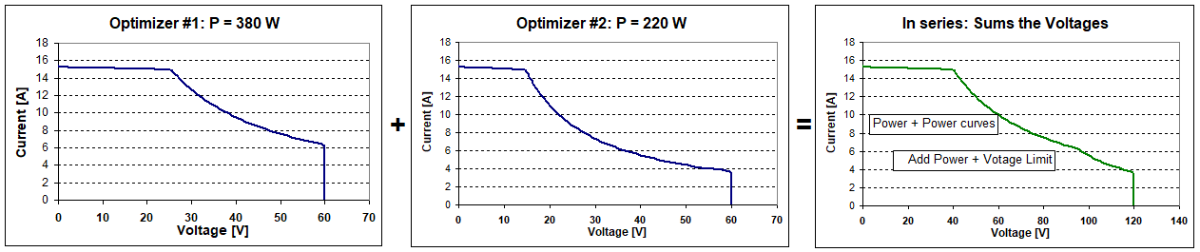
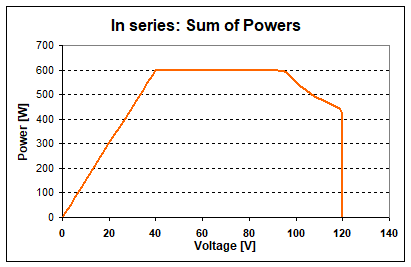
When connecting SolarEdge optimizers (Buck/Boost) in series, you have to add the voltages. Now if you have different powers (shaded optimizer), the power curves are added down to the voltage limitation of the higher power optimizer. Below this current value you add a portion of hyperbola, and the voltage limitation value: this leads to a little disruption in the curve: Drawn as power, this becomes: There is indeed a degradation at high voltages. This is the reason why SolarEdge imposes a minimum number of optimizers in series (for attaining the fixed input voltage of the inverter), but also advises to foresee one or two additional optimizers for ensuring a good prevention of the shading effects. This is mentioned in the help.
-
You are right: it is not very logical that the battery is used when there is sufficien PV power for feeding the user needs. However if you think about the real system in operation: when the battery is full, it has to be disconnected. This means that the PV array is directly connected to the user's circuit, through the Power converter. If the user's needs are lower than the PV production, how does the MPPT-DC converter behave ? In a Grid-connected system, the Power limitation (which is a fixed value) is achieved by a displacement of the operating point on the I/V curve. A MPPT-DC converter should be able to detect the output needs level; probably an overpower (with respect to user) will increase the output voltage. The device should be able to detect this voltage increase and displace its operating point on the I/V curve accordingly, Which MPPT converters are equipped with such a control system ? I don't know ! When I wrote this simulation behaviour (25 years ago! ) I was pretty sure that such a control doesn't exist. This is now perhaps possible (this should be mentioned on the datasheets), and perhaps the simulation should be able to treat this case.
-
String and Central Inverter Clipping Losses.
André Mermoud replied to vishalbhavar's topic in Simulations
This probably depends on the PNom definition as a function of the temperature. - This may be different in both cases. You don't provide the values of PNom and PMax of each inverter and the corresponding reference temperatures. - It depends also on the way you have defined the inverter's temperature during operation in the dialog "Energy Management". -
Thank you for this information. There is indeed an error in this calculation, we have to correct it for a future version (probably V 7.2.17). However this tool is purely informative, this doesn't have any incidence on the battery's behaviour.