Search the Community
Showing results for tags 'losses diagram'.
-
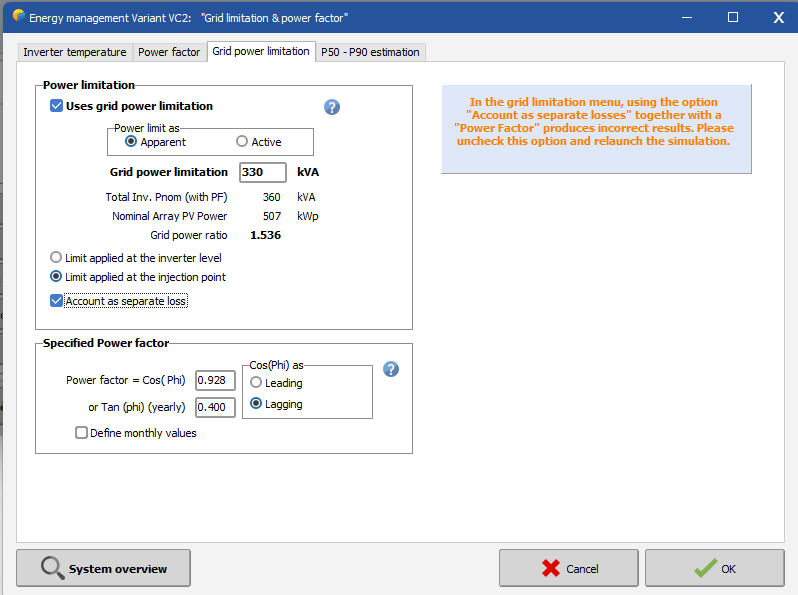
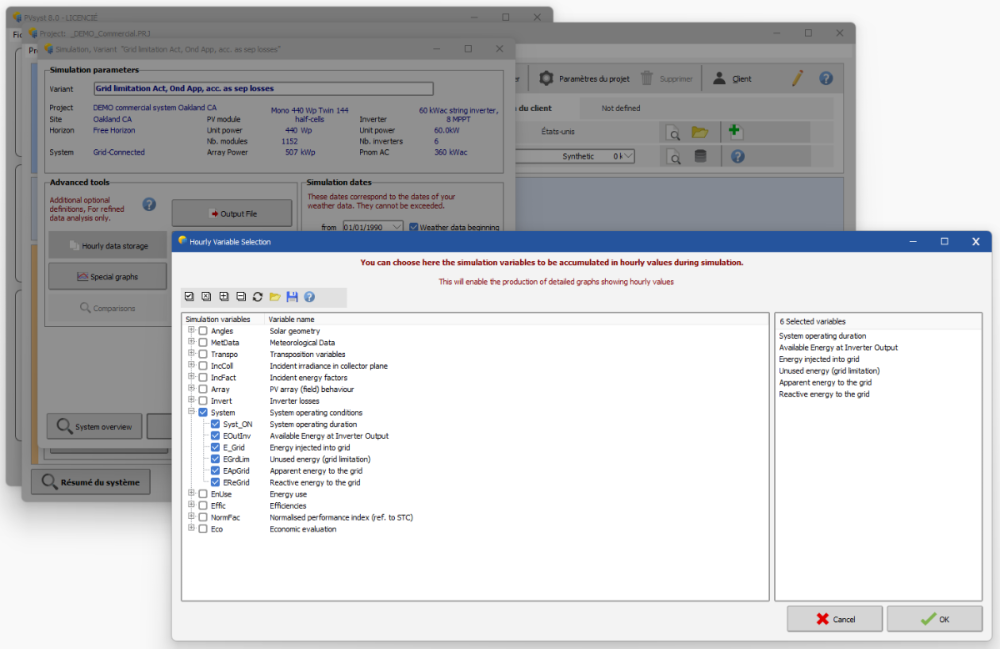
Grid Power Limitation: The option "Account as separate loss" in the menu grid power limitation may pose a problem when used together with a power factor. However the loss diagram and .csv simulation output are not affected. Hourly Graphs may be affected upon context: When the simulation variables EReGrid, EApGrid and EGrdLim are not explicitly saved, it can trigger wrong calculations of the reactive and apparent energy in the hourly plots (too high values for both). Saving those variables in the menu "Advanced simulation / Hourly data storage" solves the issue: Until the option is fixed in a future version, the software will display a warning when both options are used together.
-
- grid power limit
- power factor
-
(and 1 more)
Tagged with:
-
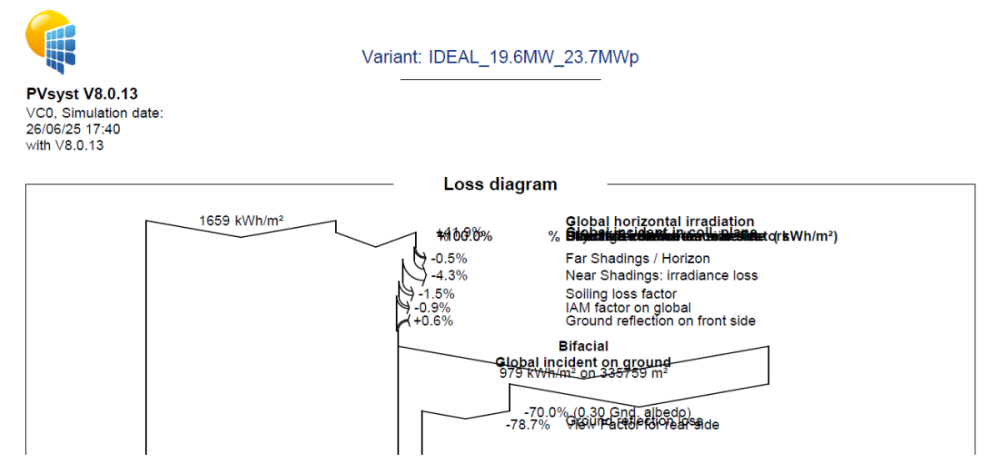
Hi PVSyst Support Team, The loss diagram in version 8.0.13 is printed with errors. Please check it. Kind regards, Carlos
-
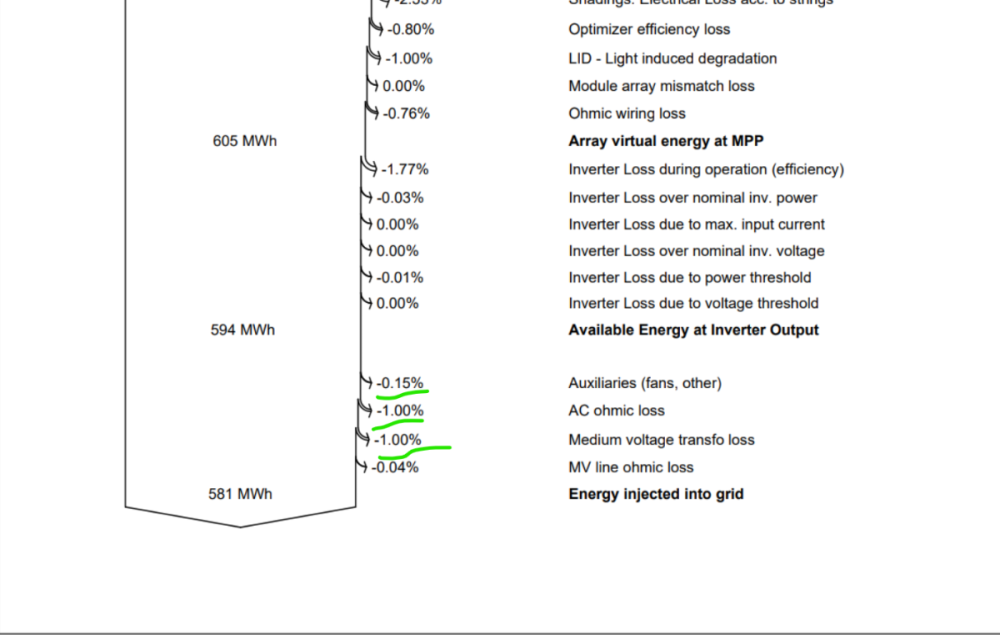
Can we have the option to input or limit AC ohmic losses and MV losses to a certain percentage? Example- In below attached snip, we always try to limit the Auxiliaries to 0.15% and AC ohmic and MV transfo losses to 1% for every project or varient. We have to run multiple simulations while changing the values in Detailed losses section.
-
Hello forum users, i am doing some research on the various Horizon sources available. i have chosen some meteo data i have used for previous projects and i would like to do a series of analysis for each one of them using: 1 - SolarGIS Horizon profile 2 - Meteonorm Horizon (from PVsyst web sources) 3 - PVGIS Horizon (from PVsyst web sources) my goal is to: compare the "far shading losses" and the Horizon line drawings considering the different Horizon data so to have a general overview of the differences between the Horizon datasets; of course my research will also include the study of the manuals and theory behind the definition of the Horizon profile provided by each one of the three Meteo database. i would like to raise a couple of questions: how far has to be an obstacle to be actually considered in the far shadings? considering the high dependency of the horizon from the exact geographical coordinates, are there any suggestion on the horizon profile choice regarding big PV plants? has someone of you undergone some similar studies? have you found some interesting results? also, considering point 2, a question for the software developers: are you considering a possible software update that would allow the user to set different horizon profiles, perhaps linking a single profile to a single subfield? thank you very much in advance for your contribution! Davide
- 8 replies
-
- horizon
- meteo data
-
(and 8 more)
Tagged with:
-
The meteonorm 8.1 database has hourly values of ambient temperature. Does PVsyst calculate the Cell temperature using the ambient temperature value at the specific time during the simulation or it uses the monthly average for all days? I mean does it calculate the cell temperature only during daylight or it merges all heat transfer throughout the year, day and night.
-
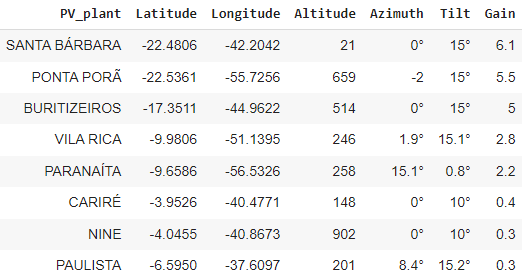
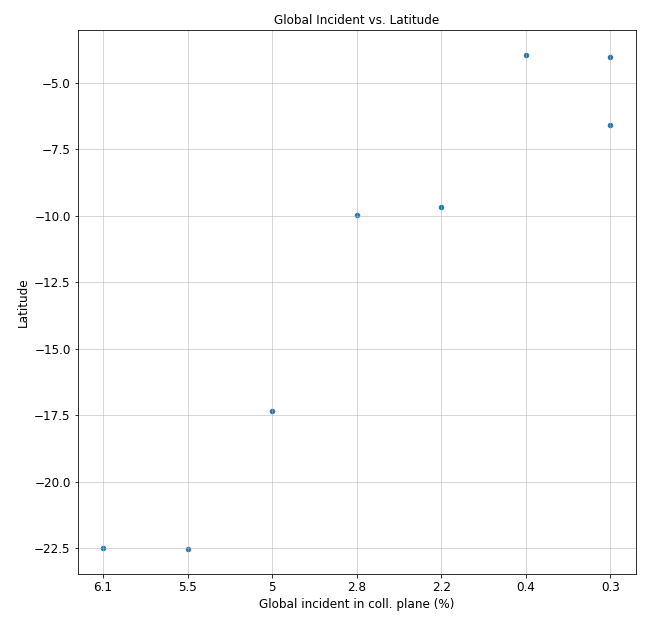
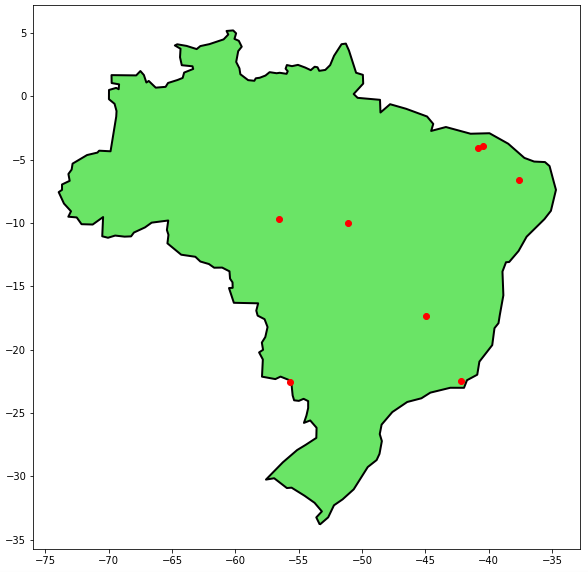
Hello, everyone. After running a few simulations on several sites of the Brazilian soil, I realized that the Global incident in Coll. plane from the Loss diagram was very different on each simulation. Since all of my simulations have fixed sheds, not trackers, I started wondering why in some cases I got over 6% Gain on Global incident in Coll. plane and others I got only 0.3%. Even if I used the optimization tool for tilt and azimuth enhancement, the Global incident in Coll. plane would not change significantly. The only correlation I could find for this behavior was with the Latitude: The closer I get to a 0° Longitude, the smaller the Global incident in Coll. plane is. This trend is clearly shown in the following table and scatter plot: The column 'Gain' represents the Global incident in Coll. plane value taken from the simulation's Loss Diagram For a visual reference of where those simulated plants are located: Given all that explanation, I have some questions: Is my interpretation correct and the closer I get to a 0° Latitude the smaller the gain for Global incident is? Can you recommend me articles that explain this behavior, either on PVSyst or a more general sense? Why couldn't I get a significant enhancement of the Global incident in Coll. plane when I used the optimization tool (for tilt and azimuth)? I hope you can help me with those questions, and I'm available for further discussions. Best regards.
- 1 reply
-
- global incident in coll. plane
- losses diagram
- (and 2 more)


