
André Mermoud
-
Posts
2075 -
Joined
-
Last visited
Everything posted by André Mermoud
-

diffuse shading factor for fixed tilted array
André Mermoud replied to pvsj's topic in Shadings and tracking
For a tilted plane, the isotropic diffuse component is indeed evaluated as the irradiances coming from the "orange slice" between the collector plane and the horizontal plane. The result of this integral may be calculated explicitely, it gives DiffPl = DiffHor * (1 + Cos(tilt)) / 2. This evaluation is done in the transposition model (see especially the Hay model). Now the shading factor is a corrective effect due to the shading of objects. If you don't have shading objects, you don't have any shading factor. -
The albedo effect corresponds indeed to what you would see across a window. However this would correspond to a vertical PV plane (façade). The albedo contibution, as "seen" by the collectors, is proportionnal to (1 - Cos(tilt)). This means that: - for a vertical plane (Tilt = 90°), the contribution is 100%. - for an horizontal plane (Tilt = 0), the contribution is = 0. - for a 30° plane, it is 1 - 0.866, i.e. about 13.4%. - and for a 15° plane, it is reduced to 3.4%. NB: if you have a row-like (shed) arrangement, only the first row "sees" the albedo. The shading factor on the albedo component will be (n-1)/n (n= nb of sheds).
-
Nothing prevents you to run PVsyst V5 and PVsyst V6 in parallel on the same machine. Simply the data structures are not the same: you cannot use files created with the version 6 in the version 5 (but the inverse is possible: downwards compatibility). You can even run several Versions 6.xx simultaneously on the same machine. The installation process gives you the choice of "Parallel Install". However be careful: if you share the same data structure, some files created using a recent version may be in error with older ones.
-
OK. This line "Orientation #1" is irrelevant, and should not appear on the report. This is indeed a mistake. I will correct this for the next version 6.36.
-
I can't understand that. Please check your affirmation. And if the "error" persists, please give a full explanation of what you did or are doing, where the error appears, and join a screenshot.
-
Some answers to these numerous questions. 1. The help file still refers to functionality in the 6.24 version, such as the save mode - eg. "Mode and File definition page" In the latest version there is no option for copy of monthly tables after each simulation. This is an error in the Help file: this feature has never been developed. I probably intended to do so when writing the help. 2. In the save mode, there is a radio button option for "Save" or "Save As" - I assume this is to over write or save new VCi files during each simulation - this option box keeps disappearing. This is only visible when it is pertinent, i.e. when you create simulations on the basis of different existing *.VCi files. This allows choosing if you want to overwrite the source VCi file. 3. The Results variables specification tab - These variables doesn't seem to be updated in the BatchResults CSV file. This would be aestonishing as it is the basis of the batch mode, used by everyone. We will check. 4. In the Meteo and Save Mode tab, "Create hourly files" - It is not clearly shown, but this option seems to inherit the output file setup on the simulation start screen. Thus the "hourly files" can actually be any output file, including monthly values. - Could you indicate that in the help file? When specifying to create "Hourly File" in the Batch mode, you are prompted to define the output file. Here you can specify any kind of output file (hourly, daily or monthly). I admit that the "Hourly" label is not quite correct, but it corresponds to the usual use ogf the output files.
-
How is pv-module tolerance incorporated in PV-Syst
André Mermoud replied to Soldnerkugel's topic in How-to
If in the "detailed losses", page "Module Quality Loss", you have checked "Default", the Module quality loss factor will be reevaluated at the beginning of the simulation as a function of the actual PV module's parameters. -
How is pv-module tolerance incorporated in PV-Syst
André Mermoud replied to Soldnerkugel's topic in How-to
Thes values are used for the default value of the "Module Quality Loss" parameter. See our FAQ How to define the "Module Quality Loss" parameter ? -
Installing 875 kW on an area of 4047 m2 is indeed problematics. If installed horizontally, this would mean collectors of 21.2% efficiency, without any intervals between them. Please see our FAQ In sheds arrangement, which power can I install on a given area ?
-
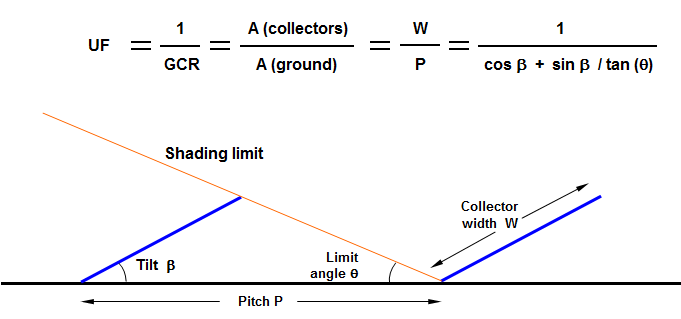
The installed nominal power (STC) is directly proportionnal to the collector area: Pnom [kWp] = Coll. Area [m2] * Effic at STC [%] / 100 Now the Utilization Factor UF (= Acoll / Aground), which is the inverse of the Ground Coverage Ratio (GCR), is calculated according to: Utilization Factor We can notice that the more relevant parameter is the collector tilt: with 30° tilt you can install only 40-50% of the available ground area, when with 4° or less you can install more than 80% of your ground area. This is very weakly dependent on your limit angle. UF as function of collector tilt Therefore when the area is limited, you are always advised to put your collectors as horizontal as possible (with the only limit of the soiling problems). Moreover, this results in much simpler support's mechanics, less wind sensitivity, lower weight, etc. This allows also to define higher shed's width, i.e. more strings in the width of the shed. This drastically limits the electrical shadings losses. In most cases, taking the shading effects into account, the overall energy loss will be less than 2-3% with respect to 20-30° sheds.

-
The TMY2 and TMY3 formats are very specific and well-defined formats (see http://www.nrel.gov/docs/fy08osti/43156.pdf). PVsyst has established the import of files corresponding exactly to this format, and this works quite well with the files provided by the NREL. But it is not guaranteed for other sources. Now we have proposed a "PVsyst format" for the meteo data several years ago (see a description in the help). 3-Tiers has agreed to propose their data in this format when requested. Please ask them. By the way you can probably import your data using the general tool "Databases > Import meteo ASCII files" (and Press F1 for getting the procedure).
-
Your comparison with a window is correct for a vertical plane. However the additional yield of the albedo goes with (1-cos(tilt)). If this is 100 % for a vertical plane, it is only (1 - cos(30)) = 13.4% for a 30° plane, and 6% for a 20° tilted plane.
-
I don't understand what you mean. The tiles cannot bring any albedo contribution to the PV modules here, as the PV module doesn't "see" them. In a general way, the albedo is proportionnal to the cosinus of the corresponding incidence angle. Therefore any radiation coming from a surface in the plane of the array will have a null contribution. On the other hand, the electrical yield of a string of modules is lead by the poorest module (the less irradiated). Therefore for being really efficient, a reflexion should be homogeneous on a whole module string.
-
Array MPP Below Inverter MPP Range?
André Mermoud replied to bradley_borrego's topic in Problems / Bugs
Yes, this is the way of running of the PVsyst simulation, and probably of most inverters. I don't see what could be the meaning of the Vmppmin specification if this were not the case. If you choose "Cut" instead of "Limitation" for the behavior at VmppMin/Max, the inverter will stop. -
The site, country, region and used Meteo data are already mentioned in the header of the output CSV file. With the files used and dates, the simulation header and date, these informations completely define the project's properties and simulation conditions. We could of course put any other parameter. I don't see why the Latitude and not the plane orientation, installed power or other.
-
How to position elementary shading objects on a scene
André Mermoud replied to sailerthomas's topic in Shadings and tracking
This terrain description tool is a very new feature. We have still to refine some procedures with it. We will namely think about this problem. In the next version 6.35, to be released very soon, when watching the scene in Plane view you will have the information of the altitude of the terrain, making easy to position your object. The automatic positioning of all kinds of objects will be for a later version. -
The discrepancy between Simulated and Measured data may be due to: - An error in the measurements, - A misrunning of the system, - An error in the simulation program - An error in the design parameters used in this simulation, - An error in the input meteo data (either measurement or importing in PVsyst). Nobody can anwer your question without more information. You have to check all these possibilities. The better way is to analyze hourly data discrepancies. However PVsyst is used by tausends of people. I don't think that a simulation error is very probable...
-
The OND files generated by versions superior to V6.26 are indeed not readable with previous versions. This is a problem without direct solution. But it is anavoidable when some new information has to be added in the file. You should ask SMA for creating an OND file with a version < 6.26. For the next version 6.35, I'm preparing the opportunity of creating files compatible with old versions. But this will not solve your problem.
-
In principle files of V5 should be readable in V6. Perhaps there is another problem (for example a missing file). Please ask your client to use "Files > Export project" in the main menu for ensuring that all the required files are present. When installing the V5 on your computer for the first time, you can use the program during 15 days. If you really need the V5, you can ask for a temporary license code to our administration.
-
Multiple Orientations - Low Production?
André Mermoud replied to defreight's topic in Problems / Bugs
We discovered indeed an error in the simulation of systems with Mixed Orientations in the versions 6.33 and 6.34. This will be corrected in the next version 6.35, to be released very soon. -
The "Overload loss" is the not-produced energy, sum of the differences between the available Pmpp and the effective limited power accepted by the inverter according to Pnom when limited. This value is computed at each simulation time step. It is not proportional to the power ratio of course, as it is a non-linear effect: when diminishing the Array power, only a few days/hours will be affected by this threshold variation. Please see the histogram in the tool "Show optimization" (System design dialog), and play with the power ratio for understanding the phenomenon.
-
Energy Production Discrepancy -- V6.32 to V6.33
André Mermoud replied to Dan Nicksy's topic in Problems / Bugs
We discovered indeed an error in the simulation of systems with Mixed Orientations in the versions 6.33 and 6.34. This will be corrected in the next version 6.35, to be released very soon. -
If you specify Uv = 0, the wind velocity will not be implied in the simulation, whatever your choice for the Uc value. You can consider that when putting Uv = 0, the wind effect should be included (as a constant average value) in the U value.
-
I don't understand well what you are doing. Please take your project. Run the simulation with one meteo data file (for example what you call "My monthly meteo is 101.5 kWh", but don't define frome where it is taken). Then just change the input meteo data file in your project (for example meteonorm). Run it again without changing anything. The resulting yield should be fairly proportionnal to the input irradiance. Now if there are big discrepancies these may be due to a very bad hourly meteo file (for example a time shift). Please carefully check your meteo file using "Databases > Meteo tables and graphs > Check data quality", and here press F1 for detailed explanations.