
Michele Oliosi
-
Posts
793 -
Joined
-
Last visited
Everything posted by Michele Oliosi
-
Yes, that is indeed the case. When E_Grid is negative it means that in total you are drawing power from the grid.
-
Converter Loss over nominal converter power: this indicates that for several hours in the year your DC power is higher than the AC nominal power of the inverter. Therefore you are suffering from clipping losses. To reduce this, either reduce the DC power by decreasing the number of PV modules, or use a converter with more nominal power. Unused energy: this indicates hat for several hours in the year your system has available electrical energy that is unuseable because the tank is full. This may be due to having oversized the PV system, which provides too much energy. But it depends on your design choices; you may for example try to ensure that the pump will always function by oversizing the PV system.
-
 We have found and corrected one bug in the following case: Create a variant from scratch Set a tracking orientation with backtracking (Set up the system – can also be set later) Add a shading scene: import it from a .PVC and click OK In the Near shadings window, when prompted with the choice, select “With backtracking” Compute the table: the shading factors will behave as if backtracking was not activated Simulate: results with too many shadings Recompute the table: the shading factors are now correct Simulate: consistent results Please let us know if the error does not correspond to the above procedure, especially the part in yellow. The error in the case above should be corrected in the next patch v7.2.17
 -
Hi, Thanks for pointing this out. As @dtarin mentioned, it may be a display bug, which we will investigate and correct asap. Considering other reportings of similar inconsistences in the shading tables with PVC scenes, there may be another issue with the default backtracking parameters. However these errors have been very difficult to reproduce, but we are working on them. @Aaron3707 If you can send us your .PVC and/or project at support@pvsyst.com that would help us a lot.
-
The Phi angle generally represents the rotation angle around the tracker axis. For a horizontal axis tracker, it is 0 when the tracker is horizontal, so it roughly corresponds to a tilt angle. The BT limiting Phi angle is the maximum Phi angle reached in the non-backtracking (i.e. sun-tracking) regime. If the sun gets any lower, the backtracking is activated. The Phi angle (without limits) means the Phi angle if there was no backtracking and there were no tracker mechanical limits. It can be higher than the BT limiting Phi angle or the tracker mechanical limits.
-
You should raise it above the number of trackers, here e.g. 6000, the exact number being unimportant. Else the simplification is going to be applied anyway.
-
Hi, this seems normal, if you are using the same number of modules each time. The advantage of East-West (tilted) systems is that they compensate the worse orientation by allowing you to fit more modules per ground area. Let us know if it checks out !
-
Hi, Actually we check the areas orientation by orientation. Hence, it is really important that the orientations are well assigned in the system part. First of all, you can choose either to use the mixed orientation on a single sub-array. Or split into two sub-arrays, one assigned to each orientation. - Mixed orientation: at the bottom of the system window, you should assign strings (using a scrollbar) to this or the other orientation. Make sure that the number of strings has been assigned correctly (wrt the 3D scene) - Subarray per orientation: be sure that the orientations are well assigned. This is done at the top left of the system window. If you still experience issues, you can send us the project at support@pvsyst.com, we'll be sure to check it out. You can export a project via the main window > File > Export projects.
-
Dear julmou, thanks for the feedback, it is noted.
-
How can influence the TMY weather data on the GHI/POA gain?
Michele Oliosi replied to EA2EQD's topic in Simulations
The conversion GHI / POA is not only geometrical, in that you have to decompose into different irradiance components: direct, diffuse, circumsolar, and so on. Each of these components will be transposed differently. Please read: https://www.pvsyst.com/help/models_meteo_transposition.htm Therefore, depending on the diffuse/global ratio, the transposition will yield different results. -
String and Central Inverter Clipping Losses.
Michele Oliosi replied to vishalbhavar's topic in Simulations
Yes we are aware of these potential differences when the sub-hourly variability of irradiance is important and the Pnom ratio/Grid limitation clipping is high as well. Thanks for the article reference by the way. We are presenting a model to take this into account at https://www.wcpec-8.com/. The idea is to implement it into PVsyst. -
Hi thanks for the info. Another post was already mentioning this kind of recomputing issues. We are investigating the matter but we haven't been able to pinpoint the exact issue yet. Regarding differences between unlimited sheds and 3D scene, yes, an example would be valuable. If you have such a project with an earlier calculation and a newer one, you can send it at support@pvsyst.com. It could be very useful for us in terms of tracking possible bugs. In terms of shadings there mostly have been bug corrections (as far as recent patches are concerned), hence the robustness has mostly improved. But the calculation itself has not changed. For complex tracking scenes, we have added the possibility to change the 40 tracker cap, above which the diffuse shadings calculation was simplified. This simplified calculation sometimes leads to incorrect results, whenever there are patches of trackers instead of a single homogeneous patch. If you are in such a situation, we recommend you check out this advanced parameter:

-
Please also check the time shift in minutes (open the meteo file). This may have an impact here.
-
Hi, The time step in PVsyst is taken in the middle of the hour. This means that for the 7:00 entry the sun is positioned at 7:30
-
Hi Michele, The ticket is assigned, but we are clearing some other issues at the moment. It may take a few patches for an update on this. The mismatch loss may change when there is aging (we use a statistical model to change the impact of aging on the mismatch). Apart from that and since it is such a small difference (0.01%) this is maybe due to some other edge effect of a rounding. I will keep an eye open about it.
-
Estimation of AC losses with micro-inverters
Michele Oliosi replied to julmou's topic in Simulations
I see it is not very practical at the moment. At the end of the day, the losses are ohmic losses, so a workaround could be to increase the length of the cable (here you could multiply by 6) to account for the higher current in reality (loss ~ RI^2). By computing the effective resistance of your cables you may get to a more accurate workaround. -
Module layout tool - input or modify layout data form Excel table
Michele Oliosi replied to borko's topic in How-to
Hi, Within PVsyst, the fastest way is the "Auto attribution" tool. Here are two options that you can try and consider: This first option allows you to put strings from a same MPPT on the same table: The second option allows you to put strings from a same MPPT on different tables and on the same "height":
-
Hi Jose, You can import the CSV by going to Databases > Known format. See: https://www.pvsyst.com/help/meteo_import_meteo_data.htm In the dropdown menu you should look for the correct source. If you cannot find the source, you can import the file as a custom format, so go instead to Databases > Custom file https://www.pvsyst.com/help/meteo_ascii_import.htm In the case of PVGIS I think the first option is not available I think, so go for the custom file.
-
Hi Stijn, That 14% seems quite correct. This is the gain you get from being on a tilted plane (22° tilt, 14° azimuth from your project) medium latitudes, with respect to being on the horizontal plane. I am not sure where the 0.7% value comes from, maybe this is the case at other latitudes.
-
Hi Arnaud, In the orientation management tool (3D scene : Tools > Orientation management) you can change the tolerance. If you reduce it you should have more average orientations. Not sure if that answers your question though?
-
Hi Arnaud, For E-W trackers (rotation axis along the NS line), yes it is possible to use the bifacial model. However for fixed dome-like EW structures, no it is not possible yet. Usually the bifacial gain is not very high, since the structure geometry reduces the light available on the backsid.
-
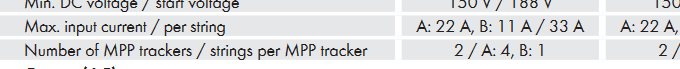
Hi, usually you would expect a mention in the datasheet looking like the one below with two MPPT input configurations (here A and B). In the example A corresponds to the one accepting more power (4 strings) and B is the lower power one for just 1 string.
-
How is the time shift correction factor calculated?
Michele Oliosi replied to Sergio Alonso's topic in Meteo data
The estimate for the time shift, when you import meteo data, is based on a comparison between the clear day model and the best days. You will find more details here: https://www.pvsyst.com/help/meteo_notes_timeshift.htm -
@dtarin I raised a ticket we will see what we can do. I believe it won't be that easy (trackers at different altitudes complicates some calcualtions) but it would be a good feature.
-
Hi Julien, In this case I think SMA provides the curves in a detailed way, you can check this document (see screenshot) on the same page you sent, "downloads" tab. For your second question I cannot answer, maybe someone else on the forum will be able to