All Activity
- Today
-

Array of trackers 3D scene defining N-S & E-W slopes
Michele Oliosi replied to JamesLenton's topic in How-to
@JamesLenton indeed, and glad that it worked ! -
@SPdesai Sorry it seems there was a wrong sign in my answer above. I have corrected it. The sign is positive. We are adding it back, indeed. Indeed, we expect that the rear POA sensor will not be shaded (mostly) by mounting structures or cables.
-
I don't why I posted this question on "suggestions forum", it shall be on "PV components" may be. My bad.
-
In PVsyst you have the possibility to import weather data from various weather data providers. If you are using the same weather data, indeed the Global horizontal irradiation will identical.
-

Array of trackers 3D scene defining N-S & E-W slopes
JamesLenton replied to JamesLenton's topic in How-to
Hi Michele, Thank you for the response. The solutions for running the simulation with high tilted axis worked, as did making fixed tilt array first with E-W slope before transforming to trackers. I suppose there will be inaccuracy in the bifacial modelling if we are using sloped trackers but PVsyst assumes a flat axis, no other way to solve that so no worries. Best, James. -
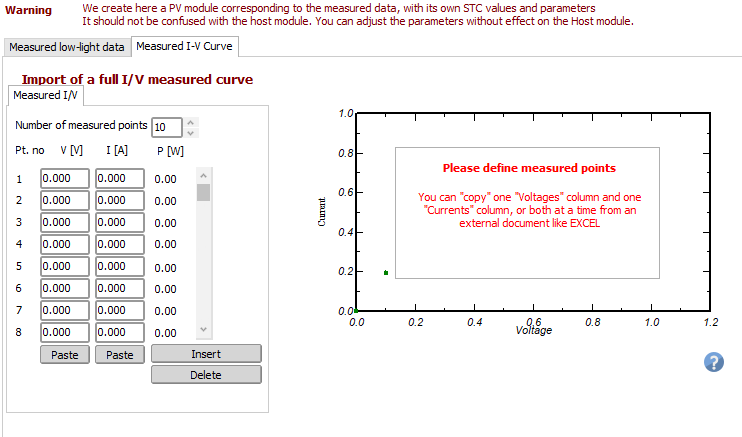
Hi, I am triying to include some additional information on a PAN file from a measured I-V data @STC (1000 W/m2, 25ºC). I would like to confirm one of the following points: Is it possible to save the imported measured I-V Curve data on the PAN? I tried several time to save the information but each time I save the file, this graph shows no data at all. Or: Is this "Measured I-V Curve" an educational tool to estimate Rsh & Rs of the PV module and no I-V curve information will be save on the PAN file? In any case, which shall be the best way to use this "measured I-V curve" to reestimate the Rsh and Rs? 10 points considering from Isc up to Voc? Or 10 points considering from Isc up to Pmpp? Or 10 points considering from Isc up to an intermedian Point between Isc and Pmpp? Thanks in advance,

-
 apexhhospital joined the community
 - Last week
-
 Niken13 joined the community
 -
What is the signage of the BackShd term. Is the loss being subtracted from rear irradiance or added to it? If the signage is negative- why is it being subtracted? Isn't GloBak (global irradiance on the rear side) achieved by already accounting for the shading losses? The flow diagram in the PVsyst report indicates it and the calculation checks out as well. Aren't we double counting? If the signage is positive, why are we adding it back? Is it to match the PR measured on site where the rear irradiance may be measured by rear POA sensors that are mounted on the torque tube and hence not accounting sufficiently for the rear shading factor?
-
 SPdesai joined the community
 -
 Joel Pontes joined the community
 -
 brisbanetowingandrecovery joined the community
 -
After Inserting the image, Just click on Modify button and move your image underneath the modules, Its just a click away.
-
The coordinate might not be the same exactly but i ensure is the same location.
-
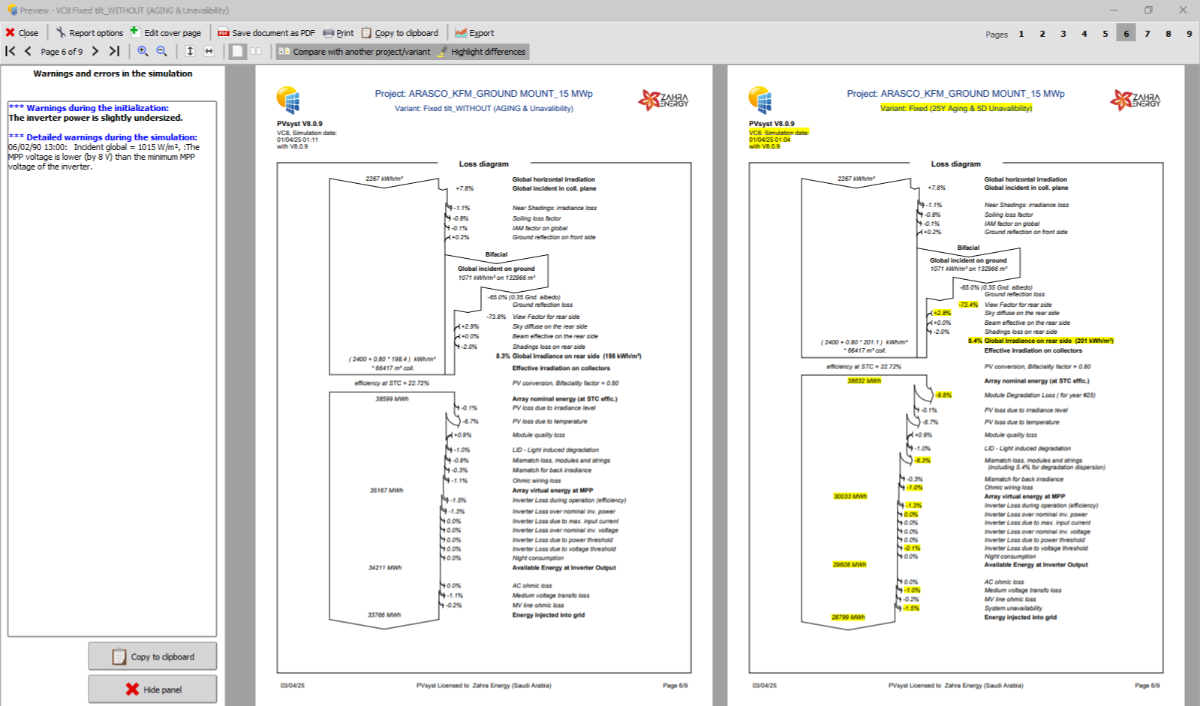
Dear Andre, I hope all is well, I have a ground mount project and i would like to clarify the following points: A- Fixed Mount Variant: I made three variants (20Y Aging, 5 Day Unavailability), (1Y Aging, 5 Day Unavailability), (without Aging & Unavailability) 1- how the following value calculated (the global irradiance on rear side 201 W/m2), and from where this percentage come 8.4%. 2- You can see from the comparison (attached) when i consider the aging for 20Y & 5 days Unavailability (nothing else has been changed), some factors had been affected and all of them is understood, except the global irradiance on rear side it increase from 198 w/m2 to 201 w/m2. 3- My company is a developer Co., and they use financial model to evaluate the IRR, in this model they insert the aging as a fixed value 0.3 yearly, and it applied on the specific yield for 25years, my question is : I told them that by this way we are not considering the effect of 25Y aging on the other parameters as it clear showing in the loss diagram of PVSYST , almost 9 parameters has been effected by the aging, please if i wrong correct me. B- Dome Variant: As we know in the dome option the PVSYST will not allow to activate the Bifaciality function, so in the near shading i convert the domes to fixed table, I would like to confirm whether this solution was correct. Lastly, what is the way to send you the zip file of the project, just to have a look on the above solution that i made it to activate the Bifaciality feature in dome option? Your guidance on these above questions would be greatly appreciated.
-
 Livhu joined the community
 -
For anyone wondering, it appears that this bifurcation is a result of soiling, since it disappears when soiling is set to 0% for each month. That said, it is still a mystery to me exactly how soiling values are affecting IAM.
-
Hello, Since the the power limitation is either in active or reactive power in PVsyst, adjusting the .OND file is indeed necessary to properly account for the inverter’s behavior at pf=0.85. In the output parameters in the .OND file, choose Apparent power and adapt the Nominal AC Power to 140 kVA in the Main parameters window. Make sure you rename the model and the file name to be used only in projects with a pf < 0.89 Regards,
-
 Hello, Thank you for reporting those behaviors. I believe there are several issues, which I will report for future correction, but my interpretation is different: - There are indeed a unit problem with the apparent and reactive energy, which will be corrected in future version. In the report, the switching to Mega watt hour instead of kilo watt hour doesn't work well for those quantity. The numerical value displayed is correct by the "k" in the unit doesn't switch yet to and "M". You can change the unit of the report for a consistent display in "kWh" by going to "Report > Report Options > Final Report Options > Energy Units > kWh". - The name of reactive and apparent energy are correctly displayed in the report. Though it seems to me that you didn't allow "solar injection into the grid" in the "self-consumption" window. Therefore, no active energy is transferred to the grid from the solar production and reactive and apparent energy are equal: Note here that the reactive component is computed based on the solar energy available at the inverter's output, as E_Reac = E_InvOut * Tan(phi). Then the apparent energy is E_app = sqrt (E_Reac*E_Reac + E_Act*E_Act) Let me know if this makes sense for you. As I see that you are trying to simulate a scenario with a large consumption, you were maybe looking for a different behavior of the reactive energy. Luca
 -
Dear Swonno, Can you explain what "origin feature in 3D scene" means? Also, could you share how you placed your PV tables and what type of tables you are using? In PVsyst, under Tools, there is an automatic altitude feature, but it works well only if all the tables are independent from each other. Regards,
-
Array of trackers 3D scene defining N-S & E-W slopes
Michele Oliosi replied to JamesLenton's topic in How-to
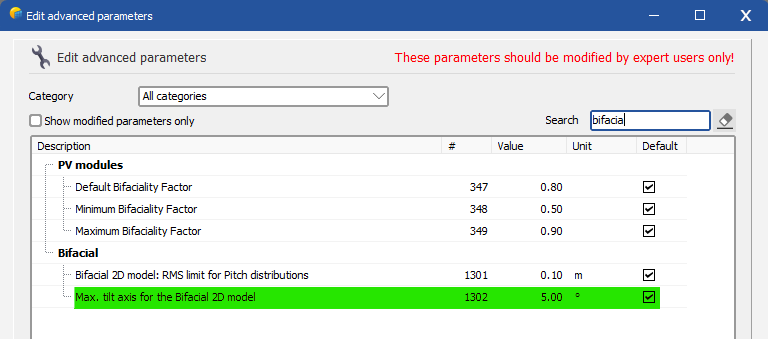
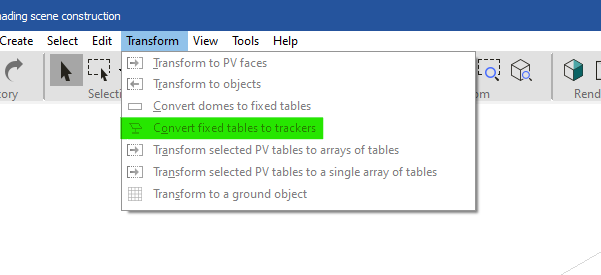
Hi ! Indeed, currently the backside and reflected irradiance modeling is quite picky. The idea is that the geometry it assumes is that of trackers on flat ground. The discrepancy between 3D scene and backside irradiance model therefore leads to this message, to warn users of the possible inaccuracy. However, there is no alternative model, and the approximation of flat ground is not too bad if the slope is only 5°. In other words: You can change an advanced parameter to ignore the axis tilt message: Home window > Settings > Edit advanced parameters: I think a good way currently is to build fixed tilt structures first and then use the "transform to trackers" option: This will ensure that you can use the row-to-row slope options which are available for fixed tilt arrays (if I am not mistaken).
-

Error for two orientation when importing virtocad PVC file
sherry replied to sherry's topic in Shadings and tracking
but if pvsyst created the orientation , how can i define the systemm part for each orientation?? i sent you now the zip file -

Error for two orientation when importing virtocad PVC file
Jéremie Bernier replied to sherry's topic in Shadings and tracking
Hello, the orientation has been created by PVsyst when you imported the PVC file. You have to define the system part for each orientation. If you need specific guidance, please send the zip file of your exported project to support@pvsyst.com -
Error for two orientation when importing virtocad PVC file
sherry replied to sherry's topic in Shadings and tracking
can someone respond me? I'm waiting for two days ,how can i resokve this problem?? -
@Hizir Apaydin Thanks, This is really helpful!
-

Correct selection of simulation variables for vertical bifacial PV
sagar b replied to Luis Zimmermann's topic in Simulations
Hi Luis, I would like to know more about your vertical bifacial project. Would you share me your project location, DC, AC, mounting height with nos. of module in Y and X, and real time project result? I am planning to consider vertical bifacial in heavy snowfall locations. Waiting for your response. Regards, -
Dear Swonno, In the report settings, it is possible to adjust the global energy production unit via Report options > Final report options > Energy unit, and you can also set the number of decimals for percentage values shown in the loss diagram. Regards
-
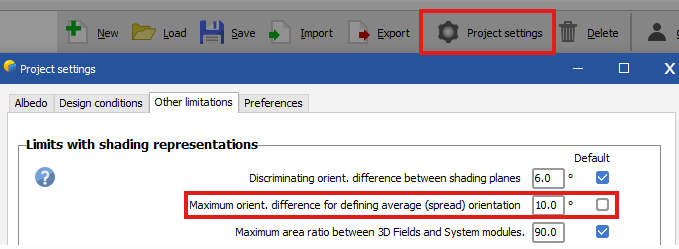
Hi Navid, Please edit this parameter inside "Project Setting" Hope this helps. Regards,
-
Dear PVSyst team, Hi, I'd like to study more about origin feature in 3D scene. Is there any specific explanation in doc which PVSyst released ? When I have different width rows(arrays) and use auto height adjustment feature, It seems not align , so if you have some material to be shared , Pls let me know. Thank you.
-
Hi Linda, I have similar question. I am using Huawei-125KTL-JPH0, mentioned that the pf range (0.8 lag- 0.8 lead) in the data sheet. This PCS has the nominal kW output of 125kW and max KVA rating is 140KVA. If you check the power triangle, pf can reduce to pf: 0.89 without compromising the active power output. and below this pf, PCS can not maintain the nominal active power output. In my case, Utility ask me to set the pf at 0.85. Is modify the pf inside (Energy management>power factor) enough to deal this case? Do I need to modify the ond file too? If pf is set at 0.9, I only modify the pf inside Grid management, but I am not sure it works for 0.85. I am looking forward for your response. Regards,
-
Hi Abeer, Above link will help you to know about the IAM loss. Just make sure you are using the correct pan file when doing the simulation. If manufacturer send you the pan file, you need to customize IAM, use PVsyst default depending on your module is AR coating or not. Same for the Relative efficiency at low light. Use default Rse to get the Rel. efficiency of -3% at 200W/m2. There is no problem if you use the pan file of the PVsyst database.