All Activity
- Yesterday
-
 Also, when I tried to switch it from "custom tracker" to "all trackers", it did not correctly save this change when running the model. The report still shows "custom tracker" and the shade losses are still lower than the prior model because that custom tracker is on an edge of the mask.
 -
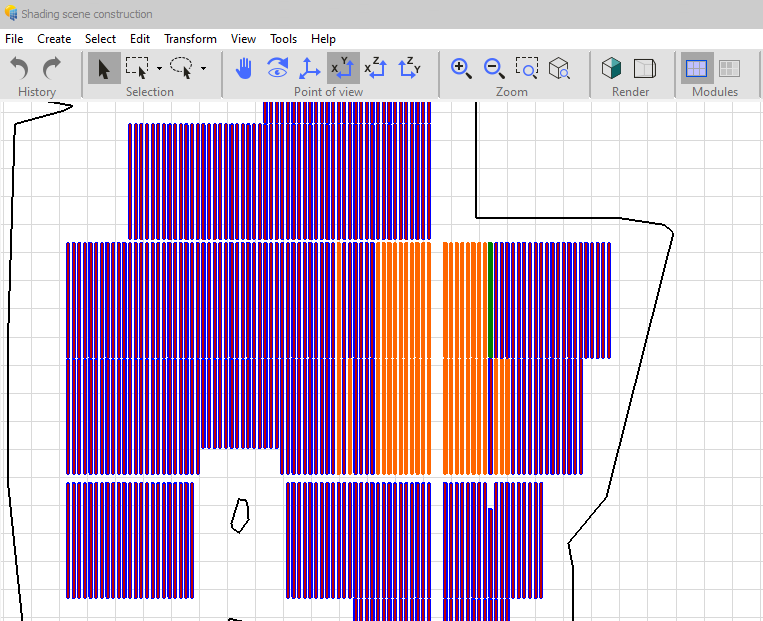
In version 8.0.9, I found that when I run a model from version 7.4.8 that had a good "custom diffuse" tracker selected, it is now not masked correctly (it is on the edge). Even if I go in in version 8.0.9 and select one that masks properly, after running it, it is on an edge again. See image below. This appears to be a bug with the custom diffuse tracker masking in version 8.0.9. Can this be fixed? It is not practical to always use "all trackers" for large arrays. The problem may occur specifically when the trackers are tilted on the terrain. This problem results in erroneous production jumps close to 1%, because the diffuse shade is only half accounted for. Thanks in advance for the help PVsyst.

-
 Admin joined the community
 -
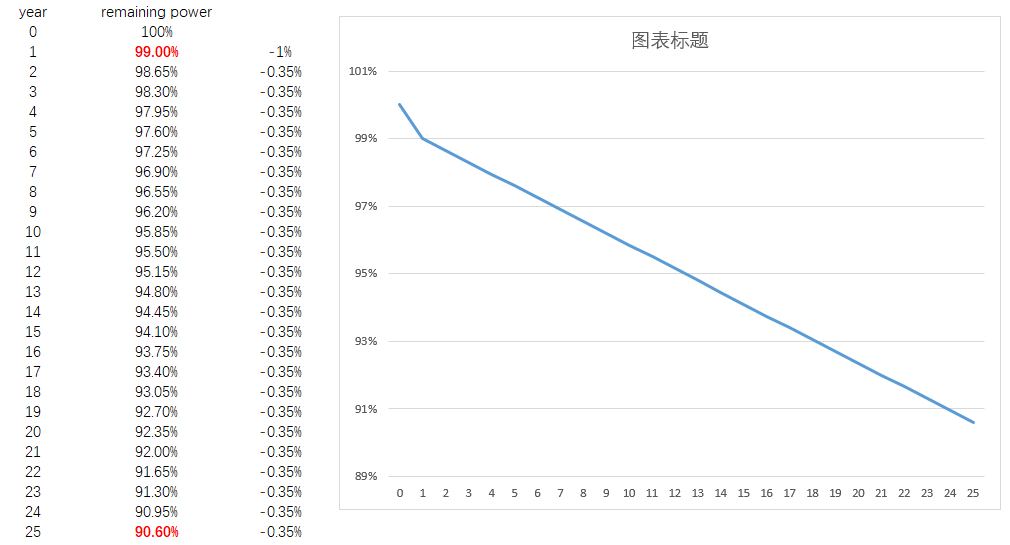
The degradation in PVsyst compounds the average degradation rate, and the fact that there is an RMSD in this degradation rate. The worse possible degradation rate is therefore AVG + 2*RMSD. A warranty is in principle below the worst case (because manufacturers need to play safe with these numbers). Therefore, you could estimate an upper limit for the degradation model by saying: WARRANTY > AVG + 2*RMSD (PMPP degradation). Note that given the first year degrading differently, this is not entirely correct. I also note that this warranty seems too good. But in this case, I do not think you should set "Vm RMS dispersion be set to 0.35/2 = 0.175 %".
-

Iso-Shading Diagram when no shading object is present
Nils Lang replied to PVsystUser's topic in Shadings and tracking
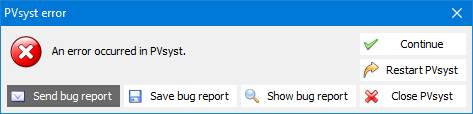
Dear PVsyst User, If you can reproduce these PVsyst crashes again, please press the <Send bug report> button of PVsyst error dialog and send us the prepared email (including the attached files) so we receive all the information needed to analyse the crash. A description with the list of actions you performed to reproduce it is also very useful. Best regards.
-
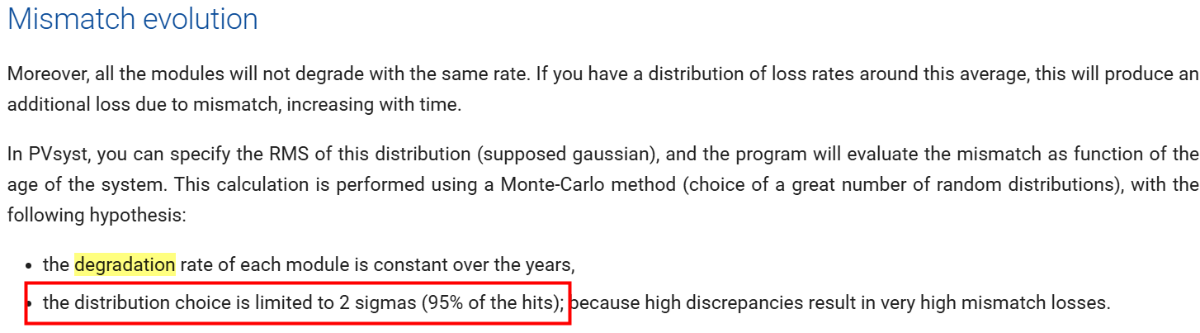
The 2 sigmas is approximately 65.26% of the hits?
-
Dear PVsyst team: For the distribution choice is limited to 2 sigmas (95% of the hits) of ageing parameters setting. if there is a clear warranty statement for the annual degradation rate of photovoltaic modules, such as maximum degradation rate 0.35%/ year,maximum 1% for the first year. The slope of the warranty is 0.35%. Can the Im or Vm RMS dispersion be set to 0.35/2 = 0.175 %? thanks!
-
great
-
 Jaber Mirzaei joined the community
 - Last week
-
 Hugues joined the community
 -
 kamtesel17 joined the community
 -
P.S. Please note the 5xxxx3 MWh value also shows up in the Report on the Loss Tree, in the "Balances and main results" table, etc.
-
PVsyst v7: Sum over E_Grid 8760 is 5xxxx2.3 MWh, which rounds to 5xxxx2 MWh. NB: 8760 has night losses. PVsyst Loss Tree (copied to Clipboard and pasted into Excel) yields 5xxxx3 MWh (no decimal places provided). If you remove one row from the 8760 summation, you get 5xxxx2.5 MWh, which rounds to 5xxxx3 MWh. So this tells me the PVsyst Loss Tree is missing a single row from its summation (namely, it's summing 8759 rows, not all 8760 rows). Please confirm it. (NB: Exact values masked for confidentiality reasons.)
-
 I solved the problem. Go to Display Settings > Custom Scale and set it to 100% (I had it set to 125% in my previous version of MS Office. This error occurred because I changed MS Office to MS 356).
 -
 This is a very interesting suggestion. Do you have an example of such setting specification ? Do you known if this is to account for irregularities on tracker placement, or rather to keep up with grid demands?
 -
 Hello PVsyst team, I would like to suggest a topic regarding the possibility to set different backtracking strategies for the morning and the afternoon. This request is based on real parameter settings provided by manufacturers for PV plants, and it would be helpful to reflect this functionality within PVsyst. Is this something you are considering implementing in a future update? Thank you, Alessia
 -
Modifying the OND file is another way
-

Iso-Shading Diagram when no shading object is present
PVsystUser replied to PVsystUser's topic in Shadings and tracking
- You are right, the terrain has been included in the scene and that's what is causing the issue. - PVsyst 8 crashes every time I want to import the scene and that's why I am using PVsyst 7.4 -I have shared the project and log with the support team 4 days ago, before writing here but it seems this chat was more helpful and thank you! -

Limitation of pan file for BC and HJT module
Luca Antognini replied to Chen's topic in Problems / Bugs
Dear Chen, We are currently investigating how to adapt our model to such technologies. It will take some times, as we want our modification to be backed-up by high quality experimental data and be applicable to the whole of our PV module database. We will present an update of our research at the upcoming EU-PVSEC. -

Iso-Shading Diagram when no shading object is present
Robin Vincent replied to PVsystUser's topic in Shadings and tracking
I guess, based on your scene the trees are not the major contributors to the shadings. It could be that all your rows don't have the same height, which is not taken into account in the backtracking algorithm. It could also be a bug. At the very least you should try it with the latest PVsyst version to see if you get your expected outcome or is the shadings are still looking similar. But again for this kind of questions you should contact PVsyst support instead of using the forum. There is only so much we can say based on a few screenshots. -
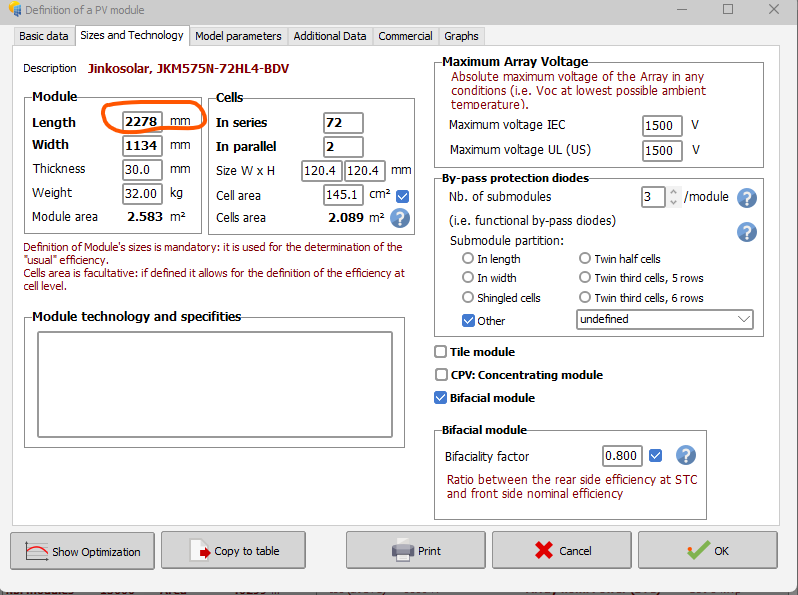
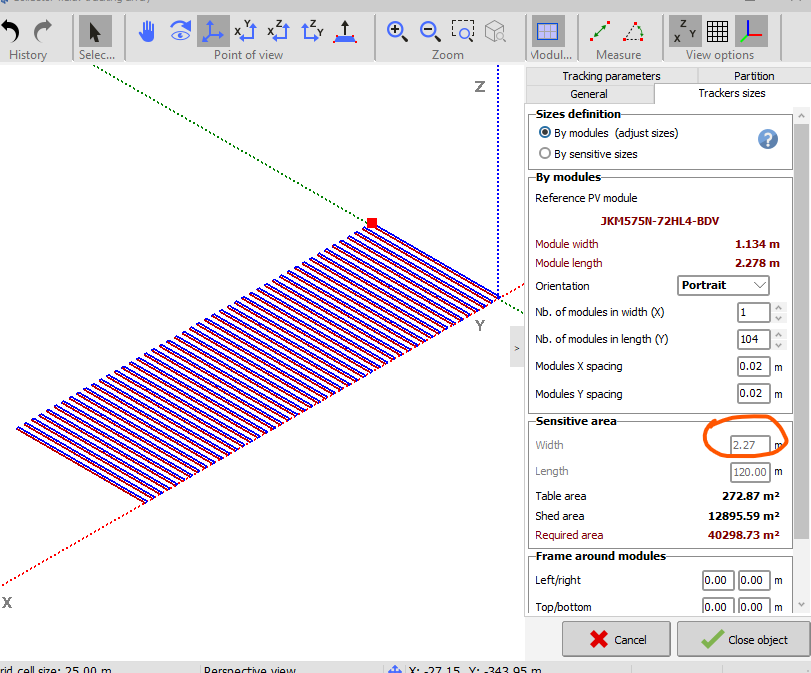
under system, i have selected a module which has a length of 2278mm in the pan file. under shadow scene, when i select size definition: by module, it shows width of sensitive area of 2.27m. What is the solution?
-

No import of meteo data, after selected and confirmed location
JMC replied to Toni's topic in Meteo data
I have the same issue. Using PVsyst 8.0.9 And I have been lead to believe I've got full admin privileges for this machine. (I can download and install this software.) -
JMC joined the community
-
Iso-Shading Diagram when no shading object is present
PVsystUser replied to PVsystUser's topic in Shadings and tracking
I haven't chosen a good word. Instead of "similar" I should have said why there are still shading when there is no tree. From your answer I realized that's might be the effect of backtracking. Although I am surprised because backtracking is activated in both runs and I have checked it few times. Could it be a glitch? -
 Anton113 joined the community
 -
 Sorry, I'm not sure why this is happening on your end—we haven't encountered the same issue. You might try maximizing the window to see if that helps?
 -
Hello Marija, Indeed, the only possibility is to apply a grid limit for the full system. As you suggest, a workaround would be to create a variant for each sub-system and aggregate the results. I will note your use-case for possible future development of for instance having the possibility to define the limitation per sub-array (as for the ohmic losses for instance). Thank you reaching out
-
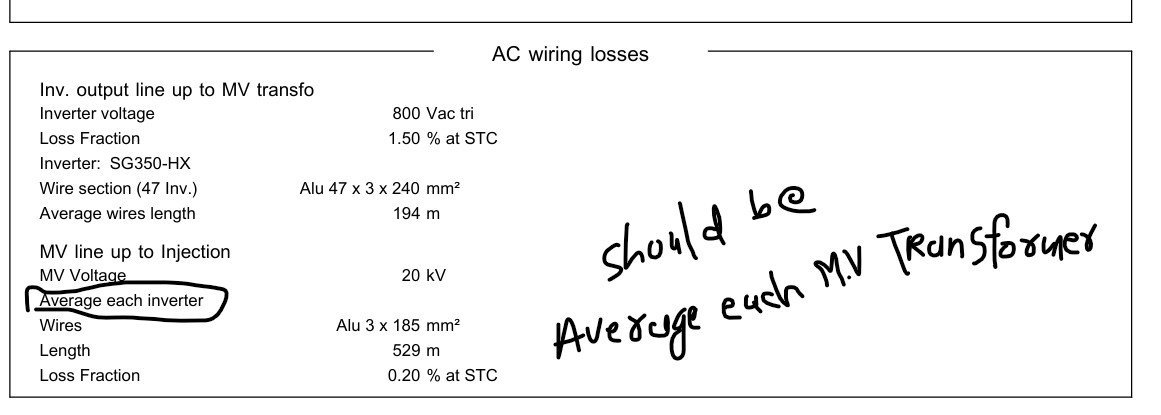
 Dear PVsyst Team, I have been reviewing the AC wiring losses in the system, specifically the data provided in the report for the Inverter output line up to the MV transformer and the MV line up to the injection point at 20 kV. Upon reviewing the report, I noticed a potential misunderstanding regarding the interpretation of the "average wire length" in the MV line section. In the report, it mentions: Average wire length for the MV line up to the injection point as 760 meters. However, the way the data is presented could lead to confusion. Initially, it seems that this distance refers to the wiring between the inverters and the MV transformer. But upon further consideration, it seems that the 760 meters should be the distance from the MV transformer to the injection point (where the power is fed into the grid at 20 kV), not per inverter. To clarify: The average wire length should indeed be for the MV line from the transformer to the injection point at 20 kV, and not per individual inverter. The inverter-to-MV transformer wiring and the MV line from the transformer to the injection point are distinct, and it's important to apply the loss fraction of 0.25% to the wiring between the MV transformer and the injection point, where the power is being injected into the grid. Could you please confirm whether this interpretation aligns with how the data is calculated in PVsyst? And, if possible, could you confirm the accuracy of the wiring loss fraction applied to this MV section? Please have a look to the attached screenshot of the PVsyst report. Looking forward to your insights and confirmation. Best regards, NIken
-
Hello, I'm working on a PV project that is divided into 9 zones, each with its own grid export limit of 4.44 MW AC. Overpaneling is allowed, so the DC side can exceed this limit. In total, the full plant would have 40 MW AC and potentially more on the DC side. I know PVsyst allows setting a Grid Power Injection Limit at the system level, but I haven't found a way to apply individual grid export limits per zone within a single simulation. Is there a way to simulate per-zone injection limits in one project? Or is it necessary to simulate each zone separately and then aggregate the results? Thanks in advance for your help!
-
Iso-Shading Diagram when no shading object is present
Robin Vincent replied to PVsystUser's topic in Shadings and tracking
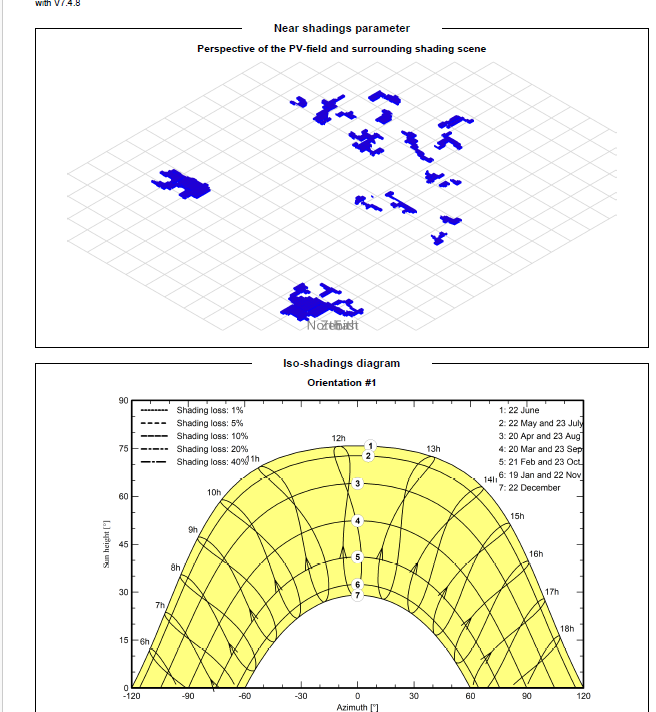
Dear User, It is kind of hard to analyse why your scenes yield different shading tables based on screenshots. For questions specific to your projects, please contact PVsyst support directly with your project : support@pvsyst.com. Regarding your first question, the iso-shadings diagrams are not identical (clearly visible on the "40%" line at the bottom which is higher on the left graph). That seems consistent with the shadings losses being higher on the left too. I won't be able to answer the second question without the actual project. Have you tried it with PVsyst 8? For the 3rd question, if the backtracking is enabled it might be possible you don't have mutual shadings at all. -
Iso-Shading Diagram when no shading object is present
PVsystUser replied to PVsystUser's topic in Shadings and tracking
I ran a similar scene (the only difference is that Tracking plane, horizontal N-S axis instead of Tilted Axis) and no iso shading diagram is generated: But I don't understand how one has tracking plane as horizontal N-S axis and the otehr one has tilted axis?