
André Mermoud
-
Posts
2075 -
Joined
-
Last visited
Everything posted by André Mermoud
-
Thank your for sharing this very interesting experience of the real world when using batteries. However this is not really related to the simulation of systems by PVsyst.
-
This situation is fully explained in the help of PVsyst https://www.pvsyst.com/help/physical-models-used/grid-inverter/inverter-pnom-as-f-voltage.html?h=pnom The treatment of PVsyst is not exactly compliant with this specification, but the results should be close.
-
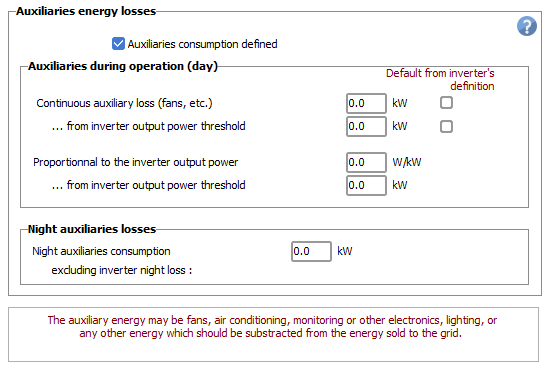
 Please give some precisions about what you mean by "Night losses". You can define losses for feeding the auxiliary equipment (fans, HVAC, monitoring, etc) , which are usually drawn from the usual low-voltage grid. The Iron loss of the transformers is a completely different kind of "night" loss. In fact this is a permanent loss, acting as soon as your transformer is connected to the grid. When producing PV energy, this is substracted from the production. This loss may be suppressed by night, by installing a switch on the HV line.
 -
The auxiliaries and night losses may be specified for the simulation, in the "Detailed losses" part, page "Auxiliaries". You have the opportunity of defining fixed values, with possibly a part proportional to the produced power, as the inverter losses will produce heat which has sometimes to be evacuated.

-
Sorry, this configuration of using the storage for shifting the delivery of power to anothe period of the day is not yet implemented in PVsyst. As a workaround for getting quantitative results, you can define a self-consumption system. You define a user's needs profile as the hours and power when you want to resell the electricity (this should be sufficient for completely discharging the battery). The results will give you the energy delivered to the user from the solar system, which is indeed the energy that you have reinjected into the grid.
-
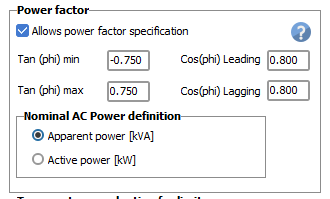
Question 1: in PVsyst, the required power factor is fixed (yearly or monthly values). There is no dependency on the temperature. The inverter specification indicates wheter the Pnom is specified as Active power [kW] or apparent power [kVA]. In the inverter's definition, page "Output parameters": During the simulation, PVsyst will apply the PNom limit according to this definition. Question 2: In principle, the reactive power IS NOT a real power: you cannot produce movement or heat with it. Therefore the production of reactive power doesn't consume any active power. Now you talk about Reactive power generation during non-producing hours. This is a very special feature of some solar inverters. PVsyst doesn't treat this : the rective power is always generated proportionnally to the available active power.
-
If I understand well, you have a cluster of 8 MV transfos, and a line of 3 km up to the injection point or a HV transformer. You have probably a junction box, and a common line to the injection point. Sorry, this is not yet implemented as such in PVsyst. in the present time in PVsyst you can only define a line from each transformer individulally to the injection point. Therefore for each inverter you should define a line with a length of 3 km, but a section corresponding to the power of one transformer. In the future, we will implement the opportunity of defining a junction box, and a common cable transporting the global power of all MV transformers. Please see the help https://www.pvsyst.com/help/project-design/array-and-system-losses/ohmic-losses/transfo-in-cascade.html?h=mv+transfo for further details. NB: If you are working with the "relative" AC losses (i.e. defined as percentages), and you are waiting for a global loss of, say 1% for this 3 km line, you should define a loss of 1% for the line of each transfo.
-
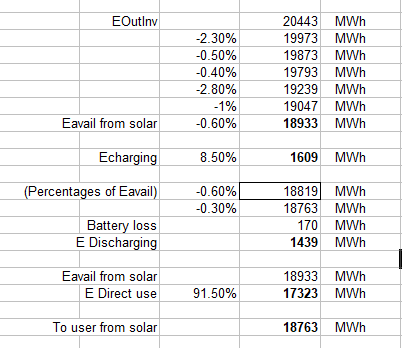
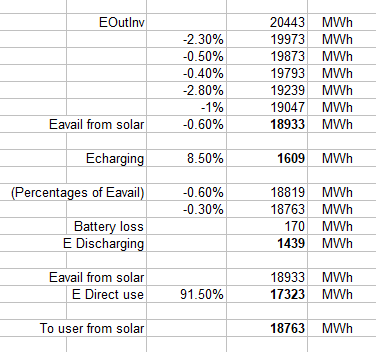
In the loss diagram, the energies are always evaluated from the previous energy. In this case, the Stored energy sharing is evaluated from the charging energy rather than the discharging. You can evaluate the available solar energy as 20'443 MWh * (1-2.3%)*(1-0.5%)*(1-0.4%*(1-2.8%)*(1-1.0%) * (1-0.6%) = 18'933 MWh. Then: 18'933 MWn * 8.5% = 1609 MWh. This is the charging energy. The direct use is 8'933 MWh * 91.5% = 17'323 MWh. Here is the detailed calculation in EXCEL: you can check that the final result is very close to the loss diagram. NB: You can get the detailed calculations of the loss diagram directly in EXCEL. In the menu of the report, you can use "Export => Loss diagram values", that you can simply paste in EXCEL.
-
The energy provided by the Solar system may be used: - either for charging the battery, - or (mainly when the battery is full, but this depends on the kind of system) it is directly used, either for feeding the grid or the user's needs (this also depends on the system kind). This is what is named "E Direct Use", as a complement to "ECharging (from PV)".
-
This graph is the distribution of the output of the system, as a function of the output power. Each bin represents the total energy produced when the system is operating at the concerned power. Now if you have overload losses, these arise always at the PNom of the inverter (or the system). Therefore they are all accumulated in the class correspond to PNom. NB: when opening this diagram in "Detailed results => Predefined graphs", you have the opportunity of adjusting the vertical scale (up/down button on the top left of the frame) for getting a "usual" distribution plot.
-
Please check the definition of the PV module of your first simulation. The temperature behavior is certainly false. A temperature loss of 0.7% is completely out of expected range. Except of you are at th North pole, a temperature loss is always several percents. Your second simulation shows a a reasonable temperature loss.
-
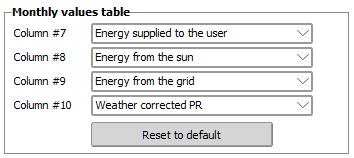
How I could add the PRTemp, TarrWdt and PR bifacial on Report?
André Mermoud replied to Ian Castro's topic in How-to
When editing the report, please open "Report options" in the menu. Here you have the opportunity of defining the values you want in the monthly table. The TArrWtd value is not available on the report. You can get in in the detailed results, button "Tables". Here you can generate a table of monthly values with any chosen variable (option "Custom table").
-
Batch Run - Pitch Not Showing as an Option (PVSyst 8.05)
André Mermoud replied to Joe Hollingsworth's topic in How-to
The GlobInc value is the result of the transpositiom model, and therefore independent on the mutual shadings. However with tracking systems, the tracker's position - and therefore the GlobInc - is indeed dependent on the pitch when you are using backtracking mode. Please check that in your simulations the backtracking is activated. -
Consideration of Ground Reflection on Front Side in PR
André Mermoud replied to CRW's topic in Simulations
First question: In usual systems, (not vertical), the "Ground reflexion on the front side" is very low. Now the PR in a Vertical situation with bi-facial doesn't make much sense. Therefore we don't worry about such inaccuracies. Second question: in "normal" systems with several rows, this contribution corresponds to the reflexion of the terrain between rows. In you particular case, you have probably one only row, or a very big pitch value. This is a limit case for applying the vertical rows model. Don't focus on the PR (which is an artificial indicator meant for usual systems, with well normalized incident irradiaton), and take the real energy yield into consideration. By the way the PR for bifacial models is not well established and is subject to many discussions. If you want to use the PR for a contract, you should carefully define the way of defining it with your contractor. For the 3rd question, the IAM effect is indeed included in the "Ground reflexion on the front side" calculation, as for usual systems, this is a very sensitive correction (this reflexion occurs at very high incident angle on the front side of the collectors). Last question: you can indeed perform a similar monofacial simulation, by setting the bifaciality factor of the PV module at a null value. -
Question about Sandia IAM Model Parameters in PVsyst
André Mermoud replied to zhangc's topic in PV Components
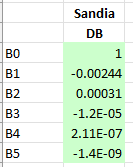
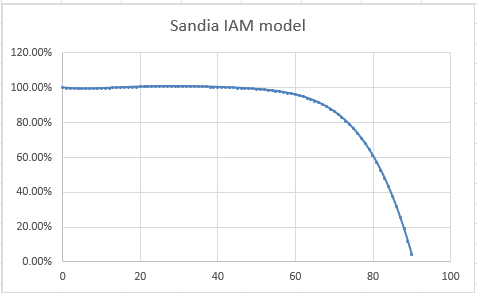
Yes, sorry, there are errors in the parameters of the help. We have to correct them. Here are the correct parameters: This gives this curve:
-
PV Output considering Irradiance and Temperature
André Mermoud replied to HadiK's topic in PV Components
The simulation involves many complex models. The incident irradiance is evaluated by a transposition model, including possible tracking, and losses like shadings or IAM are applied. The PV array yield is evaluated using the one-diode model. Then you have models for the inverter, the AC losses, the ageing, etc... All these models are described in the help (see especially "Physical models used"). -
The PAN files are meant for internal use within PVsyst. They obey to some internal coherency constraints. We don't ensure support about modifying them externally.
-
You define the option you want, and when clicking OK, you will be prompted for saving your PAN file with your choice.
-
No sorry, we don't have any additional information about the flickering effects on the inverters and the MPP tracking. Please ask the inverter manufacturer. However considering the wind turbine as a disk is obviously not the right way. PVsyst doesn't treat semi-transparent obstacles.
-
The user-defined state is shown according to the definition present on your PAN file (when you saved it). If it is de-activated on the PAN file, it will appear as de-activated.
-
You have to define this battery module in your database, and choose the required number in series and parallel. Now the best way is to choose an equivalent model existing in the database. There are plenty of batteries with 51.2V (16 cells of LFP technology in series).
-
Medium Voltage Line loss fraction and number of transformers
André Mermoud replied to Skyler V's topic in Simulations
Yes indeed, your configuration corresponds to what is named "connexion in cascade" in the help. This configuration is not implemented in PVsyst in the present time. PVsyst considers that each transformer is connected individually to the HV transformer input, or injection point. You should evaluate externally the global loss of your configuration, and define lines at the output of each transformer in order to get the same energy loss. The help https://www.pvsyst.com/help/project-design/array-and-system-losses/ohmic-losses/transfo-in-cascade.html?h=transf explains how to calculate this loss in a rather general way. Now in your simple exemple where you decide "a priori" that you want to define a loss of 1%, you can simply suppose that for each transformer, you define lines for a loss of 1%. NB: You should not define 1%/10 transfos = 0.1%, as this percentage is referred to the power of each transformer. -
Yes sorry, in the Peak shaving option, the consumption of the stored energy is not supposed to arise the next day after Sunrise. This could indeed be improved, but delivering 50 MW to the grid just in the morning when the sun is shining doesn't make much sense, and is not a usual requirement.
-
The simulation of PVsyst uses several physical models: irradiance (diffuse from global whern necessary, transposition on tilted plane), shadings, one-diode model for PV module performance, efficiency and power limitation for inverter, different losses, etc. No regressions are involved in this process. ,
-
Yes, the monthly PRtemp values are calculated using the array average yearly temperature, as mentioned in the help.