-
Posts
211 -
Joined
-
Last visited
Everything posted by Muhammed Sarikaya
-
Dear Nikoloz, In PVsyst Stand-alone, there’s no inverter component by design: the load (“User’s needs”) is defined as an energy demand (kWh), independent of whether the end-use is DC or AC. If you do have AC loads through a battery inverter, PVsyst’s recommended approach is to model it as an efficiency penalty. They also state the rationale: stand-alone (battery) inverters are fundamentally different from grid-tied PV inverters, so they’re not handled via the usual inverter database and are planned for a future implementation. Regards,
-

What does the white part of the Iso Shading Diagram representing?
Muhammed Sarikaya replied to PVsystUser's topic in How-to
Dear, The multiple curves visible comes directly from the shading factor table. See the help related: https://www.pvsyst.com/help/project-design/shadings/calculation-and-model/iso-shading-diagram.html This table is computed on a fixed grid (20° azimuth / 10° height),when fast calculation is choosed, see the help: https://www.pvsyst.com/help/glossary/shadings/shading-factor-table.html?h=table+fa And PVsyst always displays the isolines resulting from this calculation. However, the solar path never enters this region of the diagram that your show in green rectangle. Therefore, even though the iso-shading curves appear there, they do not correspond to any real shading situation. They are simply the graphical projection of the table-factor values in an area of the sun-position diagram that is never reached by the actual sun path. Only where the iso-shading lines intersect the solar trajectories can real beam shading occur. Regards, -
Dear Carlos, Today, with PVsyst version 8, you can mix any orientations you want. Regards,
-
Dear Nikoloz, Here are two videos for the standalone project: Regards,
-
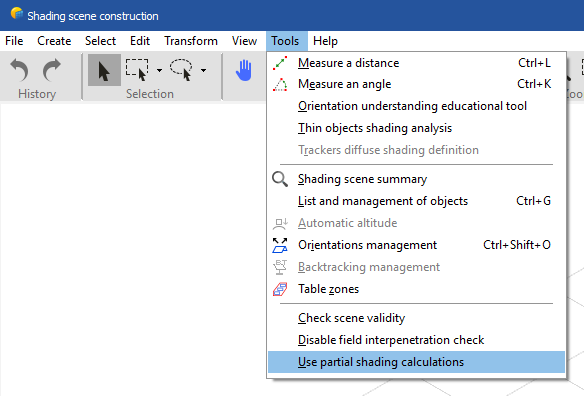
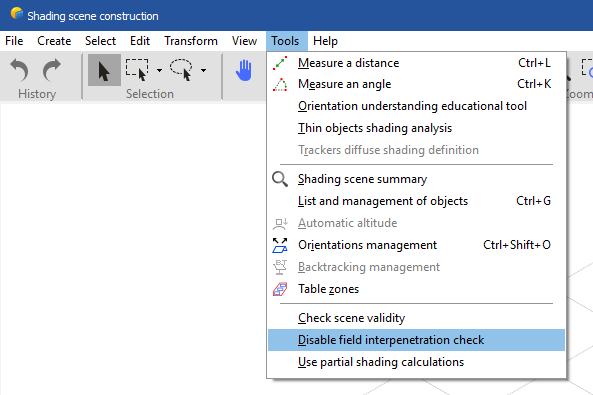
Dear, You can disable this check in Near Shadings by going to: Tools → Disable field interpenetration check See below: Regards,
- 4 replies
-
- 3d shadings
- near shading 3d scene
-
(and 1 more)
Tagged with:
-

Inquiry on Simulating PV Façade Installations in PVsyst
Muhammed Sarikaya replied to Sara's topic in How-to
Dear Sara, You need to adjust your PV area to make it 1,100 m², but you also need to know its position on the façade. At first, you have two orientations — one for the façade and one for the rooftop. So, you need to create two orientations, and in the system, create two sub-arrays where you can assign the appropriate PV modules for each orientation. Then, in the 3D scene, when you place the PV modules, you need to select the initial orientation. If the PV module brand or size is different, Near Shadings will automatically detect it. What’s important to know is that Near Shadings is used to calculate shading losses on your PV surface. Once calculated, it applies the percentage of shading losses to the final simulation results. Regards, -
Dear Nikoloz, You can follow this tutorial: Regards,
-

Inverter Clipping (overload loss) for On-grid
Muhammed Sarikaya replied to Ziad's topic in Simulations
Dear Ziad, Without the project, I can’t know what the issue is. Could you please send us your project at support@pvsyst.com and explain what the issue is? Regards, Muhammed Sarikaya -
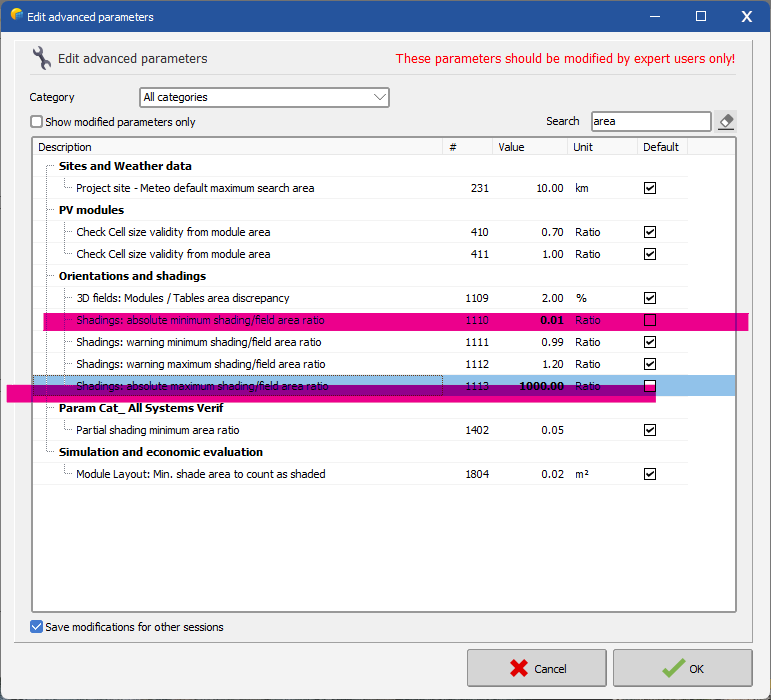
Dear Johan, From your error message, we can see that the 3D scene is larger than the declared system. I noticed that you are changing the number of trackers in batch mode, while also modifying the number of strings in parallel. There is a workaround to make this work: In PVsyst, go to Settings → Edit advanced parameters. In the search box, type “area”, then adjust the parameter as highlighted below. Regards,
-
Dear Zahra, If you know the exact global wiring resistance of your system and want a precise result, you can fill in the field "Global wiring resistance". Usually, the value for "Loss fraction at STC" is used when the exact global wiring resistance is unknown and you are just estimating it based on the STC value. For module losses: LID losses: Not applicable for PV modules based on n-dop wafers. You need to know the technology used in your PV module. Otherwise, we don’t have precise information regarding LID losses, since manufacturers don’t usually share this type of data. You can decide to add 1% or 2% depending on your confidence in the PV module. See our help page: https://www.pvsyst.com/help/project-design/array-and-system-losses/lid-loss.html Module Quality: Please read our help page: https://www.pvsyst.com/help/project-design/array-and-system-losses/module-quality-losses.html Module Mismatch Losses: Please also see our help page: https://www.pvsyst.com/help/project-design/array-and-system-losses/array-mismatch-losses/index.html Usually, this is also an approximation, based on your assessment of the PV module quality and the variability between them. Regards,
-
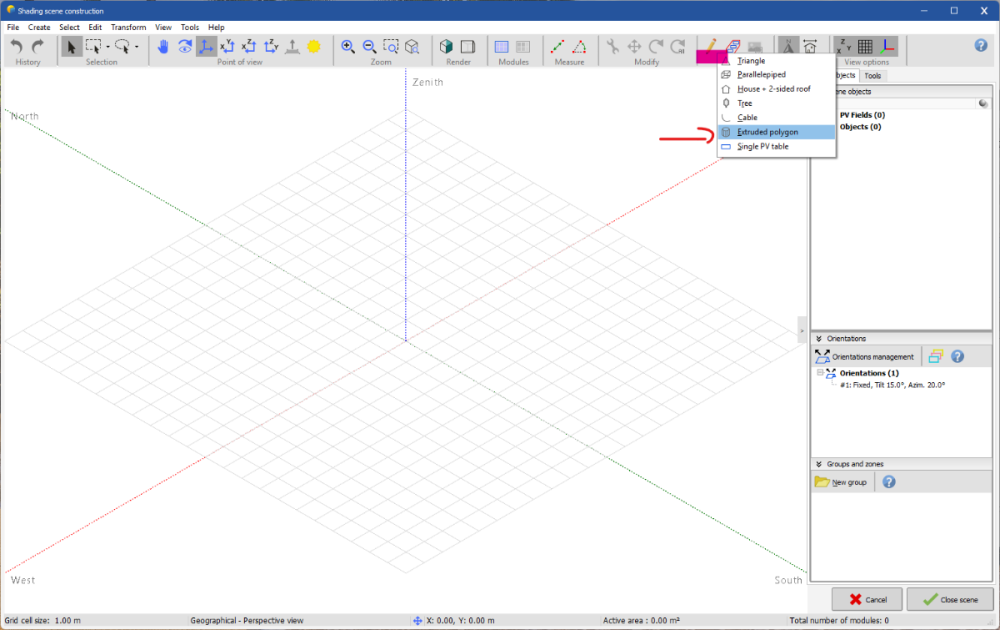
Dear Caio, Thank you for your suggestion to improve the 3D feature in PVsyst. For your first suggestion, I recommend trying the “Pen – Extruded polygon” tool (see below). It lets you draw a complex shape on the ground plane and extrude it to whatever height you need. Let me know if this helps. Regards, Muhammed Sarikaya
-
Dear Zahra, For a stand-alone project, which is generally small and simple, we don’t represent the inverter, because the main focus is to understand how the PV modules, along with the batteries, will meet the users’ electricity needs. This is why it’s not possible to define an inverter with specific parameters for each MPPT in such a project. For your first question: No, this is not possible in PVsyst. The software does not allow you to input pre-calculated PV production as an input. In a stand-alone system, you must define the PV fields, and PVsyst will calculate the production based on those components. For your second question: Could you tell me which parameter you would like to modify? Regards,
-
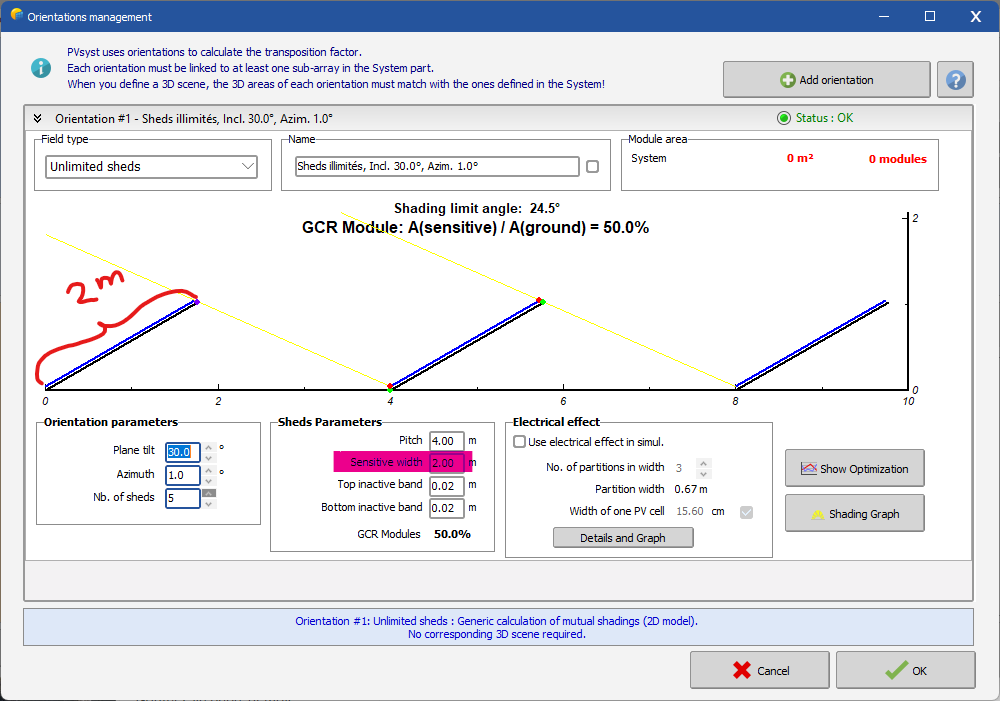
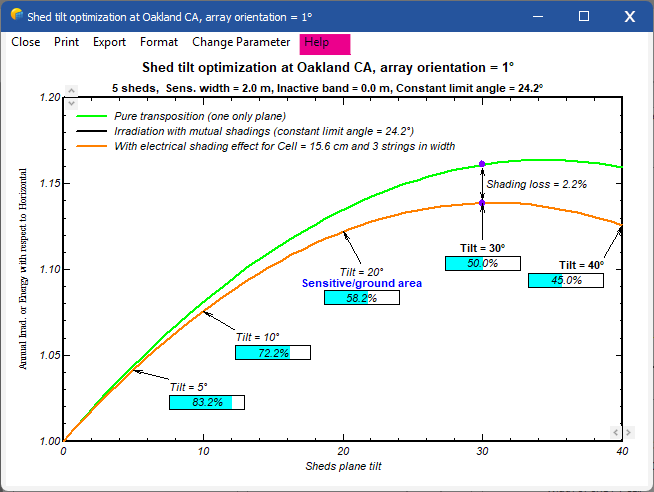
Dear Oscar First of all, in the "unlimited shed" orientation, the sensitive width is the total width of the modules aligned on your PV table. For example, if your PV module is positioned in landscape in your 3D scene, the smaller side is 1.134 meters. Since you want two rows placed one above the other in each table (still in landscape), you need to multiply the smaller length by 2: 1.134 × 2 = 2.268 meters. In my example below, I used 2 meters as the sensitive width. You can always verify in the 3D scene whether the sensitive width value is correct. But if you already know the dimensions of your PV module, its orientation (landscape or portrait), and the number of rows per table, you can calculate the sensitive width. You can also click on the "Help" button in the "Show Optimization" window — it will open a help page with a full explanation (see below). If you need more information or something isn’t clear, don’t hesitate to reach out to us. Regards,
-
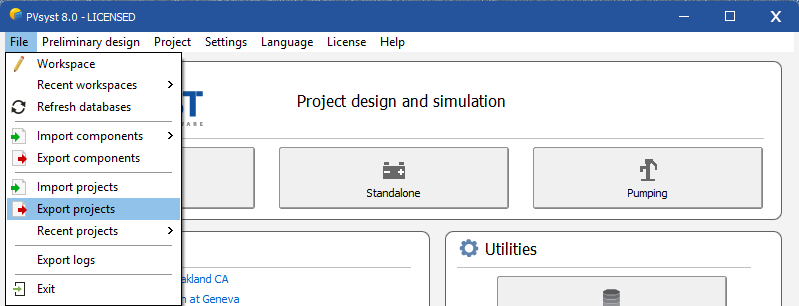
Dear Haseeb, Can you please send your project to support@pvsyst.com so that we can analyze the issue? Please follow this process to export your project as a ZIP file: Regards,
-

PVsyst String Configuration and Shading Scene Simulation Issues.
Muhammed Sarikaya replied to NFI's topic in Simulations
I invite you to consult our help page regarding this: https://www.pvsyst.com/help/project-design/shadings/near-shadings-3d-construction/construction-tools/zones-of-tables.html?h=zones+tables -

PVsyst String Configuration and Shading Scene Simulation Issues.
Muhammed Sarikaya replied to NFI's topic in Simulations
Dear NFI, I don't understand what you mean by "one way to configure the string with inverters." I invite you to watch this tutorial, which explains well how to configure it: Regarding near shading, it can indeed be difficult to place the modules. I suggest trying the zone tools as well. Also, if you encounter an error message, please send it to us at support@pvsyst.com along with a screenshot, so we can help you solve the problem. Regards, -
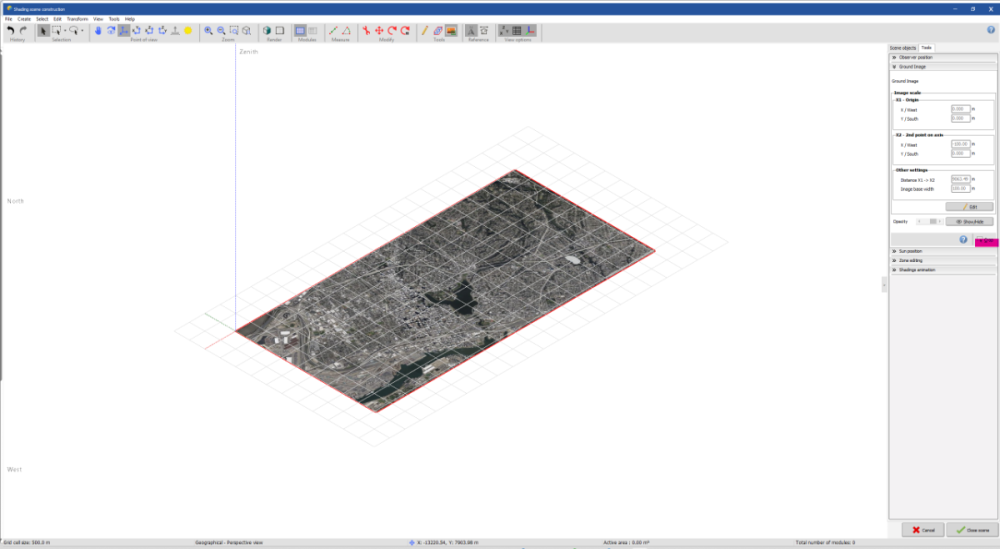
Dear Shivam The map size is limited, but if you want to import an image, you can do the following: Take a screenshot of a satellite image. Then import it via File > Import > Import a ground image. Finally, you need to scale the image to match the actual scale. To crop an imported image: Double-click on the image. You will see "Ground Image" with a Crop option (highlighted at the bottom right). Click on it to crop and resize the image. Regards,
-
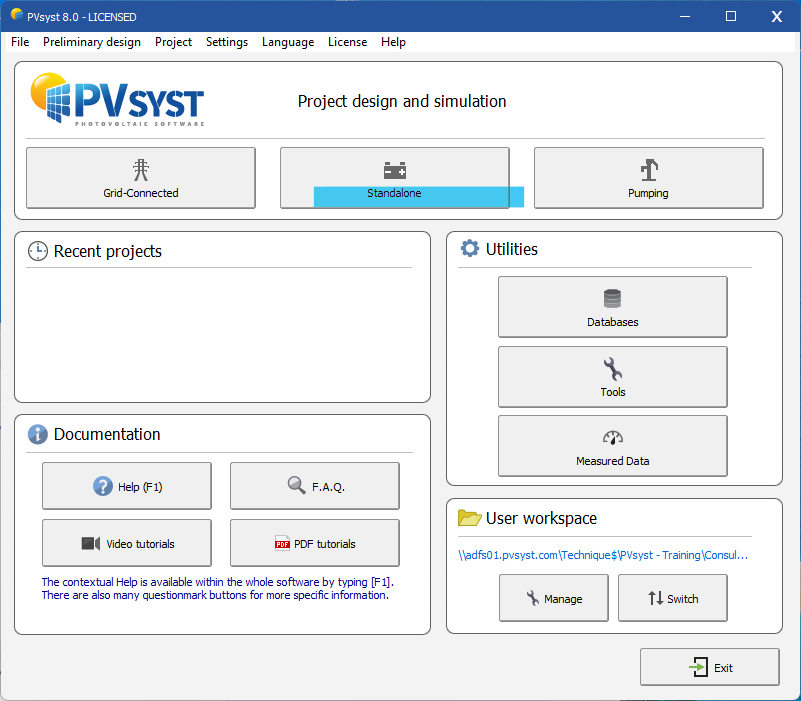
Dear Greg, If you don’t want to import energy from the grid, it’s considered a stand-alone project. I suggest running your simulation as a stand-alone system. In a grid-connected project, the grid supplies energy when the system can’t meet the user’s demand. See my screenshot below: Regards,
-

Shading forest for utility projects
Muhammed Sarikaya replied to CarlosSolis's topic in Shadings and tracking
Dear Carlos, I don’t recommend importing a detailed 3D forest file into PVsyst. The more detailed the 3D scene is, the longer it takes to calculate the shading impact on the PV tables. For the horizon line, you can already import the mountain line in PVsyst using the horizon feature. In the 3D scene, if there is a forest at the edge of your terrain, I suggest drawing a wall to represent the last row of trees. Regards, -

Inverter output power by .OND file
Muhammed Sarikaya replied to Andrés Fernández's topic in PV Components
Dear Andrés, Can you please send us your .ond file at support@pvsyst.com so we can examine it? Also, could you explain your issue in your email? Regards,

.png.5a0f08430bae173944a56977dd41765f.png)
