
Bruno Wittmer
-
Posts
155 -
Joined
-
Last visited
Everything posted by Bruno Wittmer
-
In the 3D editor, please follow these steps: 1. 'Create -> Building/Composed Object' 2. Go to 'Add Object' and create the Handrail 3. After closing the 'Elementary shading object' window with the handrail, but still in the 'Building / Composed object' window, apply an azimuth of 90° to the handrail. 4. Now close the 'Building / Composed object' window, coming back to the main window of the 3D editor 5. If you now apply a tilt to the handrail, it will rotate like in the screen shot above.
-
It is correct, that PVsyst uses the Erbs correlation for the case that only GlobHor (GHI) is given, and the diffuse contribution needs to be derived from a model. The report does not seem to reflect this properly. A ticket has been created to fix the problem in one of the next PVsyst releases. Thank you for reporting the issue.
-
The PV module efficiency is the power generated by the PV module, divided by the power reaching the module in form of light. The generated power is calculated with the single diode model for the given external conditions (irradiance and temperature), while power in form of light is just the irradiance times the surface of the PV module.
-
@VanoV23 Since this is a safety issue, it is important to consider the worst case and not only standard operating conditions or some compromise between. If the default definition of the worst case in PVsyst seem too conservative, they can be overridden as explained in my previous post.
-
I assume that this question is about the Backtracking parameter in the batch mode. The way it works, is that in this column you can enter the characters Y or N for each simulation, and this will activate or deactivate the backtracking mode respectively.
-
 Hi Greg, In PVsyst the grid-tied systems with storage will never charge the batteries from the grid. The non-zero values for EFrGrid are situations where PV generation and battery discharge together are not enough to cover the load, and therefore power needs to be imported from the grid. This typically happens at the end of the night and early in the morning when batteries may be discharged and PV generation is still low. It can also happen after a series of cloudy days that did not allow to fully charge the batteries.
 -
The Voc does not change very much with irradiance. At -10°C, going from 1000W/m2 to 500 W/m2 will change the Voc only around 2%. The irradiance chosen for the worst case scenario is not necessarily the one when the inverters perform a regular self-check in the morning. It could happen that the DC is connected at a time when there is already a significant irradiance, but the ambient temperature is still low. There are two settings in PVsyst that will control the check of the maximum array voltage: In the project settings it is possible to set the temperature at which the check will be performed. If the single diode model parameters in the PAN lead to a temperature coefficient for Voc that is larger than the one specified by the PV module manufacturer, it is possible to introduce this value in the PAN file, and then in the project settings tell PVsyst to use that coefficient instead of the single diode model calculation.
-
Potential Bug in "Weather data tables and graphs"
Bruno Wittmer replied to Hung MAI's topic in Problems / Bugs
Thank you for reporting this problem. It will be fixed in one of the next PVsyst versions. -
The monthly values do not tell whether PV generation and load are aligned all the time. If you don't have any storage in the system, the load may not be covered in different situations, like outside daylight hours, early in the morning or evening if the load is high, or during cloudy periods in the middle of the day. Therefore, it is quite normal, that you cannot self-consume all the monthly or yearly PV generation, even if it is less than the integrated consumption.
-
Your understanding is correct. The batch mode of PVsyst will indeed not change the number of modules, strings or inverters when you change the pitch. You need to specify those parameters explicitly for each simulation in the batch run and ensure beforehand that they are consistent. In your scenario, where you have standardized containers that will take the PV modules, it should not be too hard to calculate the number of strings that work for a given pitch, and possibly adapt the number of inverters or MPPT inputs. This will give you a limited number of scenarios, for which you then need to vary the tilt. The simplest approach for your case would be to create the batch parameter file with PVsyst, where you choose as parameters tilt, pitch, number of strings and number of inverters (or MPPT inputs). Import this file into a spreadsheet software like Excel or LibreOffice, and fill in lines for all combinations of pitch and tilt. For the number of strings use a formula that computes the number you can fit on the containers as function of the pitch. For the number of inverters use a formula based on the number of strings. If you save this again in CSV format, you can proceed to run the batch simulations. If you are unsure about what PVsyst will do exactly in a given batch simulation, you can use the option 'Calculation version for specified runs', when you first define the batch parameters. This will create an additional column in the batch parameter file, where you can fill a 'Y' for runs you would like to cross-check. These runs will then create variants in your project, that you can open and examine once the batch run is finished. To easily spot these new variants in the project, PVsyst will use the 'Comment' column to generate the titles of the variants.
-
Currently PVsyst handles PV modules with IBC cells in the same way as other crystalline Si modules. We have looked into this issue, and to our understanding, the shading advantage of this technology is limited to situations where only a few (1-4) PV cells of a substring in a PV module are shaded, while the other cells are fully illuminated. We estimate, that these situations happen so rarely, that neglecting this effect will not lead to significant errors in the yearly yield calculation. Nevertheless, we intend to include the special behavior of IBC cells into our models, in order to account for this small improvement. The current roadmap foresees the availability of this feature by end of this year.
-
Dear Simon-Pierre, Please note, that in order to reach a larger audience, the forum language is English. Your question is probably meaningful for many other PVsyst users, and therefore I will answer in English. The generation of the single line diagram (SLD) in PVsyst has some limitations. As an example, some power optimizer architectures or ambiguous MPPT/inverter assignments can lead to this situation where the program is not able to build the SLD. The sub-array in the screen shot you posted does not contain anything special that would prevent the generation of the SLD, but I see that there are other sub-arrays, and maybe the problem is coming from one of them. You can send a copy of your project to support@pvsyst.com, and we will have a closer look on why this happens. To export the project, please go to 'Files-> Export projects' in the main window. Select the project and click on 'Export'. This will create a single file with .zip extension, that you can e-mail to us. We are continuously improving the generation of the SLD, to cover more and more of the cases that are currently not handled. Additionally we will also foresee messages for the case that the generation fails, to give some feedback to the user rather than just disabling the button. I have added a corresponding ticket to our development pipeline.
-
There are several possible reasons why a non-zero azimuth could be the optimum. In general, an optimum at -5° means that on average there is more direct beam irradiation in the morning than in the afternoon. As you mention already, a significant horizon effect can be at the origin of this. Another possibility are systematic differences in cloud cover between morning and afternoon. In the optimization tool you can choose to display the variables 'GlobInc' and 'GlobEff', to get some hints on the origin of the effect. The GlobInc variable describes only the transposition and will therefore display effects that are already present in the Meteo data (like different direct/diffuse ratios in the morning and afternoon). The GlobEff variable contains shading effects and will therefore add effects coming from the horizon line.
-
The problem has been fixed in PVsyst V7.4.6 that will be published in the coming weeks.
-
This is a numerical imprecision in the calculation. This plot should indeed be flat, since the global light reaching the ground does not depend on the mounting height. The calculation is based on the 2D-section of the rows, and therefore does not consider border effects as suggested by chuang. It is only the light coming through the gaps in the rows that will be accounted for. The numerical imprecision leads to a variation of around 2% in this example. This is quite extreme and probably due to a rather small pitch (high ground coverage ratio GCR). More common GCR values in the range of 0.4 - 0.6 lead to an imprecision of less than 1% in this calculation. This extreme example will translate to an error of 2% in the total bifacial irradiance contribution. For a bifacial irradiance gain of around 10% , this would lead to an imprecision of 0.2% in the total PV generation of the system, which is a rather small uncertainty for a bifacial simulation. Most likely the bifacial irradiance gain is much smaller than 10% in this high GCR example, making the error that arises from this numerical uncertainty negligible.
-
The detailed calculation of the rear side irradiance is described in the help under https://www.pvsyst.com/help/index.html?bifacial_systems.htm In short, PVsyst calculates first the irradiance on the ground, accounting for direct and diffuse components. The scattered irradiance is given by the albedo value and the part reaching the rear side of the PV modules is calculated with the view factors. To this contribution of scattered light PVsyst will also add the light coming directly from the sun to the rear side as well as the diffuse sky irradiance reaching the rear side.
-
The tracker will always stay within the mechanical limit, in your example this would be +- 60°. If the backtracking limit angle is larger, this just means that the trackers will stay at + or - 60° until the sun is so low that they need to backtrack to avoid mutual shadings.
-
The shadings losses depend on the details of the PV system layout and on the sun paths, which in turn are a function of the geographical location. Furthermore the losses will depend on the specific weather, since the shading of direct and diffuse light needs to be calculated differently. There is no simple formula to calculate these losses, this has to be done by the software.
-
The hourly output files in PVsyst contain one line per hour, and the timestamp labels the beginning of the time interval. For example the hour labeled '10:00' is the hour from 10:00 to 11:00. In the hourly output files no aggregation at all is performed, each line represents an individual hour.
-
The pitch of the trackers has no optimum point in terms of energy yield. The shading losses will always decrease as you increase the pitch. Therefore the optimal pitch is the result of a financial optimization, that takes into account the decreasing gain with the associated system and land costs that increase if you move to larger spacing. You can use the 'economic evaluation' in PVsyst to set up a financial model that includes al the expenses and costs. Then you can use the 'batch mode' or the 'optimization tool' to find minimal values for LCOE (levelized cost of electricity) or maximal values for NPV (net present value) or ROI (return on investment). These tools are describred in the corresponding help pages of PVsyst.
-
Sub-arrays in floating photovoltaic (FPV) system
Bruno Wittmer replied to Alo Rahom's topic in How-to
The concept of sub-array in PVsyst is linked to the string configurations on the MPPT inputs of the inverters. If the inputs differ in string length, PV module type, PV module orientation or number of strings per MPPT input, then you should put these configurations in separate sub-arrays and use 'multi-MPPT feature' together with 'Power sharing'. The 'Power sharing' tool will allow you to tell PVsyst which sub-arrays belong to the same inverter. You can also use different sub-arrays to just group your inverters or MPPT inputs into logical units. However be aware that if you have a large number of MPPT inputs and are using the 'multi-MPPT feature', that this might slow down the simulation. If in your floating PV system the strings have all the same length and are all connected to the same inverter, you can keep them in a single sub-array even if physically they are in different floating islands. -
Currently there is no specific snow model in PVsyst. The recommended way to account for snow coverage, is to use the monthly soiling losses. You need to estimate these monthly values outside PVsyst, either by simply using weather data on snow coverage, or by using some more sophisticated snow coverage modeling. You might also consider to increase the monthly albedo values in the 'Project settings' to account for increased ground reflection due to the snow cover.
-
Please make sure that the location for which the 23 meteo files are valid, is close enough to the site of the project. If that is not the case, the files will not show up in this tool. You can check this already in the project dashboard. If the meteo files can be selected from the dropdown list, they will also be visible in the 'Aging tool'. By default PVsyst will discard meteo files for locations that are further away than 10 km. You can change this threshold in the 'Advanced parameters'.
-
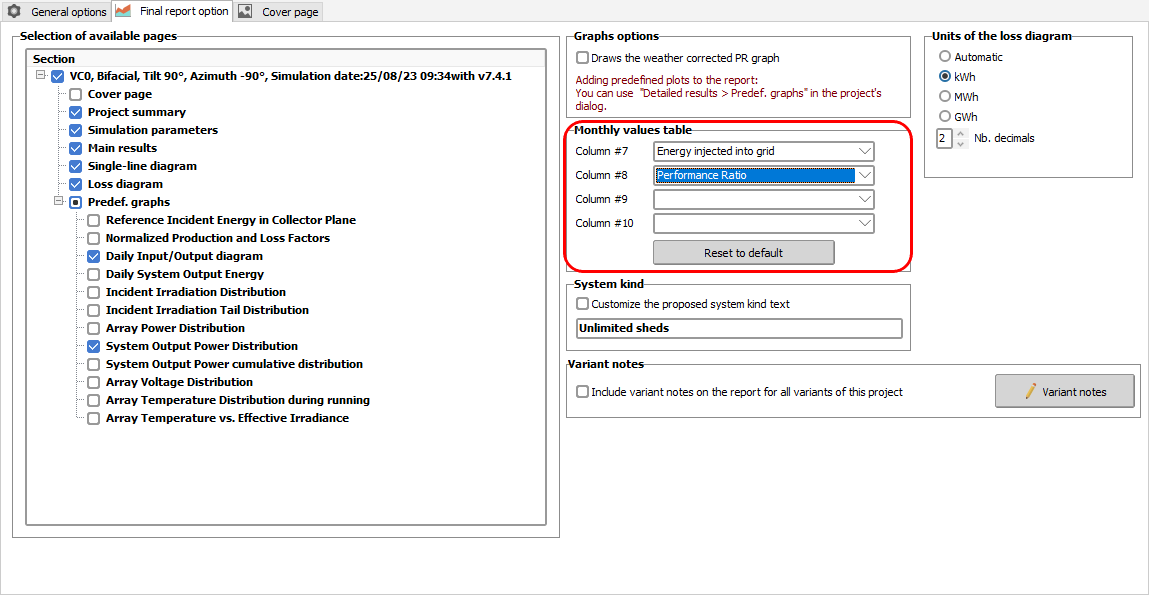
Main results page does not show Egrid and PR in the table
Bruno Wittmer replied to Sydwell's topic in Simulations
This is indeed an error that slipped into PVsyst V7.4.1, this will be fixed as soon as possible. In the meanwhile, please go to the report options and set this manually:
-
kWp means 'KiloWatt peak' and refers to the nominal power of the PV modules, which is given for 1000 W/m2 of irradiance. This is close to the maximum power you would expect at full sun, therefore the term 'peak'. This is used in the context of the PV modules, meaning the DC part of the PV system. If you are talking about the inverter nominal output you will see kWac or kVA being used.