


Hizir Apaydin
-
Posts
97 -
Joined
-
Last visited
Posts posted by Hizir Apaydin
-
-
Dear John,
We do not currently plan to provide an online API for PVsyst. However, in order to enable process automation, we are developing a new command line interface tool named PVsystCLI. You can find details about this new product on this topic related to our ongoing development for 2024: https://forum.pvsyst.com/topic/3773-ongoing-development-of-pvsyst-8-and-pvsystcli/
Regards,
-
Dear Swonno,
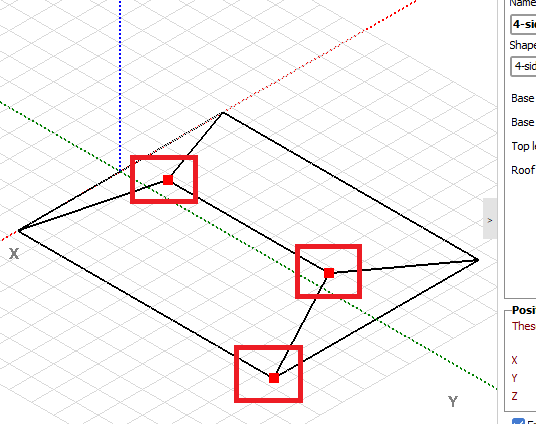
The field you mentioned with the red box is actually a display error in PVsyst, this field and its value are not used to model the 4-sided roof.
I suggest you to use the three red squares in the 3D view to manually design the object in order to check to which property of the roof correspond each field:

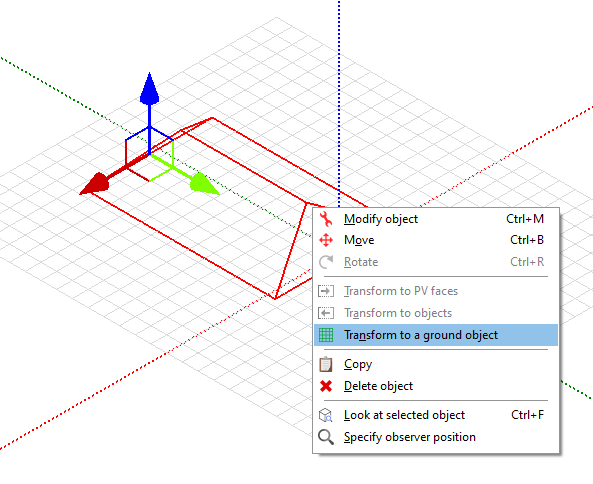
Please note that you will have to transform your roof to a ground object in order to be interpreted as a mountain:
However, please note that the method of using a roof object to design the mountain is not the most appropriate one in PVsyst.
You can use one of the import procedures described in the links below to import a topology from Google Earth or Sketchup:
https://forum.pvsyst.com/topic/3209-how-to-import-a-ground-topography-from-googleearth/
https://forum.pvsyst.com/topic/3211-how-to-import-a-topology-from-sketchup/
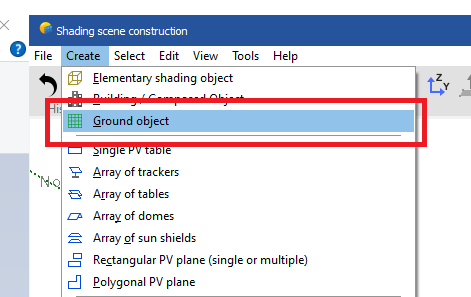
You can also directly create a ground object in PVsyst without going through the roof creation stage:
The ground object creation and modification is described here: https://www.pvsyst.com/help/ground_objects.htm
Regards
-
Dear Wslee,
Could you please check that you have Arial Unicode MS font installed on your system when the problem occurs? (C:Windows>Fonts)
If not, you can download and install it from this link: https://freefontsdownload.net/free-arial-unicode-ms-font-36926.htm
Could you also export and send your log files (menu “File>Export logs”) to support@pvsyst.com just after the issue happen
Regards
-
Dear Thodoris,
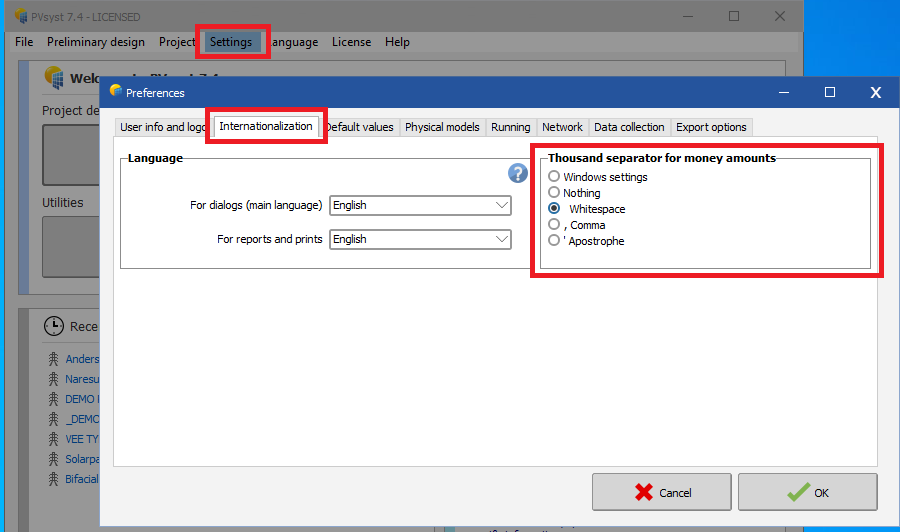
You are getting this error as your decimal separator is a dot, which is the same as your thousand separator and PVsyst cannot compute your number.
You can fix this issue by changing your thousands separator to be different from your decimal separator from Settings>Preferences>Internationalization>Thousand separator for money amount
Regards.
-
Dear raceace91,
It's currently not possible to display partial periods for the PDF report. However, you can perform partial simulation and export the results in CSV for the simulated period in Advanced simulation window.
Regards
-
On 2/13/2024 at 3:02 PM, n.ragavander said:
How do you get exact polygon lengths? How do you toggle the distance function for a more prescise polygon? For example i have a polygon with specific dimensions how can i use these dimensions while constructing it for the near shading analysis
Dear N.Ragavander,
There are many ways of sizing objects and areas in PVsyst 3D scene.
The measure tool of the 3D scene also allows you to make precise measurements of your areas and objects:
https://www.pvsyst.com/help/near_shadings_persp.htm
If you already have a 3D modelling of your photovoltaic field, you can simply import it in PVsyst. You will then have the expected sizing, without needing to make any modification in PVsyst.
Please have a look at our detailed PDF tutorial on this subject:
https://www.pvsyst.com/wp-content/pdf-tutorials/pvsyst-tutorial-v7-export-to-pvsyst-en.pdf
You can find in the following link the list of supported file formats: https://www.pvsyst.com/help/sketchup.htm
If you have a scaled image of your area, you can import it in PVsyst as a ground image and draw a zone on it by superposition, precisely following the outline of the image:
https://www.pvsyst.com/help/ground_image.htm
https://www.pvsyst.com/help/zones_of_tables.htm
Regards -
Dear Hussein.
We thank you for reporting us this issue. Would you please click on Save bug report on the popup and send the generated .zip file to support@pvsyst.com so that we may investigate the issue.
Regards.
-
Dear Murtz,
Demo project _DEMO_COMMERCIAL_MARSEILLE available in your PVsyst installation contains the variant VC8 : _DEMO_COMMERCIAL_MARSEILLE_Economic evaluation which has a sample economic analysis. This can be a good starting point for which you want to achieve.
Regards.
-
Dear Murtz,
Thank you for reaching out and for choosing PVsyst for your solar project. We appreciate your interest in obtaining a predefined price list for various components to facilitate your economic analysis.
We understand the importance of having readily available templates or samples for economic analysis. However, the pricing information for solar components can vary significantly depending on factors such as the country, the size of the system, and local regulations and norms. Due to these variations, it is challenging to provide a one-size-fits-all solution.
Performing an accurate economic analysis involves considering local specificities, market conditions, and other variables that impact the cost of solar components. It is not feasible for us to provide samples or templates that encompass all these factors for every country.
We recommend conducting a thorough and localized financial analysis, taking into account the specific conditions of your project. You may want to consult with local suppliers, review market prices, and consider any applicable incentives or regulations in your region. This approach will ensure a more accurate and tailored economic analysis for your solar project.
Thank you for your understanding and continued trust in PVsyst.
Best regards,
-
19 hours ago, Ctaljan said:
Hi,
I was wondering if there was a way to choose the units displayed in the probability distribution (ex. switch from GWh to MWh) for more precision. I understand the distribution is hypothetical, but would still like to know if there is a way to change the units, and if so, how. Thanks in advance.
Dear sir,
There is no possibility to select the displayed unit for the values of the distribution plot. The unit is automatically set according to the values of the plot.
Regards.
-
Dear Laetitia,
Your discounted payback at the end of year 1 is equal to
(After tax profit of year 1 + Self consumption saving of year 1) /(1 + Discount Rate)^year number (this is the standard formula to take into account the discount rate)
which gives in your example
(70368+167371) / (1 + 0.1)^1 = 216126.36
As mentioned previously, the capital part of the repaid loan is also part of the payback, so your total payback at the end of the first year is equal to 216126.36 + 10361 = 226487.36
Then your payback percentage at the end of year 1 is
Total payback of year 1 / Total investment (excluding subsidies) = 226487.36 / (1487730-415050) = 21.1%
Regards
Hizir
-
Dear RobSolar,
There is no possibility to run simulations from a script. However you can automate running multiple simulations from an excel file using the batch mode.
You can find more information about this feature in the links below:
https://www.pvsyst.com/help/index.html?batch_mode.htm
Regards
-
Dear Shivam,
You can edit the list of clients from the project main dialog. But there is no template system for setting information common to several clients. It's not possible to template the list of report pages specifically for some clients. From the report dialog, you can check as "default" in the menu "Report options>Final report option". Then the selected list of pages will be common to all clients.
Regards.
-
Dear Shivam,
It corresponds to the customer for whom you are implementing the photovoltaic system and it can be displayed in the final report from the report options. You can manage a list of different clients for different projects.
Regards -
Hi,
The formula for Cumulative profit is Own funds + After tax profit + Self consumption savings
So, for year 1 in your example, it should be -772680 + 73 384 + 167371 = -531 925. However, the discount rate is also taken into account in order to update the value of your money. That's why your result for year 1 is -543 389 (as your money value decreases due to discount rate, the real value of your cumulative profit in "today's" value is lower).
Regarding % payback column, the formula is Total Payback / Total Investment, where Total Payback = Own funds + After tax profit + Self consumption savings + Capital repayment of Loan (only the capital part, not the interest part), and Total Investment is the investment cost defined in first tab of the economic evaluation. This formula also takes into account the discount rate.
Indeed, the capital part repaid for the loan is taken into account, this answers your remark regarding the loan with fixed annuity.
So the difference between Cumulative Profit and Total Payback, is that Total Payback takes into account the capital part of the loan as an amortization. The cumulative profit does not take into account the repayment of the capital part of the loan, as it's not an external profit.
This mainly explains why your amortized percentage does not equal 100% right away when your cumulative profit becomes positive.
In order to have more detailed explanation specific to your project, we should know your total initial investment value and the defined discount rate in Financial parameters tab.
You can export and send us your project for a more detailed analysis (PVsyst main menu File>Export project)
Regards.
-
Dear Vera,
The albedo you have defined in "Project settings" correspond to the general albedo of your location, impacting your modules yield.
However, for bifacial modules, there is also the albedo just under the modules and this value is used only for the back face yield calculation. Values for this albedo are defined in "System>Bifacial system" definition dialog.
In the report, both albedo values are available:
Global albedo of the project is available in "Project summary" section, "Monthly albedo values" table
Albedo under the modules used for bifacial production calculation is available in "General parameters" section, "Monthly ground albedo values" table.
Regards.
-
15 minutes ago, passakorn said:
i had use PVsyst for simulation but some project show parameter and some project not show parameter ?
if i need to show parameter shed configuration and Sizeds What should I do?
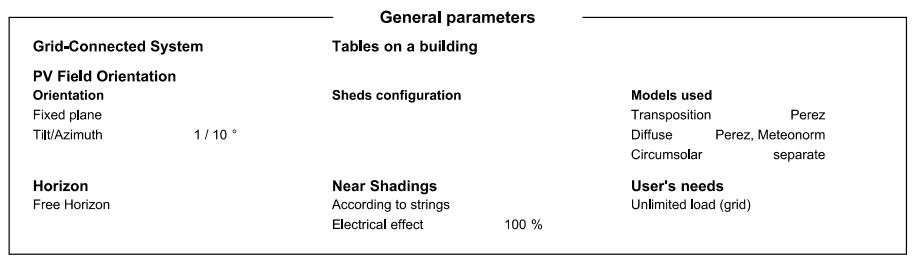
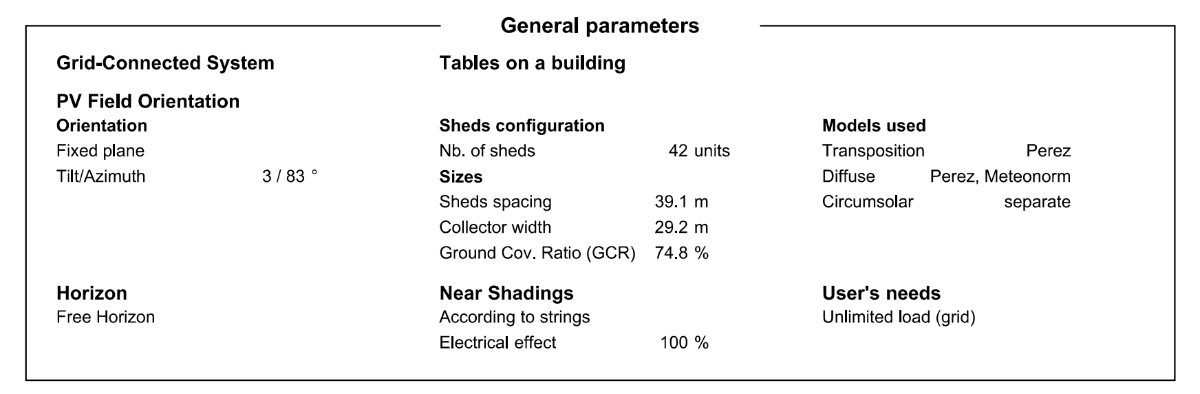
Dear passakorn,
There are several conditions for showing "Nb. of sheds" and "Sizes":
- there should be more than 1 table in the scene
- RMS (root mean square) of average width of the tables in the orientation should be lower than 0.1
For more details, please export (PVsyst main menu <File><Export project> and send your project to support@pvsyst.com
Regards.
-
Dear Sheriif,
It's not possible to get the hourly values in the printed report. Hourly values can be only exported in CSV file.
Did you follow the procedure describe in the provided link https://www.pvsyst.com/help/output_file.htm ?
Regards.
-
Dear Sheriif,
1. You can generate hourly values output from the simulation, by following the steps described in our help page: https://www.pvsyst.com/help/output_file.htm
2. This video tutorial on the economic evaluation tool explains step by step the financial modelling :
3. This video tutorial describes the steps to calculate the carbon balance of your project :
Regards
-
Dear Siebe,
We suggest you to directly report your issue by email to support@pvsyst.com, by providing the project file for which you have the generation issue.
You can export your project from menu <File><Export projects>
Regards
-
Dear Ananthu,
The reason for this error message is that you have defined a subarray of 220kWp (982m2) for Orientation 4 in system dialog, whereas the size of your tables in the 3D scene for this orientation is 142m2. You have to increase the size of the tables in the 3D scene for Orientation 4 to 982m2, or reduce the size of your subarray for Orientation 4 in system window to 142m2 in order to have a matching.
You have a similar problem with Orientation 7 (see message in red in your screenshot). The size of the subarray defined in system window for this orientation is not matching the size of the corresponding tables in the 3D scene.
Regards.
-
3 hours ago, arnon said:
Please help me know how to fix it.
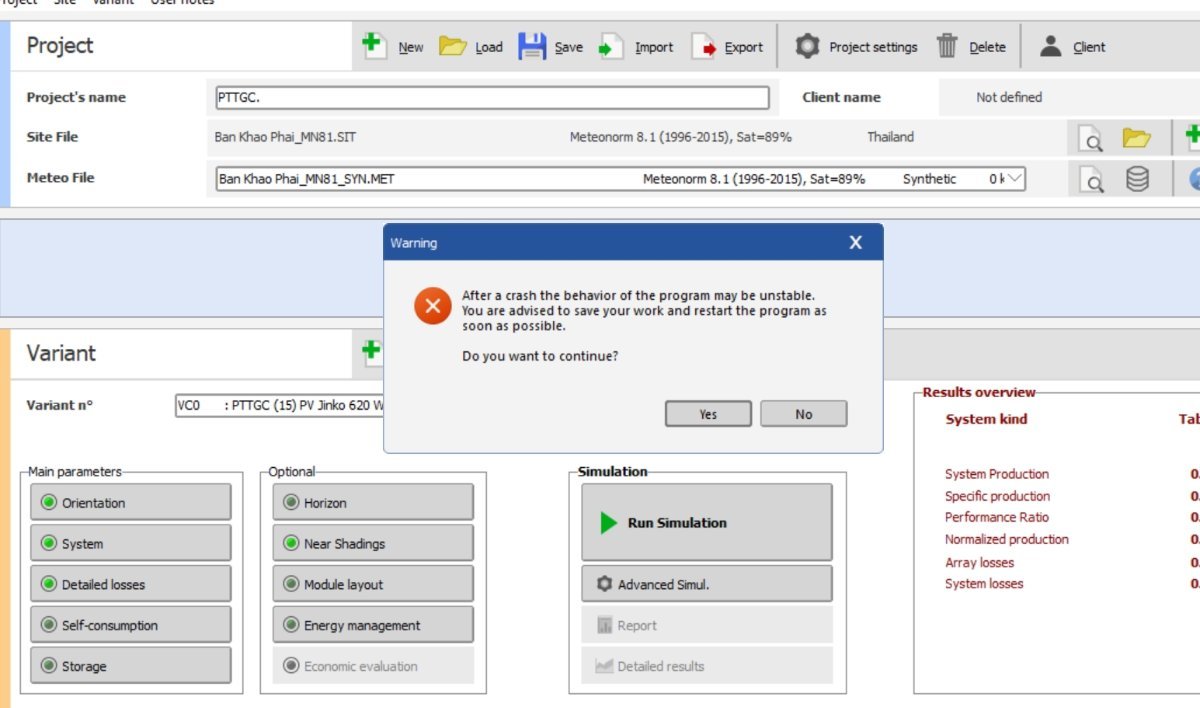
Dear Arnon,
You are kindly requested to export and send your log files to support@pvsyst.com (menu "File>Export logs").
Regards
-
55 minutes ago, Michalis Angeli said:
Very well, thank for your immidately response.
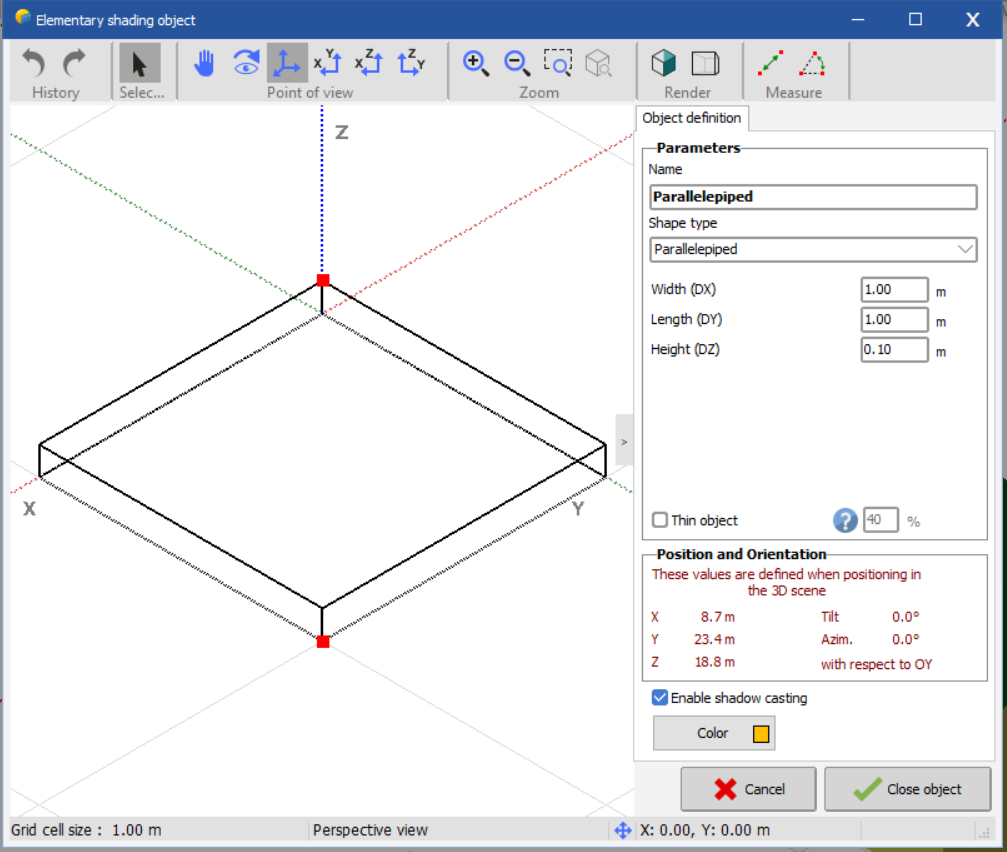
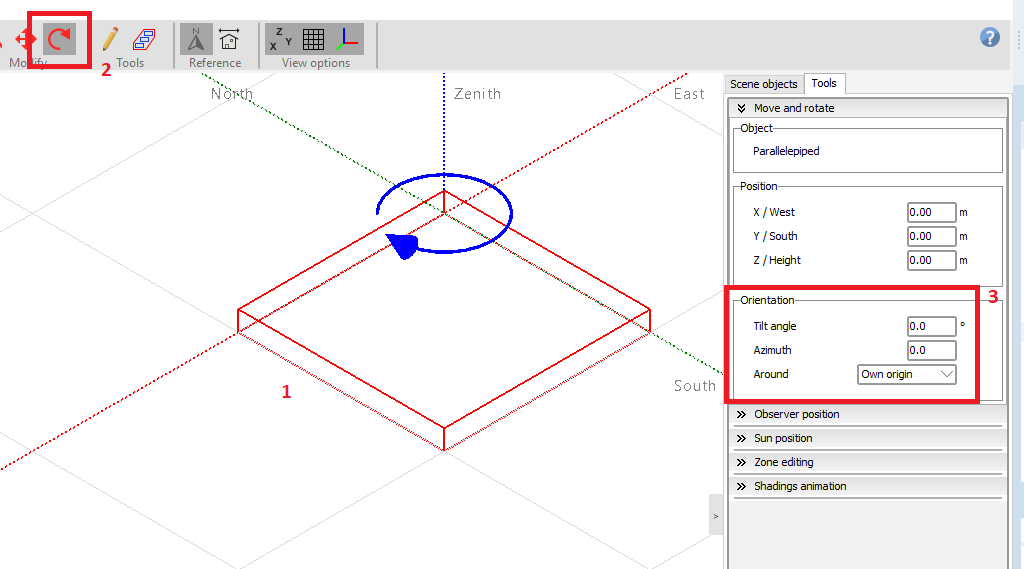
Furthermore i would like somethnig else. Is there the opportunity to define angle or azimuth in an elementary shape like in parallilepided?
I want to position it in a roof with specific angle and azimuth.
Dear Michalis,
After adding the object to the 3D scene, you can select it, then click on rotate icon and set its tilt and azimuth as shown below:
Regards
-
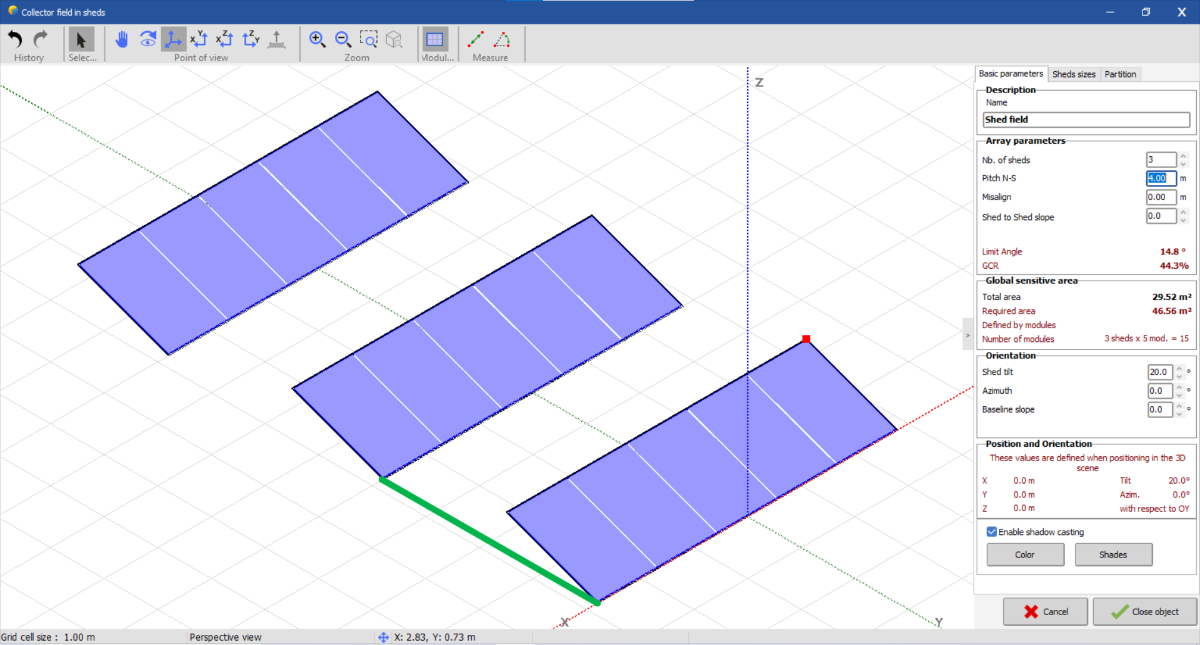
8 minutes ago, Michalis Angeli said:
Hello, i would like to ask about shading scene.
The distance (to this example 4 m) that named pitch N - S between 2 tables of panels is that I noted with green line, in below picture?
Dear Michalis,
Yes this is correct. The pitch corresponds to distance between counterpart points of two tables of the same field.
Regards
Different Module orientation in Module layout that 3D layout
in Shadings and tracking
Posted
Dear Pranav,
The module layout representation is actually different from the real 3D representation as it tries to align tables in row/columns rather than positioning tables on their real coordinates. This specific display in the module layout is used to render the tables in a horizontal 2D view and has no impact on the simulation results.
As your PV tables are not strictly aligned due to the ground slope, the module layout tool displays your tables in different rows/columns.
If you want to identify which table of the module layout corresponds to a specific table of the 3D scene, you can display the names of the tables as they are in the 3D scene:
You can also open the module layout and the 3D scene in parallel. If you click on a table in the 3D scene, it will be highlighted in the module layout:
Regards