
Hizir Apaydin
-
Posts
141 -
Joined
-
Last visited
Everything posted by Hizir Apaydin
-

How to generate .SIT files for PVsyst outside PVsyst ?
Hizir Apaydin replied to VUG's topic in How-to
Dear Vo, Yes, you can generate .SIT files outside of PVsyst by using the PVsystCLI tool. One of the features of this command-line tool is the ability to create site files directly from location coordinates and a monthly weather dataset, without requiring any interaction with the PVsyst GUI. You can find more details about this feature in the following documentation: https://www.pvsyst.com/help-cli/use-cases/create-site.html https://www.pvsyst.com/help-cli/reference/index.html#create-site Best regards, -
No view for the report only black screen
Hizir Apaydin replied to Petr Pasek's topic in Problems / Bugs
Dear Petr, The problem seems to be related to a driver issue. You can try to update this driver by following the procedure documented in our FAQ: https://forum.pvsyst.com/topic/1253-updating-your-graphics-card-driver-pvsyst-660-and-above Alternatively, you can follow the procedure linked below: https://nvidia.custhelp.com/app/answers/detail/a_id/5035/~/run-with-graphics-processor-missing-from-context-menu%3A-change-in-process-of In order to try to run PVsyst with the second graphic card driver of your PC (if you have one). This selection is available in Windows settings (in Graphics settings) after you have chosen PVsyst program file: https://desk.zoho.eu/galleryDocuments/edbsn7903bf68f74bdf02e267dfb94ecb7a844a3b3dfe543b433eda69af27a6de02cfce10a448941bc47fa2fd77e1e764447e75de7024769cf0298f804ff62b2e141f?inline=true If you use a virtual machine (VMWare, VirtualBox, ...), remember to activate hardware acceleration and be up to date. If you are using the AMD “Adrenalin Edition”, please try using another driver using this procedure: https://www.youtube.com/watch?v=O94izh6mwOk We remain at your disposal for any other assistance that may be required. -
Nominal discount rates, LCOE and PBP calculations
Hizir Apaydin replied to Gavin M's topic in Suggestions
Dear Gavin, Thanks for the detailed analysis. These are valid points and we agree that the current LCOE formulation in PVsyst does not strictly match the standard, financing-neutral definition commonly used in the literature. We also confirm that the discount rate used in PVsyst is the nominal one. We’ll take a closer look at this internally, both to better clarify what the current indicator represents and to evaluate how we could move closer to commonly accepted LCOE formulations (project-level, WACC-based) in the future. Appreciate you taking the time to raise this and share your perspective. Best regards. -
Command for saving a PDF files using the CLI
Hizir Apaydin replied to Gustavo Pianovski's topic in How-to
Dear Gustavo, You can manage the report generation by using these options: -rpf option will let you choose the ouput path for the generated PDF. Regarding the simulation time, we have not observed a difference between PVsyst and PVsystCLI for the batch mode. For a more detailed analysis, you can export and send your project (PVsyst main menu File>Export project) and your batch configuration files (CSV, RVT, and SFI) to support@pvsyst.com Regards.
-
Dear Jayvie, Thank you for reaching out. The "Custom parameters definition" label is not something you can configure. It is automatically assigned by PVsyst. It simply means that the module or inverter in question does not belong to the standard PVsyst database. Instead, it has been created or customized by the user Regards.
-
Bonjour, Pour toute demande relative à la gestion de vos licences, nous vous invitons à contacter le support PVsyst via le formulaire dédié : https://www.pvsyst.com/fr/support/contact/activation-problem/ Cordialement.
-
Dear Bommu, When you open PVsyst, you can see an information box at the bottom of the main window that indicates the remaining validity period of your license. Additionally, you can configure your email subscriptions in your Web Account at https://www.pvsyst.com/shop/ to receive notifications when your license is about to expire. Best regards,
-
PVsystCLI Trial stopped working — license file missing error
Hizir Apaydin replied to Renan's topic in Problems / Bugs
Dear Renan, Thank you for reaching out. Even if you got the information message The license file "C:\ProgramData\PVsystCLI\PVsystCLI.lic" is missing. You can run "lic-activate" command to activate your license. the simulation should perform if you are still in TRIAL mode. Could you please export and send us your PVsystCLI log files to support@pvsyst.com (you can generate PVsystCLI logs with the command "PVsystCLI export-logs") Best regards. -
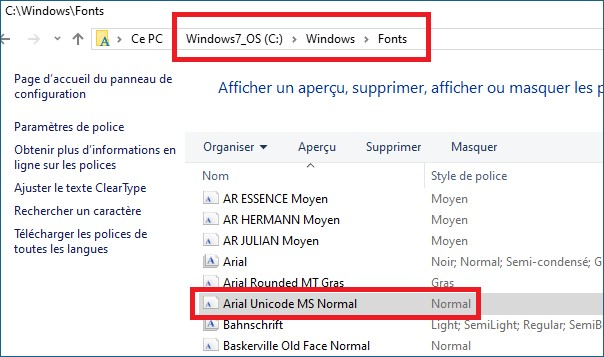
Dear Ben Arial Unicode Bold and Arial Unicode Normal font seem to be missing from your computer. Could you please check that you have it installed in your C:Windows>Fonts folder (Normal and Bold should appear for Arial Unicode MS) : If not you can install it from here: https://freefontsdownload.net/free-arial-unicode-ms-font-36926.htm If the problem remains, please export and send your log files to support@pvsyst.com by using menu "File>Export logs" Kind regards,
-
Dear Ahmad, We are not familiar with Odoo in detail, but from what we understand it appears to be an ERP/CRM system. PVsystCLI is a command-line program that can be executed dynamically through scripts and can generate different types of outputs. If Odoo has scripting capabilities and can process the outputs from PVsystCLI, then a connection between the two tools would indeed be possible. Could you please clarify the specific functionality or workflow you would like to achieve by interfacing PVsystCLI with an ERP or CRM? Best regards,
-
Dear Renan, Thank you for reaching out. For "--output-csv-file" and "--report-pdf-file" options, you need to specify the file name with extension, not only the folder: --output-csv-file:"C:\Users\renan\.........\Resultados\Results.csv" --report-pdf-file:"C:\Users\renan\.........\Resultados\Results.pdf" If the problem remains, please export your log files by using the command: PVsystCLI export-logs Once the logs zip file is generated, please send it to support@pvsyst.com Best regards.
-
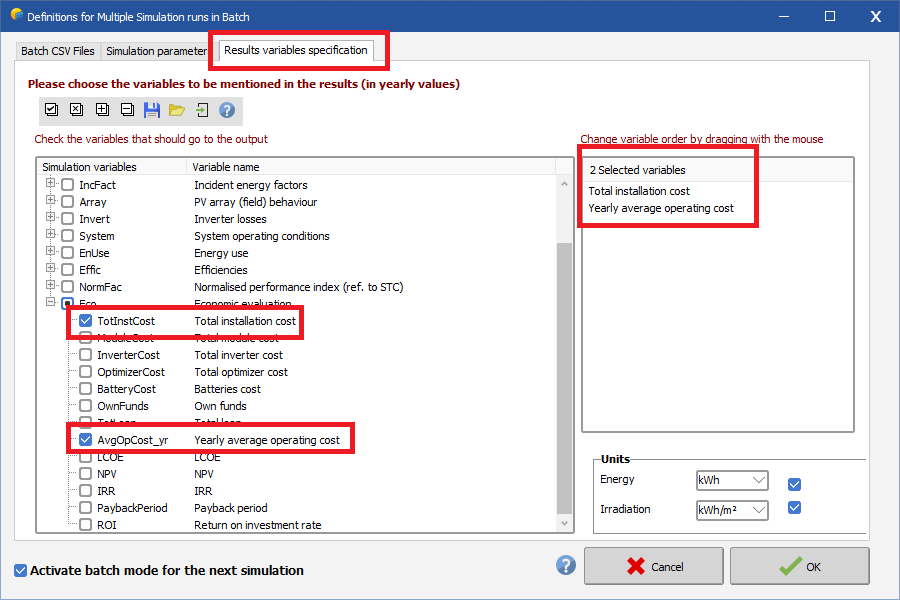
Dear mmh, It's already possible to add these variables to the simulation output of the batch mode: In PVsyst, financial indicators such as Total Installation Costs and Operating Costs are not input parameters for the simulation engine, but rather part of the economic evaluation, which is conducted after the energy simulation. In other words, these values are used to compute the system's profitability based on the simulation results, not to influence the simulation itself. Therefore, while these cost variables can be included in the batch output results, they are not parameters that can be varied or controlled within the batch mode like orientation, module type, or system size. The batch mode is designed to iterate over physical and design parameters affecting energy production. Once the production forecast is calculated, the economic evaluation tool uses it to derive financial metrics. Best regards, Hizir.
-
Dear Swonno, In the report settings, it is possible to adjust the global energy production unit via Report options > Final report options > Energy unit, and you can also set the number of decimals for percentage values shown in the loss diagram. Regards
-
Dear Ellie, Thank you for reaching out. The behavior you mentioned is a known issue in PVsyst, and we have already scheduled it for integration in an upcoming version. We apologize for any inconvenience this may cause and appreciate your patience. Best regards,
-
Dear customer, The number of decimal places displayed for the nominal power on the report's cover page depends on the power itself and predefined thresholds. It's not configurable, PVsyst automatically adjusts the precision based on the size of the value to make it more readable. Best regards,
-
Dear Fujita Ane, Could you please check that Arial Unicode MS Normal is present in your C:\Windows\Font folder as below: If this font is correctly installed, we kindly invite you to report your issue via email to support@pvsyst.com Regards
-
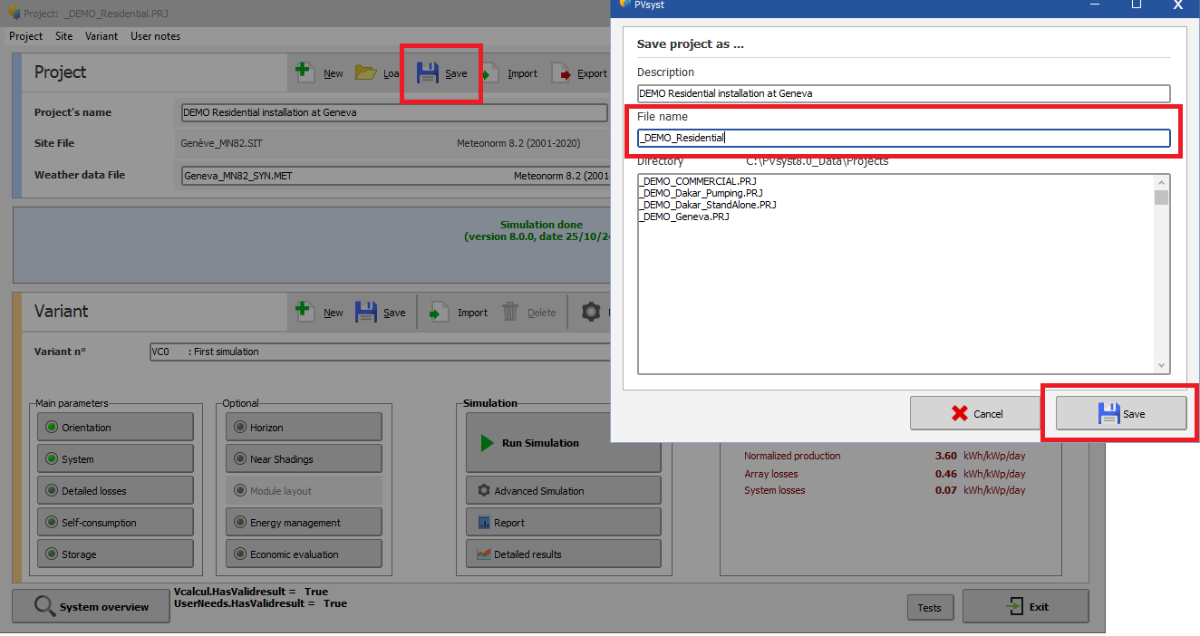
Dear Nikoloz, When clicking on "Save" from the main project window, you are free to update the project file name and replace "_" by "." . Then, when generating the report and saving the PDF file, it will keep the dots. Best regards
-
Dear Nabil, Could you please indicate us which version of PVsyst you are using? The second warning message you mentioned should not appear in last versions of PVsyst. We invite you to send your log and project files to support@pvsyst.com for a more detailed analysis. (main menu File>Export logs and File>Export projects) Best regards
-
Dear Swonno, Does this happen with all fields or only Y axis field? Which version of PVsyst do you use and what is your Windows system language ? For a specific support on this issue, please send your requests to support@pvsyst.com Best regards,
-
Dear Nikoloz, Thank you for bringing this issue to our attention. It was indeed introduced in PVsyst 8. We have noted the problem and will address it in a future update. Best regards,
-
Dear Vasil, Thank you for reaching out. Here are some steps you can follow to troubleshoot and resolve this error: - Ensure the CSV file is located in a directory you have access to. Avoid locations like system directories (e.g., C:\Windows) or removable drives that might not always be accessible. - Verify File Access and Permissions: Right-click the file, select Properties, and go to the Security tab. Ensure that your user account has "Read" and "Write" permissions for the file. If you're not the owner of the file, you may need to request access or take ownership (if permitted). - Ensure the file isn’t open in another program (e.g., Excel). Close any applications that might be using the file and try again. Confirm that the file format is correct and compatible with the software you're using. Some programs may have stricter requirements for CSV formatting. - If the file path is very long or contains special characters, consider moving the file to a simpler directory (e.g., C:\Users\YourUsername\Documents) and renaming it with only alphanumeric characters. If the issue persists, try running PVsyst as an administrator. Right-click the program shortcut and choose Run as Administrator. If these steps do not resolve the problem, please send your CSV file to support@pvsyst.com, and we’ll be happy to assist further. Best regards.
-
Fixed Tilt and Tracker Shown in Report
Hizir Apaydin replied to Shashank Sharma's topic in Simulations
Dear Shashhank, We invite you to export and send your project to support@pvsyst.com for a detailed analysis. You can export your project from PVsyst main menu File>Export project Kind regards. -
Dear Gabriel, No tables appear on the graph in the module layout printing screen. To resolve this, try zooming out or repositioning the scene to make them visible. Once adjusted, they should display correctly in the report. If the issue persists, please export your project (via the main menu: File > Export project) and send it to support@pvsyst.com for assistance. Best regards.
-
No single-line diagram after doing economic calculation
Hizir Apaydin replied to Branimir Amidzic's topic in Problems / Bugs
Dear Branimir, We have never encountered single-line diagram priting issue related to the economic evaluation calculation. You are kindly requested to export and send your project file (PVsyst menu File>Export project) to support@pvsyst.com for a detailed investigation. Regards -
Dear Abeer, If you mean aligning the PV tables and shading objects with the 3D scene grid lines, this option does unfortunately not exist. Regards