All Activity
- Today
-

Command for saving a PDF files using the CLI
Hizir Apaydin replied to Gustavo Pianovski's topic in How-to
Dear Gustavo, You can manage the report generation by using these options: -rpf option will let you choose the ouput path for the generated PDF. Regarding the simulation time, we have not observed a difference between PVsyst and PVsystCLI for the batch mode. For a more detailed analysis, you can export and send your project (PVsyst main menu File>Export project) and your batch configuration files (CSV, RVT, and SFI) to support@pvsyst.com Regards.
-
 Kem joined the community
 - Yesterday
-
Hello, What is the command for saving a PDF files using the PVsyst CLI? I'm doing some testing on two projects. In project A, the PDF is saved correctly. I'm executing the following command: PVsystCLI.exe run-simulation -w:"C:\Users\PC-03\PVsyst8.0_Data" -p:"F 2025 999 TesteCLI_Project" -v:"VC2" -bpf:"C:\Users\PC-03\PVsyst8.0_Data\UserBatch\F_2025_999_TesteCLI_Project_BatchParams_0.CSV" -brf:"C:\Users\PC-03\PVsyst8.0_Data\Models\Simulacao_Plurianual.rvt" -isf:"C:\Users\PC-03\PVsyst8.0_Data\Models\Saidas.SFI" In project B, it saves CSV files but not the PDF: PVsystCLI.exe run-simulation -w:"C:\Users\PC-03\PVsyst8.0_Data" -p:"F 2025_Project" -v:"VC1" -bpf:"C:Users\PC-03\PVsyst8.0_Data\UserBatch\F_2025_Project_BatchParams_3.CSV" -brf:"C:\Users\PC-03\PVsyst8.0_Data\Models\Simulacao_Plurianual.rvt" -isf:"C:\Users\PC-03\PVsyst8.0_Data\Models\Saidas_Certificacao.SFI" Additionally, why is simulating a batch using the PVsyst CLI slower than simulating the same batch directly in PVsyst? In my analysis, using the CLI is 1.5 times slower.
-
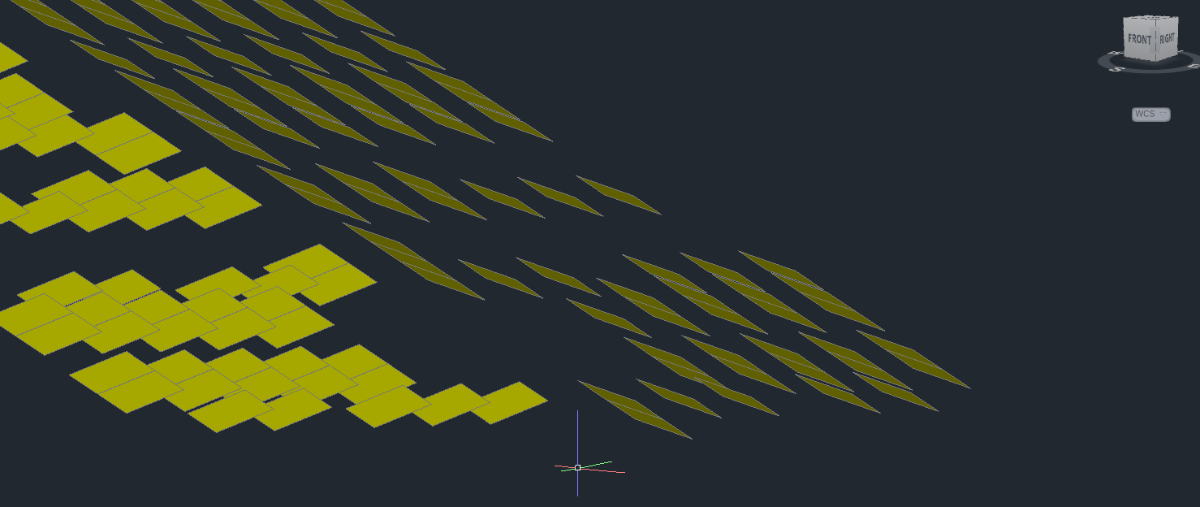
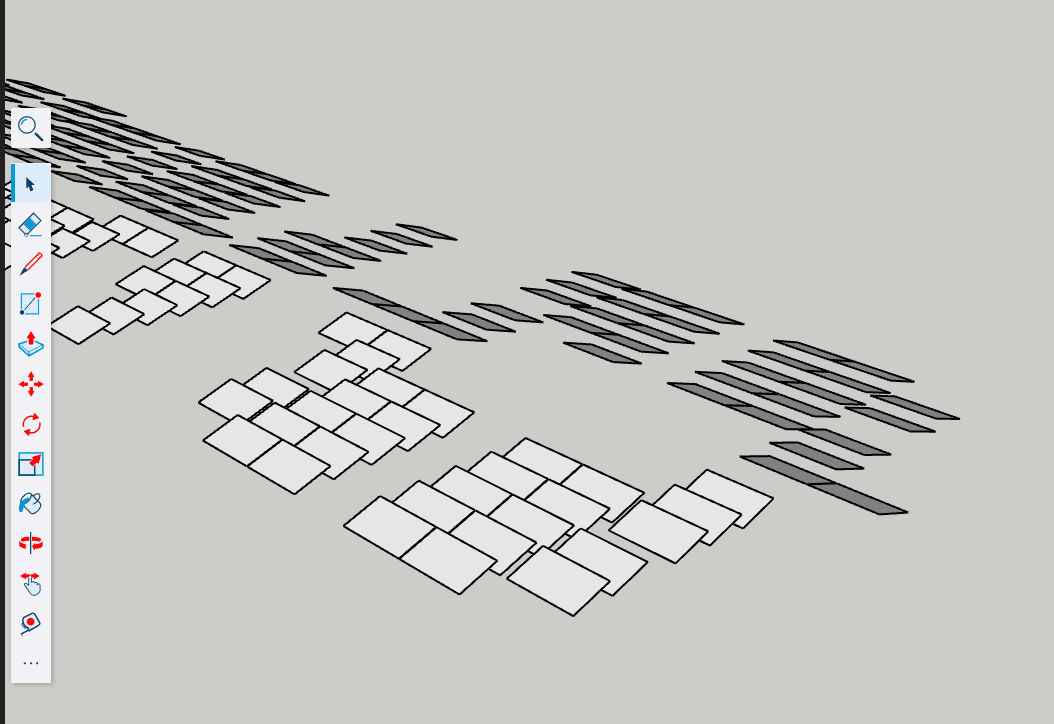
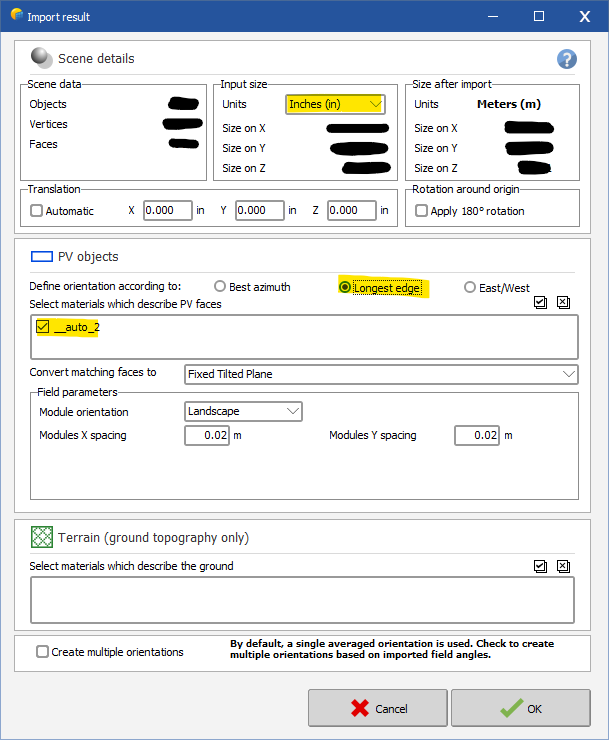
For anyone else who couldn't figure out the FBX converter, I found a solution. All of the other forum posts helped get started, so I thought it would only be fair for me to post the solution that worked for me. The following solution is for a rooftop PV system, so you might have to process the finished file differently than I do, but most should be the same. 1. Create your .DWG file as explained above. Don't forget after you create your 3D faces, delete all other 2D lines. This will help later when you import to PVsyst. Leave only 3D faces. Should look something like this: 2. Use SketchUp to convert .DWG to .DAE file. You can use the web-based version of SketchUp here: https://app.sketchup.com/app. You can also download the app, whichever is your preference. You can use the free trial if you only need it for one project, but you'll have to purchase the subscription after that. It's not that expensive. Import your .DWG or .DXF file to SketchUp with the correct units. Use the measure tool to verify module edge lengths. Finally, export your SketchUp scene to 3DS or Collada (.3DS or .DAE). PVsyst will accept either. I usually do Collada .DAE. 3. Import to PVsyst. Open a new 3D shading scene in your project file -> File -> Import -> Import a 3D scene. Select your SketchUp file (.3DS or .DAE). Select the right units under Input Size. Under PV objects, I usually check off "longest edge", and make sure you select the materials to describe the PV face (should be something like "auto_1". Do not touch anything in the terrain section, as it will make your objects import as a building object, not PV faces. 4. Once imported, you will need to move things around a little in PVsyst. My usual process is as follows. I import a ground image, and start creating my building objects that my PV faces will be on. After I create the buildings in PVsyst, I rotate and move the imported modules to fit on the buildings I created. (Tip: Raise the modules higher than the building on the Z axis, change the point of view to XY, then you can fit the modules pretty accurately on the building.) The most important part is to auto-set the height of the modules. Select the modules -> edit -> set auto altitude -> click set auto altitude on the right toolbar, and the modules will stick right onto the rooftop. This saved me so much time. Hopefully, this explanation helps someone out. Let me know if you have a question on this method.
-
 Chris Moskowitz joined the community
 -
 Hello, By definition a .PAN represents a PV modules with its performance. Even withing the same technology, there are a lot of variations of solar cell performance - from providers, from batch-to-batch, from improvement in the production line etc... So if you change the solar cells, it becomes a completly different product and all the values entered in the .PAN file should be reviewed for consistency. Now it all depends what is your simulation goal by doing this. I can only answer your question if you give me more details and context.
 - Last week
-
 Divyesh Khandhedia joined the community
 -
 Matt1488 joined the community
 -
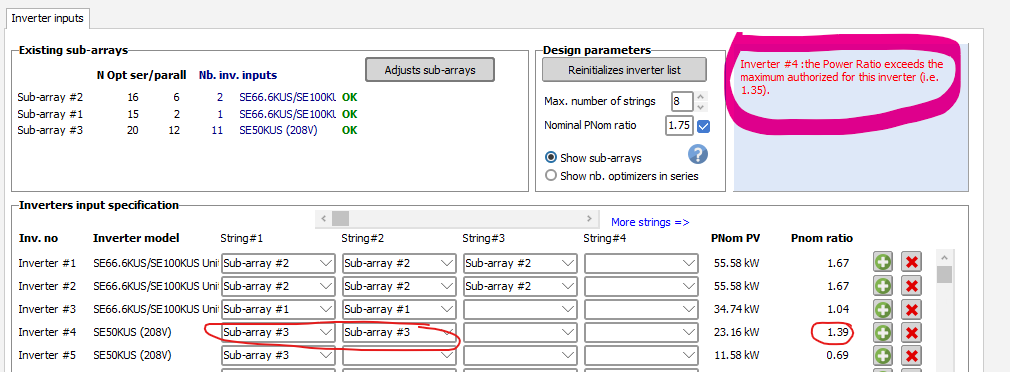
For SolarEdge system there is two different advanced parameters limiting the Pnom ratio, one for inverters with less than 25kW nominal power, on for more than 25kW. Since the 50kUS is set to 16.7kW (1/3 of the physical inverter), the <25kW parameter. Please check these parameters in the advanced parameter menu (Settings => edit advanced parameters) You should be able to simulate your system if you change the parameter 404 to something higher than 39%
-

Shadow Loss Factor Graph Not Showing Up Anymore
Jéremie Bernier replied to Trall1945's topic in Problems / Bugs
Hello. Once a simulation has been performed, the loss diagrams available in PVsyst are shown as yearly or monthly values. You can select a specific month to visualize the different losses, including shading losses. However, at this level there is no option to display daily loss values throughout the day. Could you please share a screenshot of the window or the report where you previously saw the graph you are referring to? That would help clarify which feature or result you are mentioning. -
Hello, have you tried changing it from the project settings? Also what is that menu? where did you access it from?
-
The first times I simulated the shadows, it showed a graph of the shadow loss factor throughout the day but it stopped appearing and I don't know why.
-
 Trall1945 joined the community
 -
 Sarah2002 joined the community
 -
So for comparison, both place at ground from fornt
-
 fidailevich joined the community
 -
 Farid joined the community
 -
PVsyst is a software for the study of PV systems. It is meant for the storage of PV energy, not the grid energy. It is not a suited for the simulation of any BESS systems on the grid.
-

Help : Warnings during the initialization HUMIDITY ???
Auriane Canesse replied to Nikoloz's topic in Meteo data
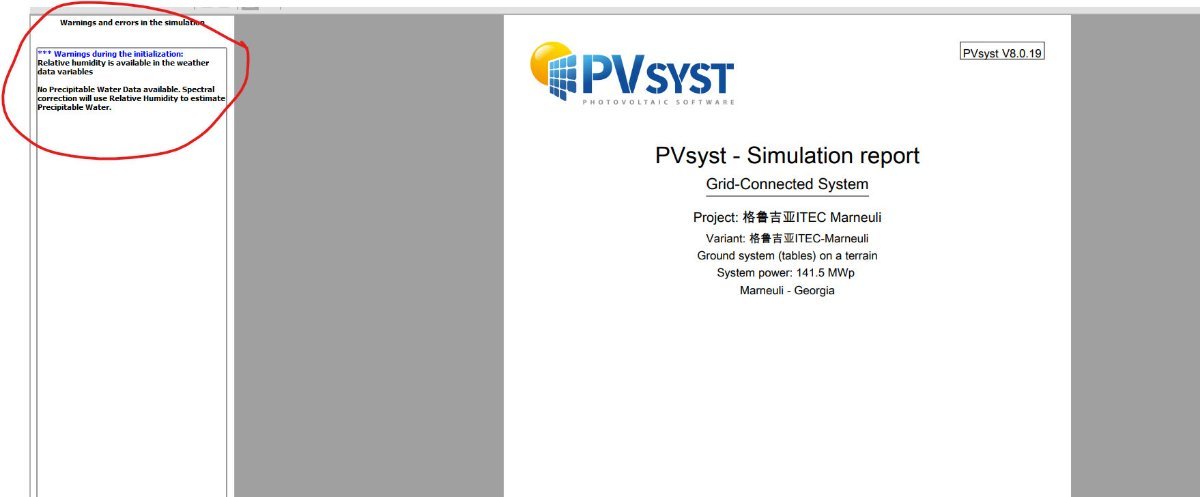
The precipitable water data is used to estimate spectral corrections in some cases. https://www.pvsyst.com/help/project-design/array-and-system-losses/spectral-correction.html?h=spectral#first-solar-spectral-correction-model-management If that data is not present in the weather input, relative humidity is used instead. This warning is more of an information. -
Hi there, I read that Version 8 cannot simulate a BESS system, without a PV system. Will this be possible in future versions? Thanks.
-
Indeed, to model the front side irradiance (useful for monofacial) the height above ground is not used. There is therefore no problem in your comparison, even if you cannot enter the height above ground. One table = one module in your example. Therefore collector band width = 2382mm when in portrait and 1134mm when in landscape. If you check among all inverter manufacturers, there should be at least a few microinverters. However you can also define a new microinverter on your own, by modifying an existing one. You can therefore make a very low power one.
-

Modeling losses when Vmp is lower than the MPPT range
Michele Oliosi replied to Shwetha Vara's topic in Simulations
You can set up the module layout tool in one of your projects for a sample visualization in a concrete case. The impact of inverter limits is displayed and is similar to the simulation so it will help understand. Other than that there are some explanations in our help, for example: https://www.pvsyst.com/help/physical-models-used/grid-inverter/inverter-operating-limits.html However, there is no visual representation of what actually happens during a simulation. You could check the output variables IArray and UArray though. Together these represent the DC array's operating point. - Earlier
-
Hello please help after simulation suddenly appeared this warning : *** Warnings during the initialization: Relative humidity is available in the weather data variables No Precipitable Water Data available. Spectral correction will use Relative Humidity to estimate Precipitable Water. I i could not find any humidity issues in Meteo data details. Such error newer appeared before
-

Modeling losses when Vmp is lower than the MPPT range
Shwetha Vara replied to Shwetha Vara's topic in Simulations
Thank you! One follow up - is there an output curve or visualization to view the losses when the MPPT operating point is displaced? Trying to understand how that calculation works. -

Orientation Mismatch Near Shading 3D Scene
Stéphane replied to MinkeK's topic in Shadings and tracking
Hello. Please send us your PVC file at support@pvsyst.com so that we can have a closer look and try to find the root cause. -
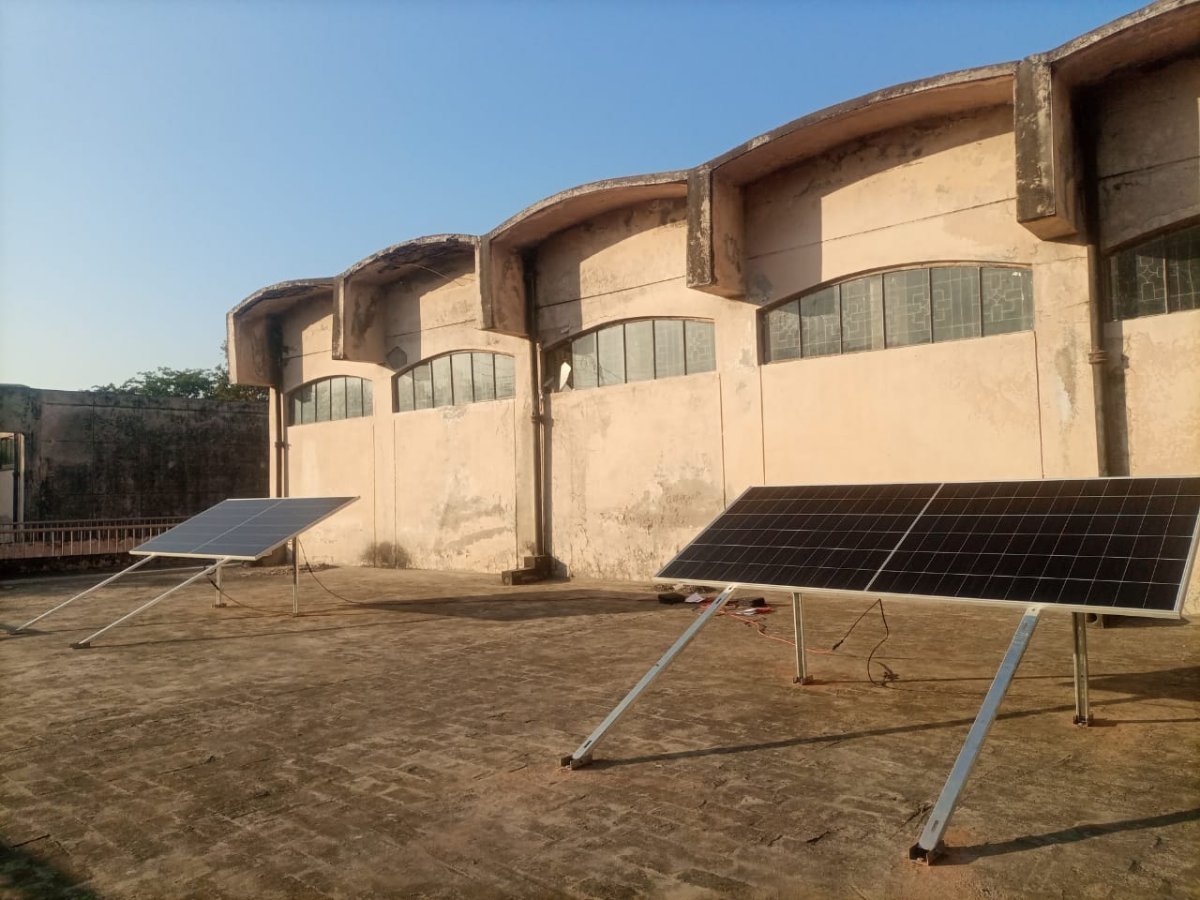
Thankyou So much for your guideline, one more thing to confirm that in unlimited shes orientation we can put the bifacial module height above ground but not the monofacial, so, how I can compare both mono and bifacial panels in parallel condition because in Actual I'm comparing the results of both mono and bifacial at same height, same orientation, same tilt angle, same height above ground but how? One thing and tell me the collect band width of panel if (2382mmx1134mm) have dimensions. and if in portrait direction and for this scenario explain how can simulate in Pvsyst, also plz guide about the DC grid system bcz for two panels or one there is no inverter available an also we experiment through MPPT meter readings. Right side Monofacial, left side bifacial placed at parallel condition
-
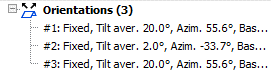
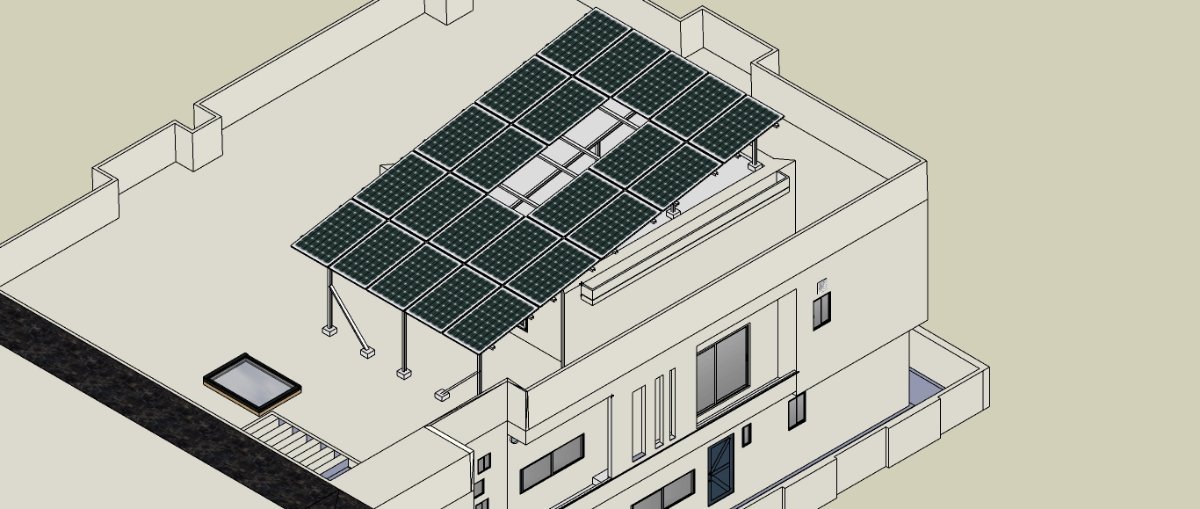
Hello, I am facing an issue with the near shading tool in PVSyst. For the construction/perspective of the near shading 3D scene I am importing a 3D pvc file as generated in AutoCad using PVCase GroundMount. In my AutoCAD design all my PV modules tables have the same tilt average (20 degrees) and have the same azimuth. However, when I upload the file to the shading scene construction PVSyst recognizes three different orientations. Due to this my near shading is not aligning with the orientation settings in my main parameters and I am getting an error message. As mentioned in my Autocad design all the panels have the same orientation, but once uploaded to PVSyst it reads it as different orientations. In AutoCad GroundMount I have already used ‘adapt to terrain’ which was able to fix this problem for me for another project, but for my current project this is not fixing my issue. Thank you in advance for your help.
-
You are correct about width / length, although a shed may be several modules tall... this means that the collector band width could be 2, 3 or more times the size of a module. About your system: the best way to model this in PVsyst is not via the "unlimited sheds" orientation. The unlimited sheds is useful when you have multiple rows of tables. Instead, your system is basically one table (with a gap). As far as the front side irradiance goes, the best is to do a 3D drawing and use the module layout shading calculation mode. Unfortunately PVsyst does not model the backside irradiance in 3D, which means that in your case the backside irradiance model (bifacial model) would be quite wrong. Indeed, there are multiple 3D specificities in your system: the raised part of the roof, the gap in the modules, the different albedo, and the mounting structure. All of these cannot be modeled in PVsyst. You could use the unlimited sheds as an approximation. In this case, please set the number of rows to 1, and the collector band width to 5 times the length of a module (+ gaps). The hole in the middle and differences in roof height cannot be modeled. Then you can use the bifacial model, but note that the results will be approximative.
-
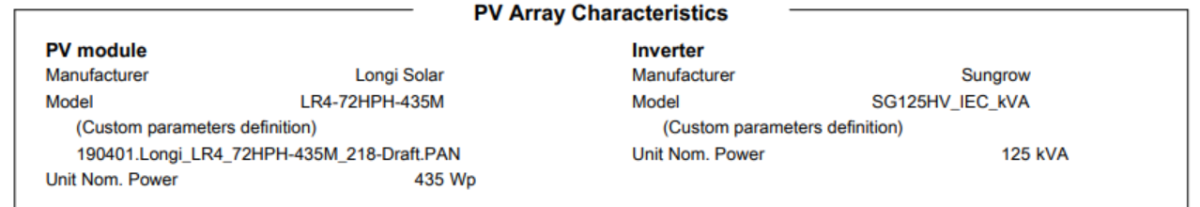
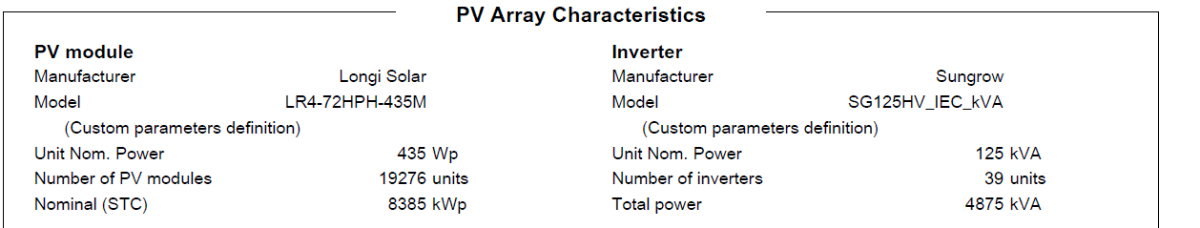
Dear Jayvie, Thank you for reaching out. The "Custom parameters definition" label is not something you can configure. It is automatically assigned by PVsyst. It simply means that the module or inverter in question does not belong to the standard PVsyst database. Instead, it has been created or customized by the user Regards.
-
Okay, good, but when panel install in portrait then collect band width is the length of panel and when panel install in landscape then collect band width is the width of panel. Is I'm correct? These Panels are installed in Portrait orientation and you suggest others if landscape orientation, and also tell that If I want to simulate this structure in unlimited sheds and pvsyst, because 2 panels gaps for albedo and air circulation , and there is no option in pvsyst that we select 23 panels, whatsever 1st guide about the collbandwidth of portrait and landscape, according to my suggestion when portrait then we take panel length and when landscape then we take panel width as collect band width, plz guide
-
Hi, I would like to ask how to add the custom parameters of the PV array in the report. The report on top is generated by me and the one at the bottom is by my colleague. Thank you.
-
We are using the SE50KUS (208V) inverter. Getting an error when i assign 2 strings (1.39DC/AC) ratio to it. Error says i cant go over 1.35 dc/ac ration. this does not seem right and i cant find out how to change it.
-
@AHSAN ALI An important point here is understanding what "shed" means. A "shed" in PVsyst is one row of PV tables in a row arrangement. A "shed" is not the same as a module: Because one table may have several PV modules. Because one row of tables has several tables in it. In the diagram of the "Orientation" window, you can see three (generally) such rows depicted in blue. This is a cross-section or side view of the row arrangement. This also means that the size of the tables is what you will enter in the parameters "coll. band width" and "top/bottom inactive bands". What matters is the vertical size, in other words the "height" or "width" depending on your perspective, but usually the short side of a table. The "Orientation" window is not where you will define the total number of modules. Here only the geometry matters. The "System" window is where you will define the number of modules properly. In your example with 8 + 8 modules, you should define "Nb. of sheds" as 2.