All Activity
- Past hour
-
 Dear JNutter, It’s difficult for us to understand why you are encountering this issue. Could you please send us your project at support@pvsyst.com so we can examine it? Also, please explain the issue in your email. Regards,
 -
Inverter output power by .OND file
Muhammed Sarikaya replied to Andrés Fernández's topic in PV Components
Dear Andrés, Can you please send us your .ond file at support@pvsyst.com so we can examine it? Also, could you explain your issue in your email? Regards, -
Midday spike in shading loss
Muhammed Sarikaya replied to Alex Stark's topic in Shadings and tracking
Dear Alex, Is it possible for you to send us your project at support@pvsyst.com so we can test it and compare the results between V7 and V8? In your email, could you also explain the procedure you followed that led to these differences? Regards, - Today
-
Hello, do you still experience this issue? It seems the grid square size is huge (500m). Can you please zoom in untill you get 1m ?
-
Hello, A floating system is rather similar to a conventional PV system. Following forum post describes how you can adapt your simulation to a floating PV system: To start a PVsyst project, we have several tutorials in PDF and on youtube: https://www.pvsyst.com/wp-content/pdf-tutorials/pvsyst-tutorial-v8-grid-connected-en.pdf
-
 K SRINIVAS joined the community
 - Yesterday
-
Hi everyone, I’ve run into something odd in PVsyst and I’m hoping someone can help clarify what’s going on under the hood. The situation: I’m using an inverter “.OND” file supplied by the manufacturer. In both the Main Parameters and Output Parameters tabs, the inverter’s Maximum AC Power is listed as 1265 kW (at low temperature, so no derating). However, when I look at the DC-to-AC performance curves (DC input power vs. AC output power), the data only go up to 1100 kW—which is the nominal power rating. My questions are: Which number does PVsyst actually use when simulating maximum AC output? Does it honor the 1265 kW value from the parameter tabs, or is it capped at 1100 kW based on the performance curve data? If PVsyst does cap the AC output at 1100 kW, is there a way to override this (e.g. by editing the curve or adjusting settings) so the full 1265 kW is available under ideal conditions? I appreciate any insights or experience you can share—thanks in advance!
-
Sorry, no progress in the present time.
-
Dear Ishan, Real sorry, your question is taking some time to answer. Unfortunately, there are some details that need to be understood. We are trying to provide as informed an answer as possible. We should be able to reply by the end of the week.
-
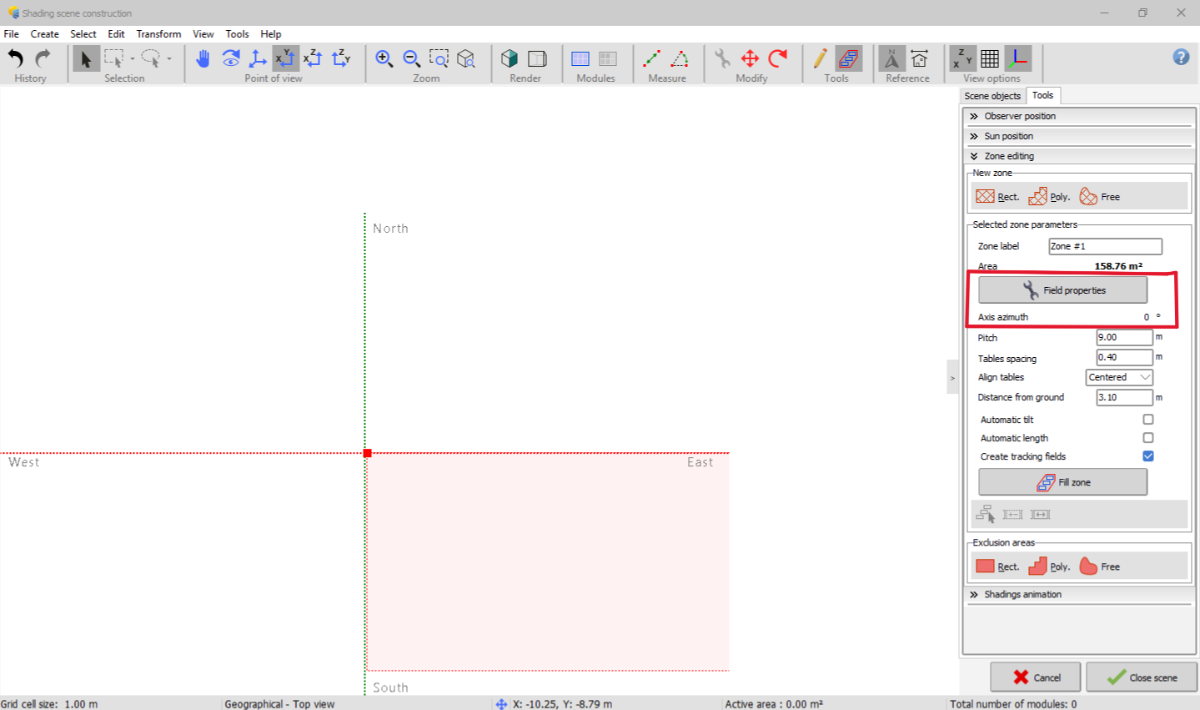
 Hello, Yes, the zone tool will be improved in a future version. In the meantime, by defining a fixed tilted plane with the all the parameters you wish for your trackers (orientation, pitch, size etc.) and tick the option "Create tracking fields" (as you have done in image 4), the zone will be filled with trackers with the correct definition.
 -
OK,thanks!
-
 Thank you for the reply 🙂 Regarding your answer, I would like to have a better understanding on how to apply your procedure in order to visualize and quantify the shadowing impacts of turbines. First, I get that I shall generate two simulation variants one with and the other without them and from the two loss diagrams see the corresponding near shadings and electrical losses. In order to calculate those losses in MWh, if I understand correctly, I should multiply the energy production values with the near shading and electrical losses expressed in %. Am I right? Secondly, in order to calculate the overall energy impact on different timeframe basis (monthly, daily...) I would like to understand if there is a way in PVsyst to extract the production values with respect to such timeframes. Did you have in mind another way to compute and identify those losses ? Thank you.
 -
Dear Sarikaya, I am still awaiting the response on the above topic for the project files emailed on multiple occasions at support@pvsyst.com.
-
 Pallavi Garg joined the community
 -
 Tuan Nguyen joined the community
 -
 C_NewPower joined the community
 - Last week
-
 Losses due to specific objects are not isolated. Shading from turbines will be included in both near shadings and electrical loss in the loss diagram. To isolate the turbines run models with and without them, take the delta of shading losses and you can calculate whatever you need. You will also have energy with this, so you can easily calculate overall energy impact monthly, etc.
 -
we will need cobiner boxes
-
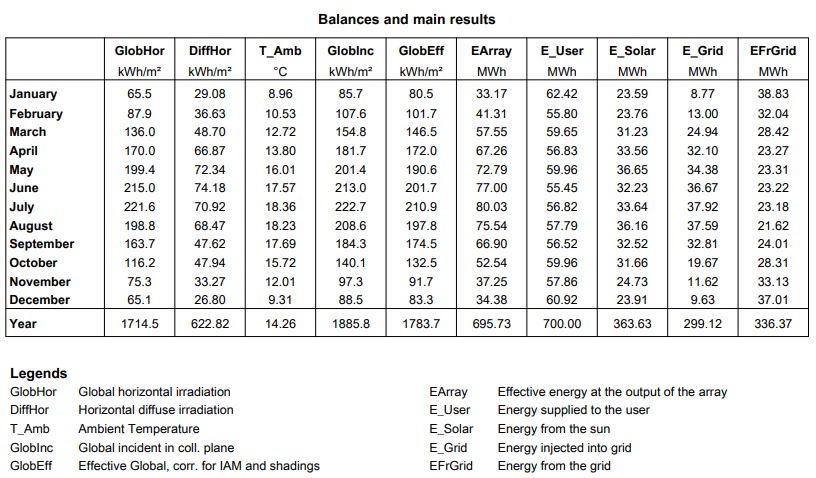
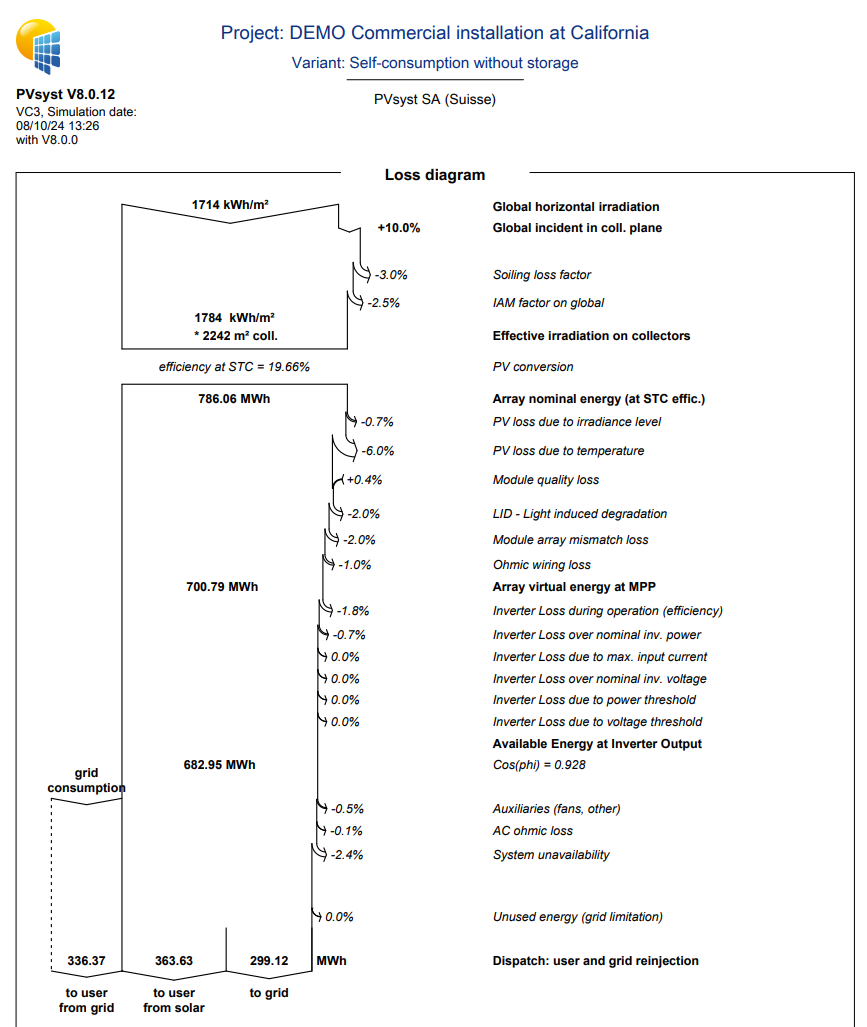
Hello Johann, The simulation and corresponding energy balance are calculated using hourly time steps. To determine how much of the generated solar energy can be self-consumed, the simulation must be run. For example, in the DEMO project “DEMO Commercial Installation at California” (VC3), the report shows: E_User: the total energy delivered to the user (reflecting the self-consumption profile), E_Solar: the portion of E_User that is covered by solar production, EFrGrid: the remaining energy that must be imported from the grid to meet the user's demand, E_Grid: any excess solar energy that is injected into the grid. These values are also illustrated in the annual loss diagram, giving a complete overview of the system’s performance over the year. Best regards

-
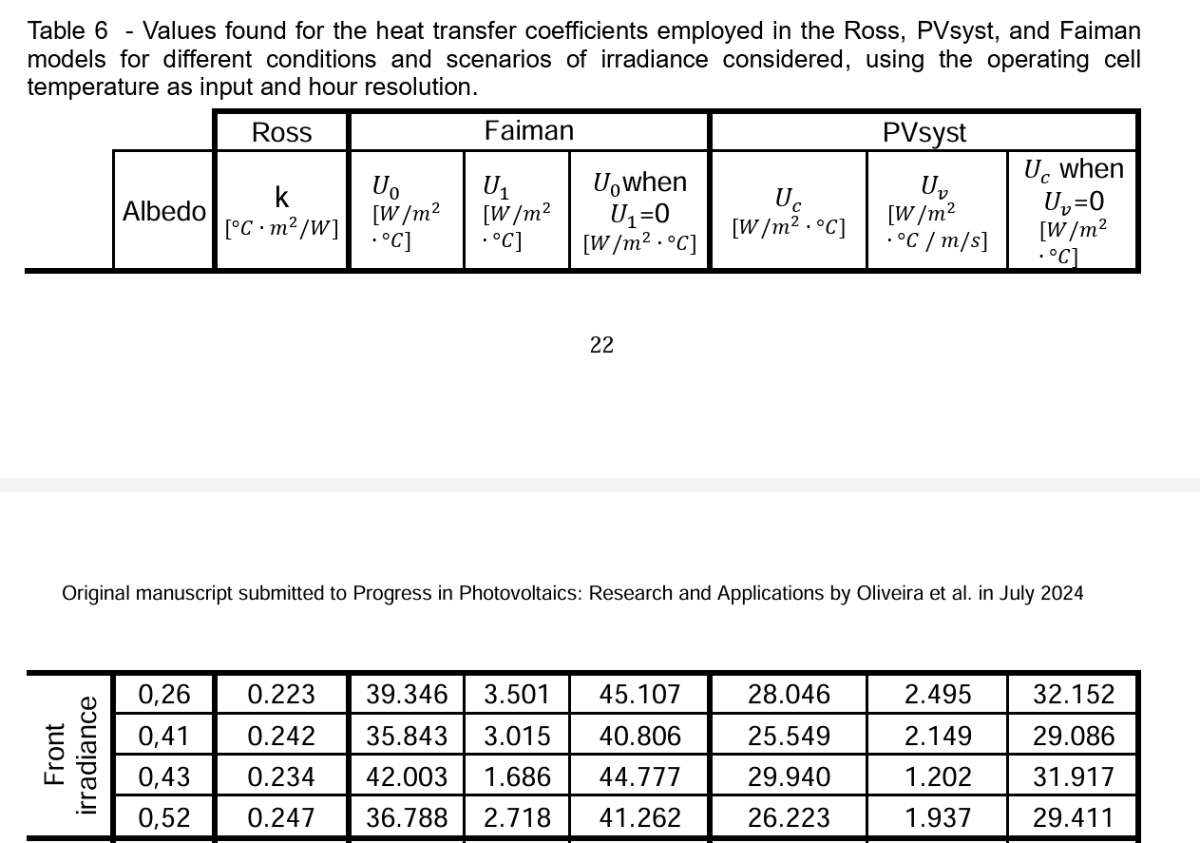
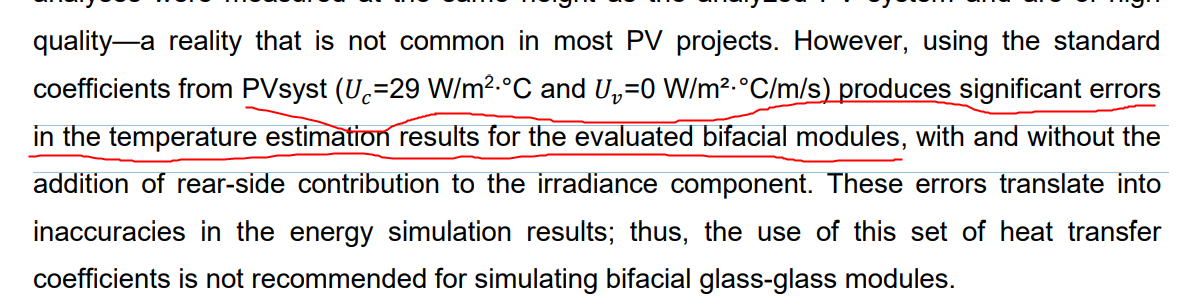
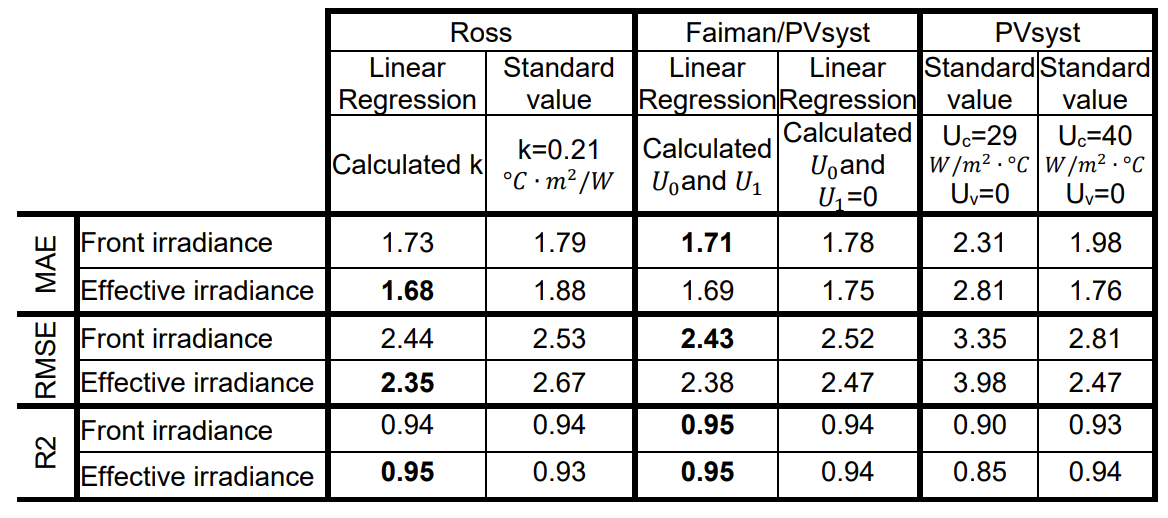
Dear Chen, Thank you for forwarding this article, it is an interesting study. However, most of the conclusion is misleading: PVsyst doesn't use the Module temperature in the simulation but rather the cell temperature. The cell temperature is not measured directly in this study (it would require placing temperature sensor inside a module during fabrication). The difference between module temperature and cell temperature is corrected for in section 3.4 and the coefficients Uc and Uv are recomputed there. These values (table 6) correspond physically to what should be used in PVsyst. The range found is ~[29-32] which is reasonably close to our default recommendation. Note that the authors also mention that the model used to compute cell temperature has not been validated for their specific technology, so the results should be taken with a grain of salt.
-
Hi all, I have to run a simulation in PVsyst in order to compute the shadowing impact created by the presence of three wind turbine aerogenerators located within the layout design of an agrivoltaic PV plant. To do so, I am well aware of the fact that I can import in the PVsyst tool Near Shading 3D scene a .pvc file (from PVcase) of the layout which can include the 3D shadowing items of the 3 wind turbines with the aim to compute in the simulation the impact of the shadows generated by those turbines with respect to the PV plant producibility. In this regard, I would like to know: - if the software quantifies such shading losses in the loss diagram under the voice Near Shading Losses. If not, please clarify in which voice they are allocated in the loss diagram -if there is some kind of way to compute the impact of the shadings generated by the wind turbines in a daily/hourly/monthly formats to understand for example through the year in which periods of time (days, hours) the shading effects is more relevant Please let me know if there is the need of any additional information that could be helpful to provide an answer to my questions. Thank you in advance. Vinh
-
Are we making any progress to including an inverter in a stand-alone system? Thanks!
-
 Fei Y joined the community
 -
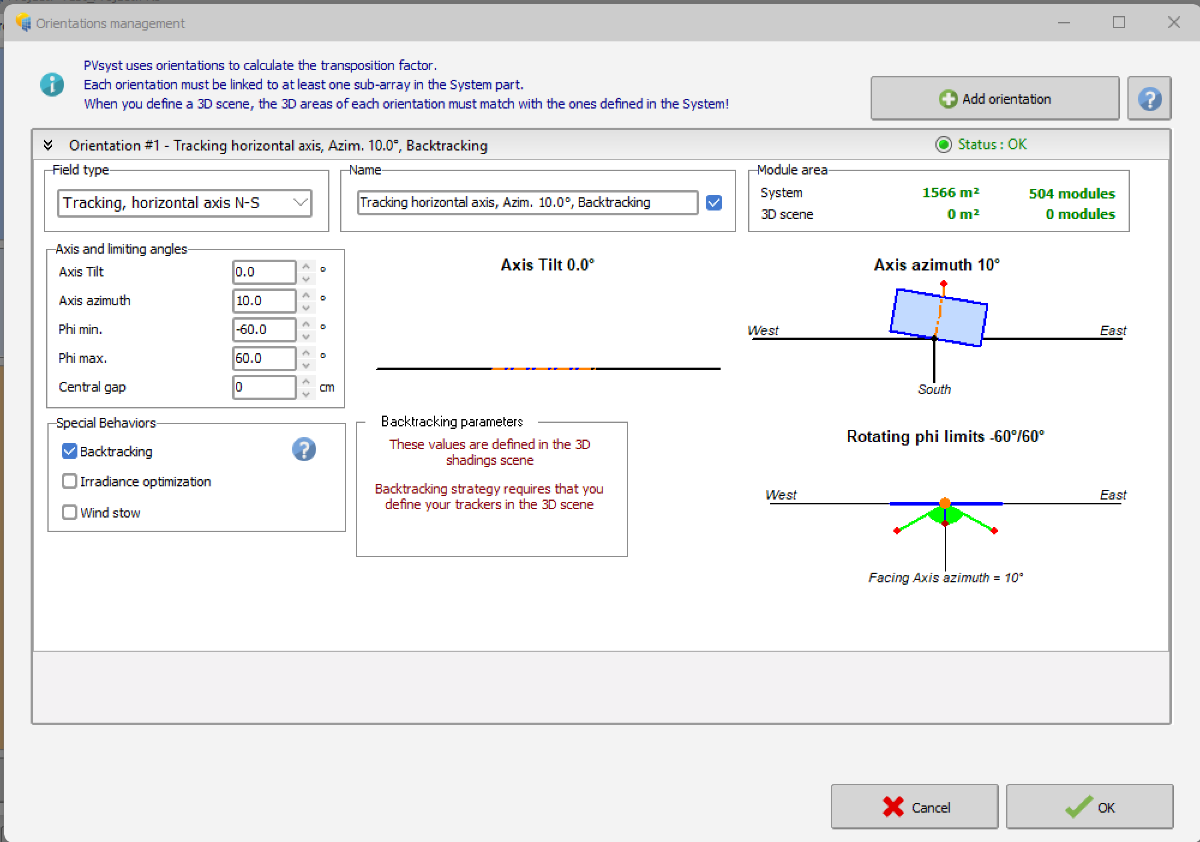
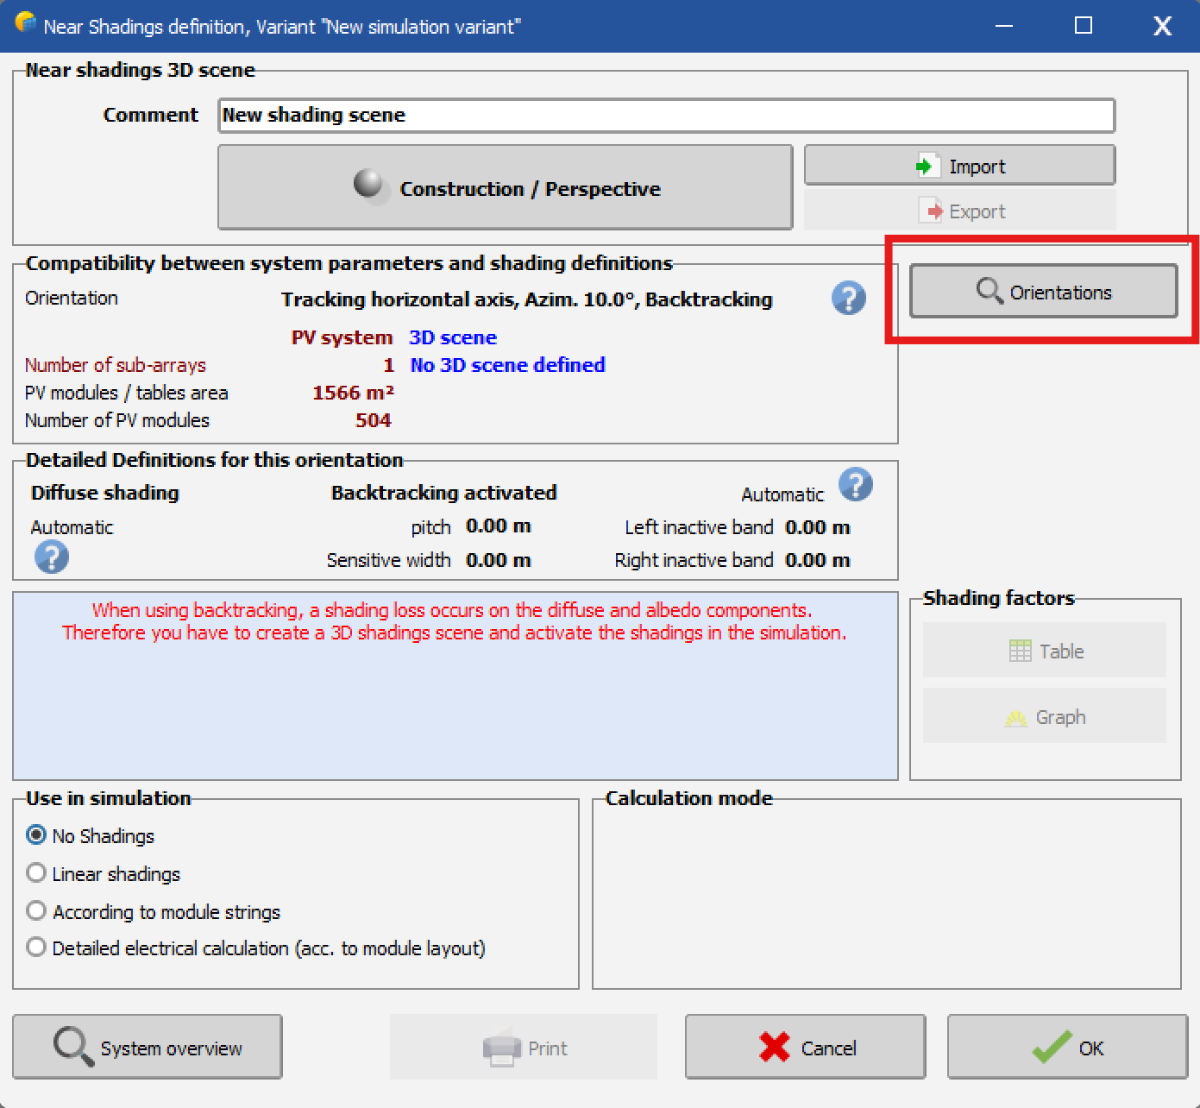
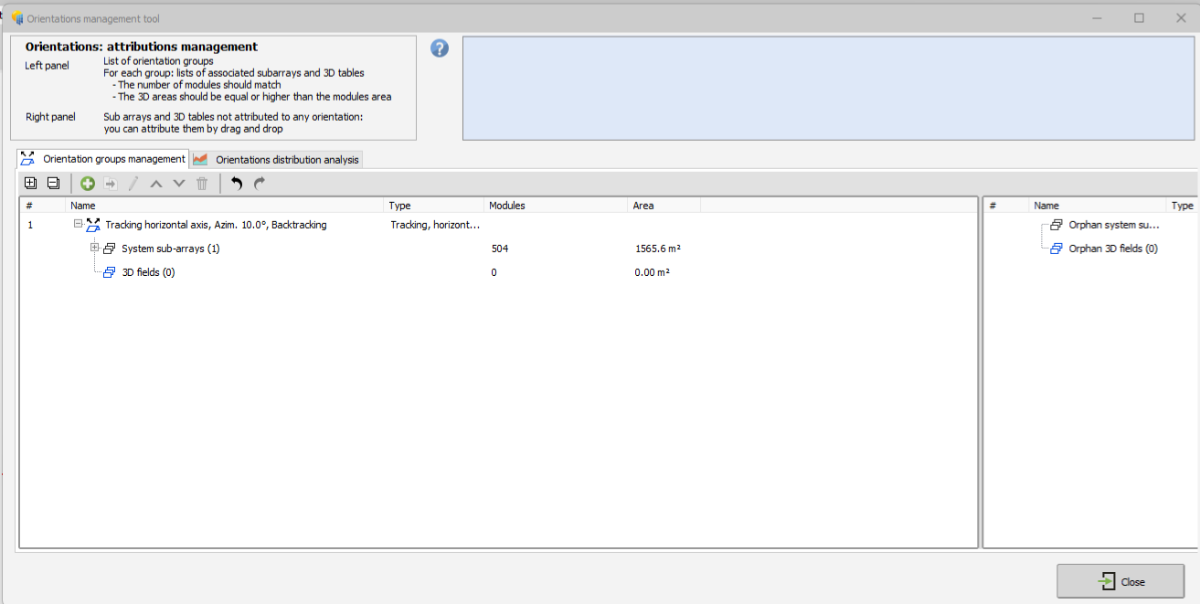
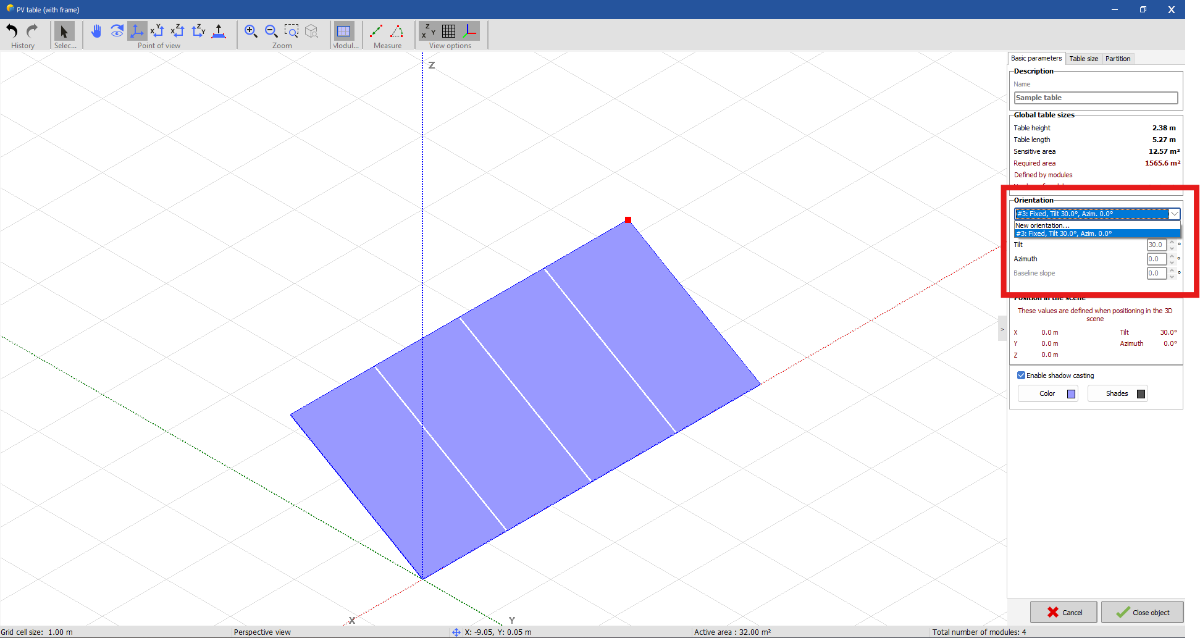
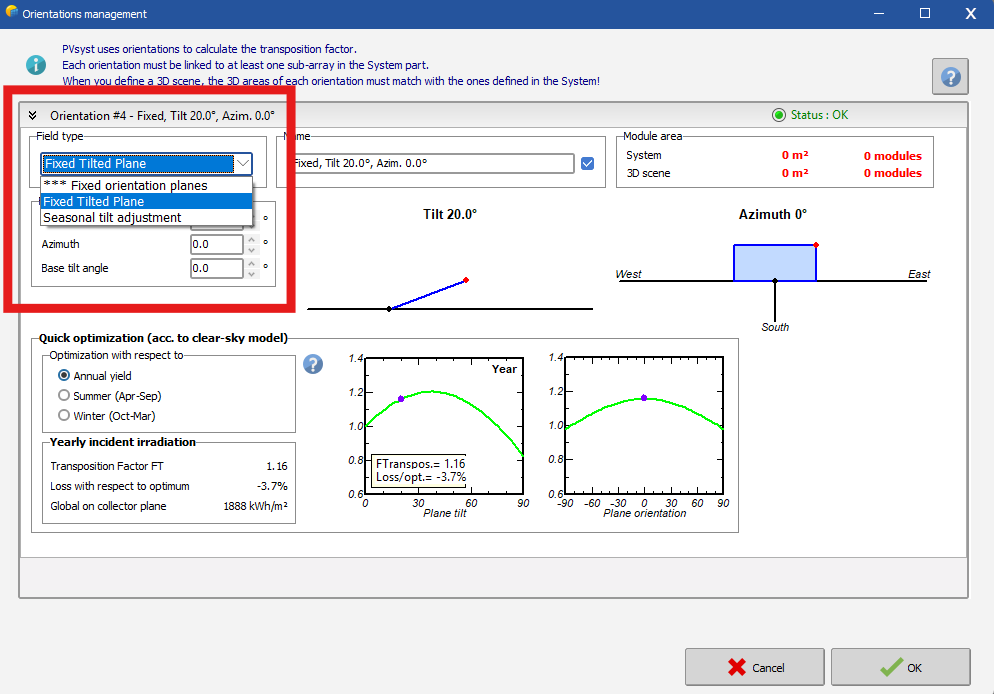
 Hello, I'm having trouble with the "Orientation" objects in PVSyst 8. In the Orientation page I've created a Tracking horizontal axis N-S item with Backtracking activated (see image 1). This orientation is correctly displayed both in the "Orientations" menu of the Near shading 3D scene (see image 2) and in the Orientation management tool within the 3D scene "Construction and perspective" environment (see image 3). However, when I create a new zone in the 3D scene and I click on "Field properties" (see image 4) --> "Basic parameters", I do not see the Orientation I've defined but only a Fixed, Tilt=30°, Azim=0° orientation I've not created (see image 5). Furthermore, if I click on "New orientation..." I'm unable to define any Orientation other than "Fixed Tilted Plane" or "Seasonal tilt adjustement" (see image 6). Any help would be greatly appreciated.
-

Finding out the reflection caused by the solar panels
Robin Vincent replied to Adeline's topic in Simulations
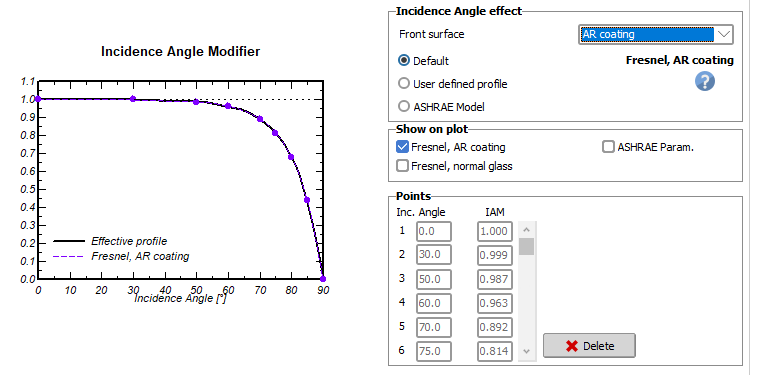
Regarding the direction, as Michele mentioned, the best way would be to find a dedicated glare tool. Alternatively, you could compute the direction yourself based on the sun position and the modules orientation. For the quantitative part, you could use the IAM values of your PVmodule, the incidence angle and the incident irradiance to estimate the reflected energy.
-
Gridshape joined the community
-
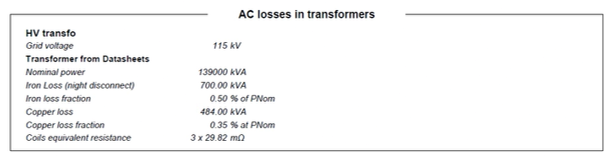
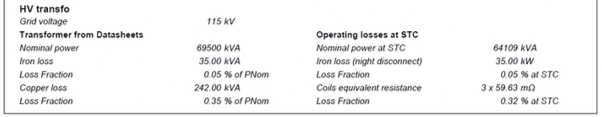
 PVsyst V8.0.12: Hello, the "Operating losses at STC" sections of the PVsyst V8 output PDF report have disappeared (!). See below screenshots as example (V8 screenshot is missing the section; V7 screenshot contains the section on the right-hand side). (NB: Please note the value for Iron Loss Fraction in one of the screenshots is incorrect, as there was a typo in the input. This rapid example was for screenshot purposes only.)
-
There are common instances when we would apply different "soiling" assumptions (which includes dust, snow, etc.) for different PV module types (e.g., monofacial, bifacial). We would like the ability to apply a different set of monthly soiling values for each subarray in PVsyst V8. This would resemble the subarray dropdown menu for the MQA factor in Detailed Losses. Is it on the development roadmap? Thanks.
-
I would like to simulate 2 MW floating PV system, how to start ?
-
 Shurouq joined the community
 -
P.S. I am referring specifically to this message:
-
 tomomi joined the community
 -
Dear PVsyst team: I saw an article in the literature that mentioned a comparison between the settings of UC and UV and actual simulation tests. Can we see if there is still a need to optimize UC for bifacial modules? thanks de Oliveira A K V, Braga M, Naspolini H F, et al. Validation of Thermal Models for Bifacial Photovoltaic Systems under Various Albedo Conditions[J]. ESS Open Archive eprints, 2024, 63: 06323163. https://onlinelibrary.wiley.com/doi/abs/10.1002/pip.3892 CTG_PIP_Temperature.pdf