All Activity
- Past hour
-
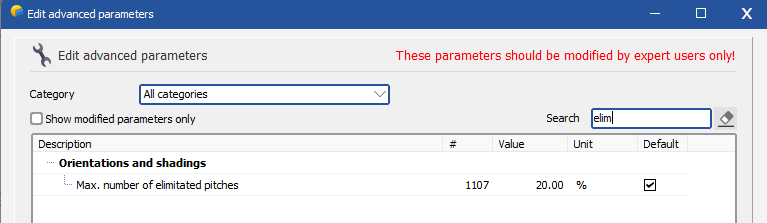
 Hi, this is an unfortunate error message, because it sometimes appears in situations that can actually be handled by the backtracking strategy. It does not depend on having a mixed orientation, rather it is due to dealing with a small number and/or dispersed trackers. You can change the following advanced parameter (home window > Settings > Edit advanced parameters) : You can try 50% or 75% before trying higher values until the error changes. This will affect how the statistics is taken when checking for this message. After the message has disappeared, it is recommended to enter the 3D scene and go to the menu Tools > Backtracking management. There you can review the second orientation, and review the backtracking parameters. If necessary, you can uncheck "automatic" and enter the pitch and other parameters manually.
-
@Debbie thanks for reporting this. It probably happens when the trackers are on a topography thus at different heights (even slightly) or different axis tilts. Can you confirm? I will create a new ticket to fix this.
- Today
-
Indeed, I have also been able to see confirm this on my side. I have added this to our internal discussion keypoints. We are working on another correction for 8.0.12 which depends on the number of rows. I think this will improve the noise that you see for low number of rows.
-
Unfortunately, I do not think there are sufficient studies on the aging of these types of modules for us to conclude on new guidelines on the dispersion of the aging. One way would be to contact manufacturers directly about that. In general, I would advise taking a conservative approach, and leave the default values when unsure. I personally would go on with the 0.4% by default.
-
Hello, Please can you help explain why irregularities like the one shown in the image attached occur in PVsyst? In this instance power drops from 15 MW to 0 MW in 30 minutes, mid-day in the summer. To me this seems impossible, even with partial cloud cover. Could be a result of poor weather data, however I experience similar things with Meteonorm and PVGIS.
-
 Dear Edwin, Thank you very much for your feedback and for taking the time to report this bug. Could you tell me how this situation occurred in your case, where the Medium Voltage panel remains visible even though you selected HV transformers? I need to reproduce this bug on my side in order to fix it. Regards,
 -
 fengche1915 joined the community
 - Yesterday
-
 Dear PVsyst Team, I would like to report a potential issue encountered in the simulation software starting from version 8.0.10. Specifically, when selecting between medium-voltage and high-voltage transformers, the configuration panel for the corresponding voltage line does not update accordingly. The section that includes settings such as voltage level, average line length, loss fraction, and conductor cross-section remains frozen or unresponsive, retaining the previous values even after switching the transformer type. This behavior makes it impossible to properly configure or review the parameters related to the selected transformer voltage level. This issue began to occur after updating to version 8.0.10, and it was not present in previous versions. I would appreciate it if you could look into this issue and let me know if there is any workaround or upcoming fix planned. Thank you for your support. Best regards,
-
 paulphillips joined the community
 -
We are performing a simulation with an inverter brand XXX at a site in Spain. During the analysis, we observed differences between the simulation data and the DC current values defined in the OND file. - In the Main Parameters window the inverter has a rated AC power of 4504 kW, with a maximum DC current of 5002.6 A, for a voltage U_DC of 915V. According to the manufacturer's data sheet these values correspond to operating conditions at 40 °C. (See Figure 1) Figure 1 - In the Energy Managment tab, the "external ambient temperature (outdoor installation)" option is selected. See Figure 2. Figure 2 - In the simulation, the site shows maximum ambient temperatures of 43 °C, without reaching 50 °C. - However, when plotting the simulated DC input current and voltage points (extracted from the Uarray , IArray variables), it is observed that the maximum current values never exceed values expected for temperatures below 50 °C curve profile, not even close to the 40 °C profile (which would be the expected behavior). Next figure (Figure 3) shows inverter input curves (V,I) for different temperatures and in yellow (Uarray, Iarray) points from simulation. Figure 3 🔧 Additional details: - Tests have also been performed by manually modifying the temperature derating profiles, even at extreme conditions, but the DC current results in the simulation do not change. May be PVsyst is using the 50 °C inverter curve by default to limit the inrush current, regardless of the actual site temperature. Below we copy part of the OND file where the inverter operating limits are defined. Converter=TConverter PNomConv=4504.000 PMaxOUT=4504.000 VOutConv=660.0 VMppMin=915 VMPPMax=1300 Vmpp_PMax=915.0 VAbsMax=1500 PSeuil=20005.00 EfficMax=97.00 EfficEuro=95.00 FResNorm=3.00 ModeOper=MPPT CompPMax=Lim CompVMax=Lim MonoTri=Tri ModeAffEnum=Efficf_PIn UnitAffEnum=kW IDCMax=0.000 INomAC=3500.000 IMaxAC=3940.000 TPNom=40.0 TPMax=25.0 TPLim1=55.0 TPLimAbs=60.0 PLim1=4001.000 PLimAbs=2001.000 PInEffMax =1800.000 PThreshEff=49.90 HasdefaultPThresh=False ❓Question: - Is there any reason why PVsyst limits the input DC current according to the 50 °C profile even when the maximum ambient temperature conditions of 43 °C? - Is it possible that PVsyst is using an estimated inverter internal temperature different from the ambient temperature to apply the curves? - Why the simulation results do not show values with data at 40 degrees of the inverter? Attached is also the comparative graph between the inverter input curves (by temperature) and the simulated values. We thank you in advance for your attention and any clarification you can provide, we remain attentive for any additional information you may require.
-
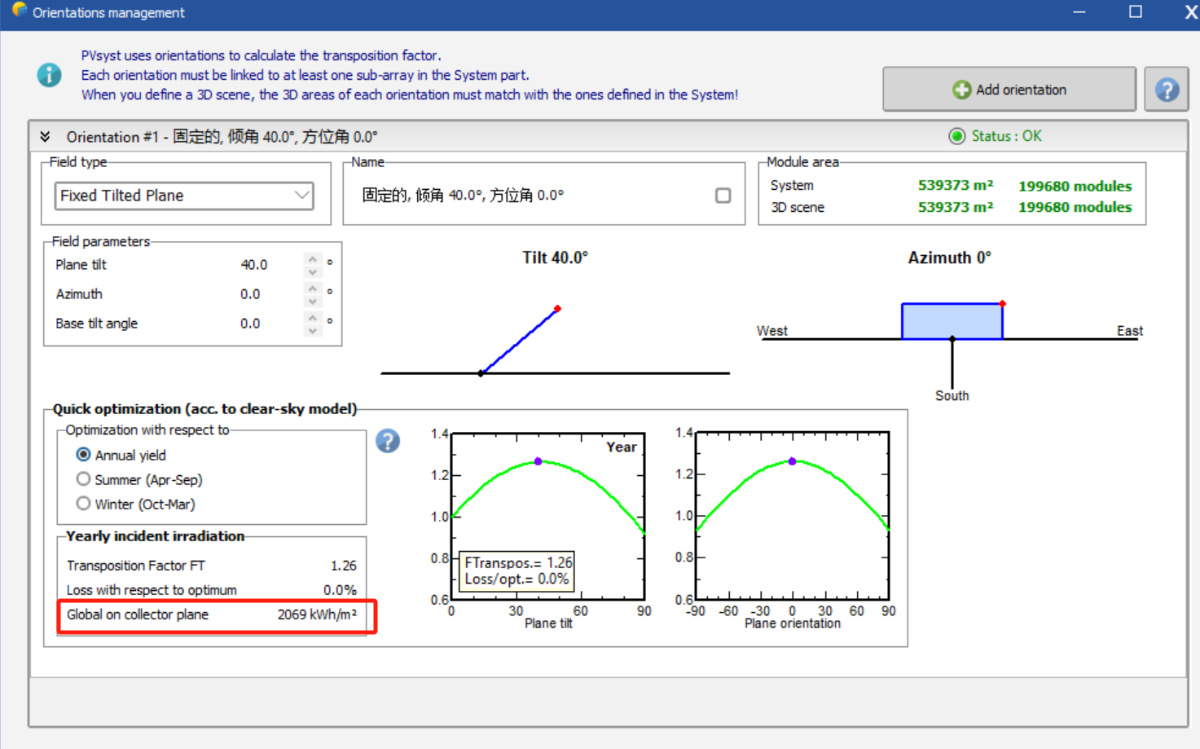
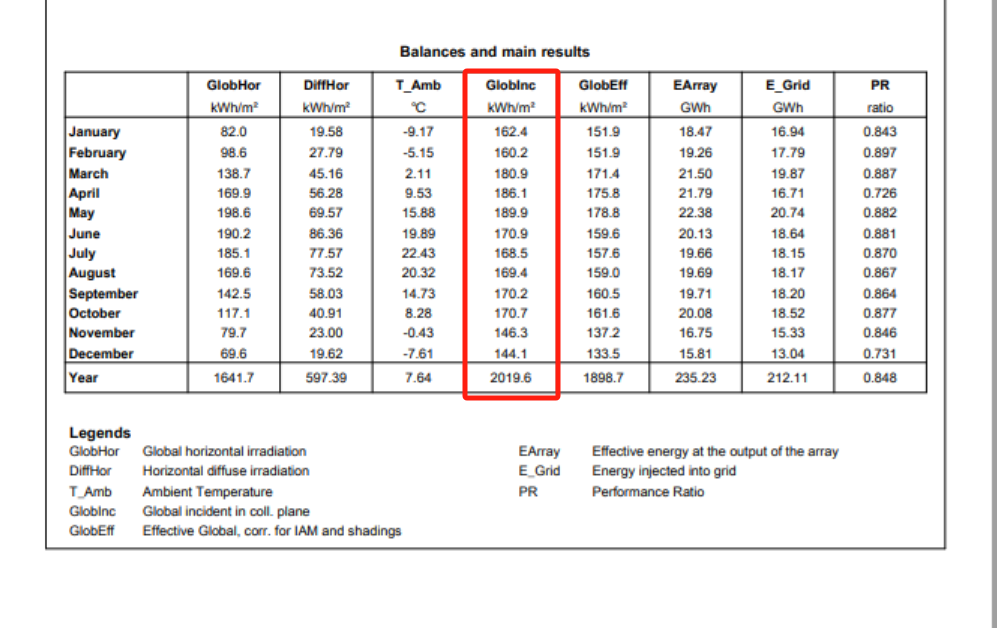
Dear Ihr, The Global horizontal irradiation is transformed to global incident in collector plane by using a transposition model. You can read more about the transposition model in the following PVsyst help page: https://www.pvsyst.com/help/physical-models-used/irradiation-models/transposition-model.html?h=transpositio The Global on collector plane from the Quick optimization box in the orientation window is based on the clear sky model at your site and is not the result of the simulation but serves as a quick optimization to get an order of magnitude of the irradiance in the collector plane according the chosen tilt and azimuth. The GlobInc in the report is the result of the simulation based on the hourly weather data.
-
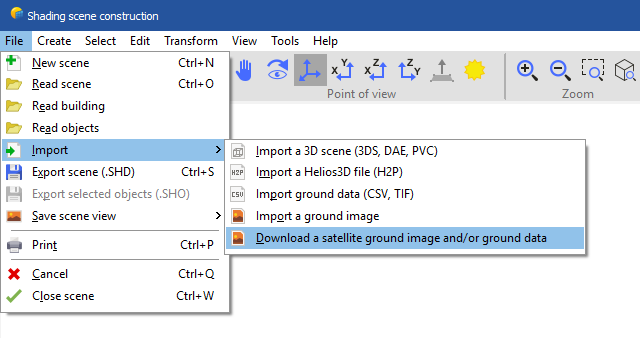
How to import the terrain topography into PVsyst?
Muhammed Sarikaya replied to addielavelle's topic in Problems / Bugs
Dear, I can’t help you with AutoCAD or how to convert the topography to a CSV file. Maybe just make sure to check the X, Y, Z coordinates in the CSV. With version 8, we can import topography from the internet — it might also be useful for you. Here’s how to do it: In Near Shading, click File > Import > Download a satellite ground image and/or ground data Then, don’t forget to check “Also import topography data” Regards,
-
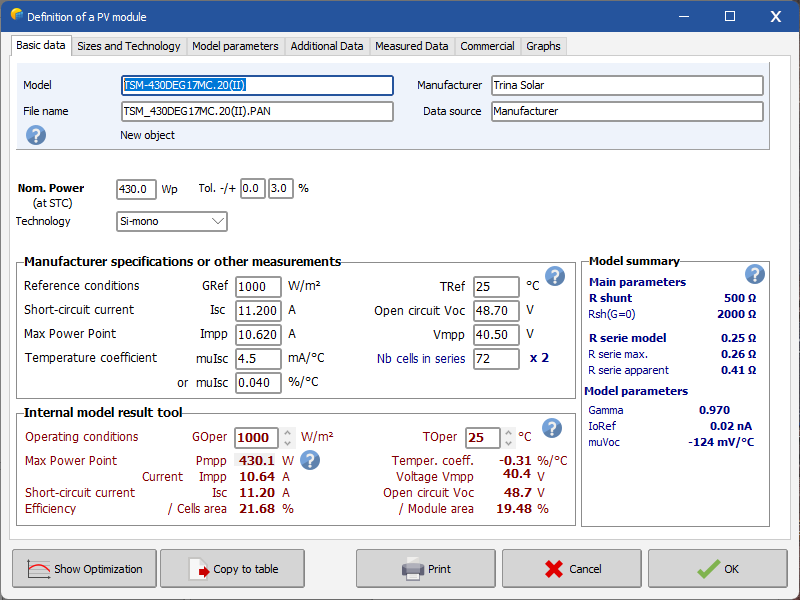
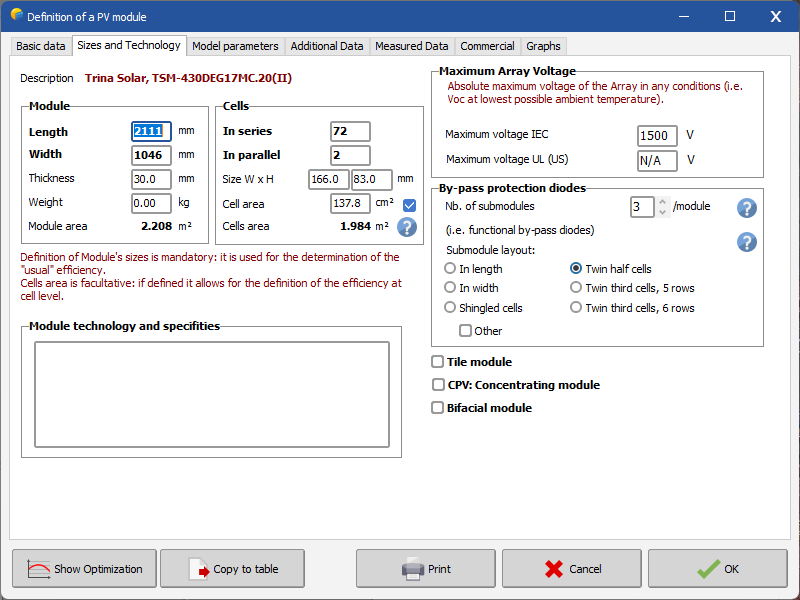
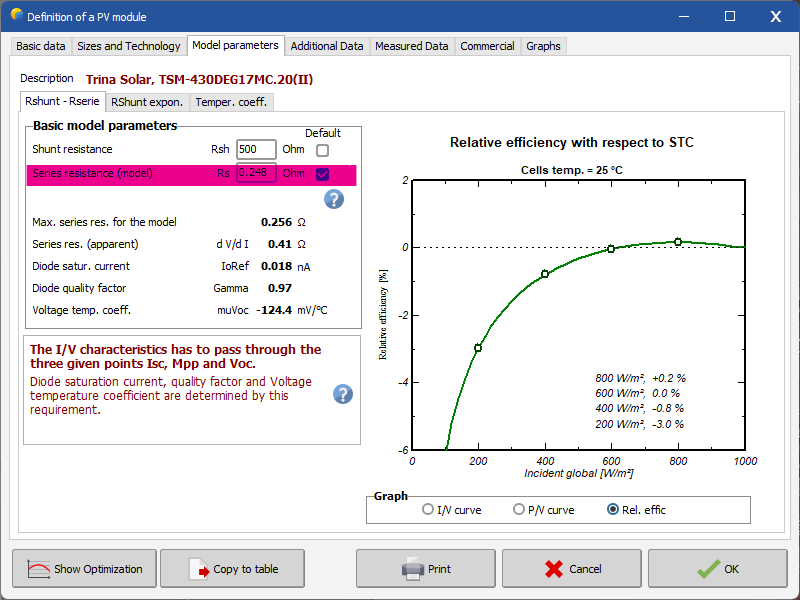
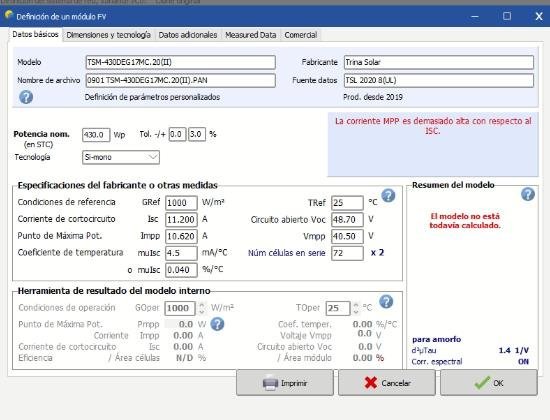
Dear Cleyson, I created the PAN file based on the datasheet and didn’t get any error messages, see below: Click on the "Model parameters" tab and select the default value for series resistance, as shown below: Try using exactly the same settings and let me know if anything changes for you. Regards,
-
Dear, We update the database using the requests of the manufacturers, and publish it with each new issue of PVsyst. We can't of course follow all the new products of all manufacturers in the world. Therefore, please ask your provider/manufacturer to take contact with us for updating the database. Nevertheless you can easily create your own components by yourself. The easiest way is to choose a similar existing device in the database, modify its parameters according to the manufacturer's datasheets, and save it under a new name, therefore creating a new file in your database. You have a tutorial for that on youtube: Regards,
-
I'm working on a simulation for a site and would like to import the terrain topography into PVsyst. I am using a CSV file (comma-separated) to create ground data (x, y, z) from an AutoCAD topography curves file. While PVsyst recognizes the file and successfully imports it into a 3D scene, I’m facing some issues: Continuing to work with the scene becomes impossible. The drawing displayed in the 3D scene does not match the actual terrain. Can anyone help me with this?
-
 addielavelle joined the community
 -
Dear pvsyst team, Hi,for the same item,Why these two values are different. How Globhor was transformed into Globinc?
- Last week
-
 Mosab.khalifa joined the community
 -
 Hi Muhammed, Thank you very much for your help, I will keep it in mind. Regards,
 -

PVGIS hava durumu verilerini getirme hatası
Linda Thoren replied to Hakan Öztürk's topic in Meteo data
Hello Hakan öztürk, Please note that this forum is in English. In December, PVGIS modified their format for the TMY output, which has affected the functionality of our API. The data reading was updated in version 8.0.6. Please update to a more reason PVsyst version and this should solve your issue. -
I have the following error on PVsyst 8, does anyone know how to fix it? The values are matching the datasheet.
-
Hello! You should divide your 10 years of data into 10 different files, one for each year. Then you can generate a TMY weather filed based on these 10 individual year in the TMY generation tool. In your workspace, you find a template for the PVsyst standard file, double check comparing to this file that you are following the requirements. You can also import your file as a Custom file is you continue having issues with the known format.
-

No import of meteo data, after selected and confirmed location
Nils Lang replied to Toni's topic in Meteo data
Dear PVsyst Users, Please email us at support@pvsyst.com your PVsyst LOG files (using menu <File> <Export logs>) so we can analyze what happened. Best regards. -
Dear PVsyst User, Please email us at: support@pvsyst.com your PVsyst LOG files (using menu <File> <Export logs>) so we can analyze what happened. Best regards.
-

No import of meteo data, after selected and confirmed location
Stefanie L replied to Toni's topic in Meteo data
Same issue here. Installing by repair mode of the latest version didn´t make differences. (PVSyst 8.0.9) -
Stefanie L joined the community
-
PVGIS TMY butonunu seçip getir diyince bu hatayla karşılaşıyorum. Bu sorun hakkında yardımcı olabilir misiniz?
-
 Hakan Öztürk joined the community
 -
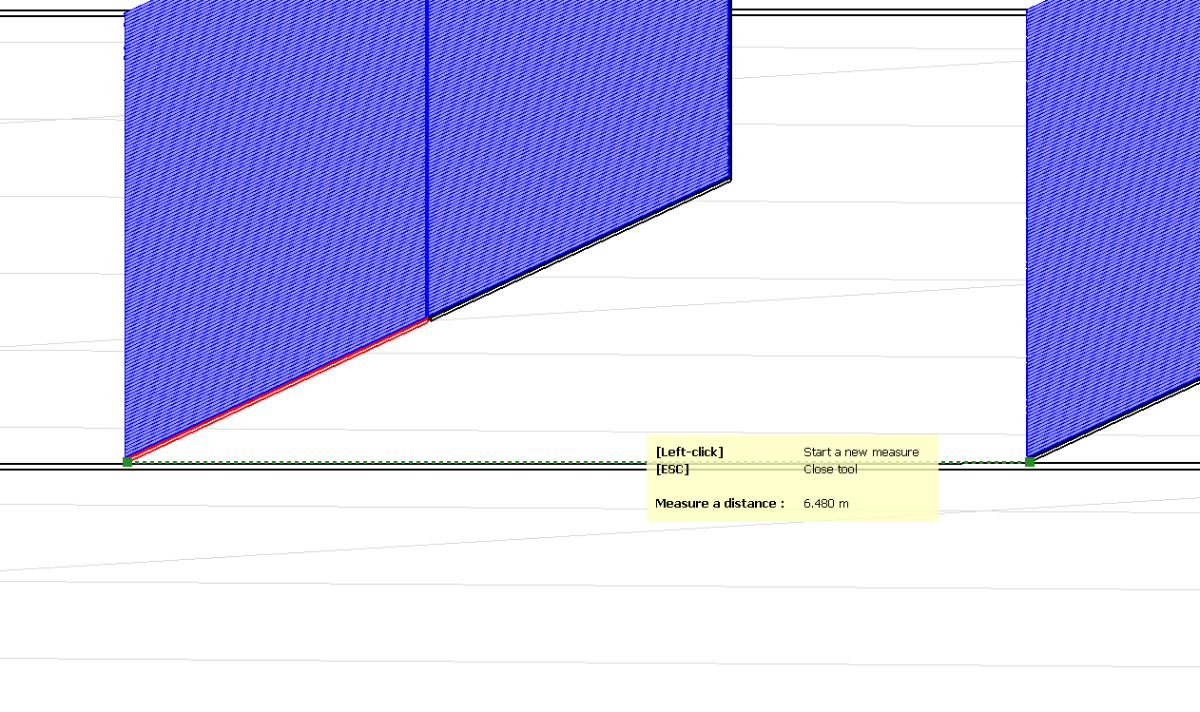
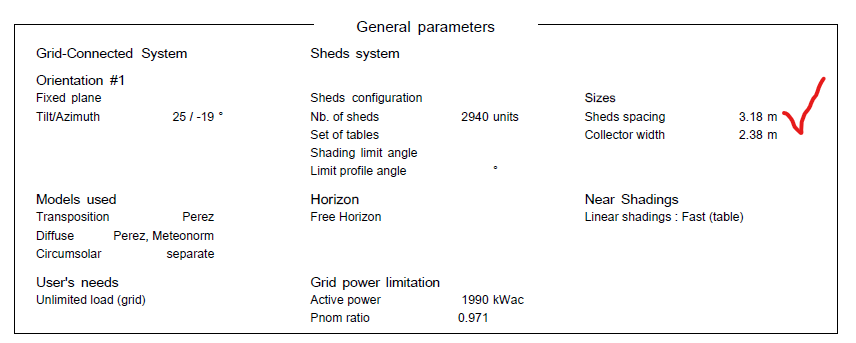
Dear Terence, Is it possible to send us the DAE file to "support@pvsyst.com" so we can also try it and check why there's a difference between the near shading and the report? Regards
-
The sheds spacing from the the report is different from the dae file that I imported in near shading scene which I have attached in this email. Imported dae file is from sketchup and solar panel are generated by skelion.
-

Version 8.09 - Trackers diffuse masking - possible bug
Debbie replied to Debbie's topic in Problems / Bugs
Also, when I tried to switch it from "custom tracker" to "all trackers", it did not correctly save this change when running the model. The report still shows "custom tracker" and the shade losses are still lower than the prior model because that custom tracker is on an edge of the mask.

.jpg.ab60ef59987db9ab7ec29dad98c833ca.jpg)