All Activity
- Today
-
Right, this setting is not very realistic anyway, it creates very long trackers if I recall correctly.
-
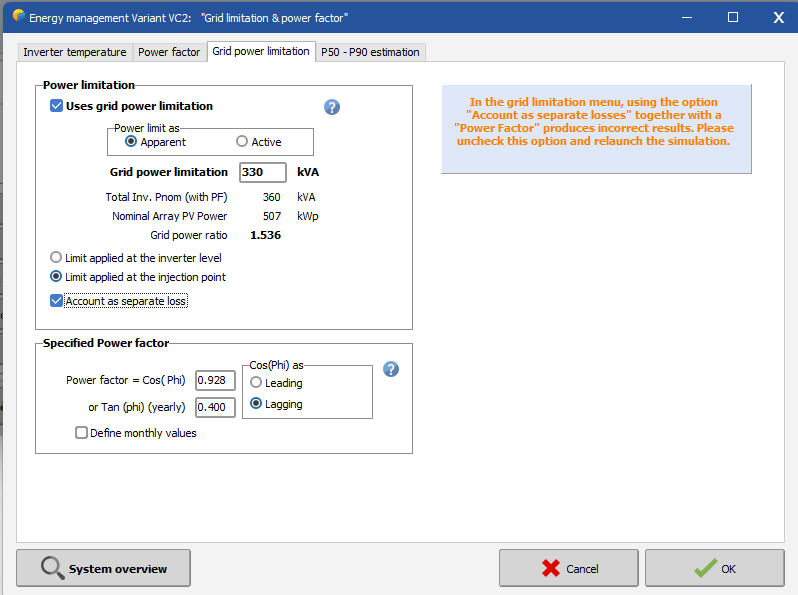
 Grid Power Limitation: The option "Account as separate loss" in the menu grid power limitation poses a problem when used together with a power factor. Indeed, at the moment, the reactive energy produced is computed based on the available energy at the output of the inverter. When a grid limitation is present, this is acting normally as a clipping loss on the inverter, therefore the available energy at the output of the inverter is reduced and so is the reactive energy. However, when the option "account as separate loss" is used, the energy at the output of the inverter is virtually higher, causing a miscalculation of the reactive energy. It depends on the magnitude of the grid limitation, so we recommend users to check their simulation with and without this option to decide whether or not to use it. Until the opton is fixed in a future version, the software will display a warning when both options are used together.
-
 Hello, I am working on a project with a complex 3D shading scene (multiple sheds defined on 3D sensitive surfaces), and my goal is to identify which specific areas of the field are the most suitable for installing PV modules. To do this, I would need to obtain annual shading losses for each individual module, not only per orientation (eventually per zone would be fine) In the user interface, the only shading results available are: global shading losses, shading losses per orientation and instantaneous shading visualization in the 3D animation. What I cannot find is any way to extract annual shading losses per module (e.g., module #1 = X%, module #2 = Y%, etc.), which would allow me to compare zones and optimize the layout. Does PVsyst currently provide any output listing annual shading losses per module? or per zone ? Or per string ? Thank you in advance, Ludovic
 -
 As the title, I dont know what is the tilt in Optimization tool? Hope your reback, Thank you!
 -
William.F joined the community
-
Le Déaut joined the community
-
thanks!
- Last week
-
We did some additional diagnostics and found that the ‘Auto’ setting for table length is causing the issue (version 7.2.16).
-

How to configure a tracker to lock the rotation
Michele Oliosi replied to Antonio Augusto Ananias's topic in Simulations
Good to know it works ! Actually I was not sure if [X,X] worked, I seemed to remember that at some point in the past the trick did not work unless there was a difference between min and max. -
Hi, this feature is in our roadmap, but not before a few patches after the release of 8.1.0 With our internal beta of 8.1.0 we could already mimic this by running a simulation, then using that to determine a grid limitation time series that truncates the inverter power with ramps, and then resimulating with this new grid limitation time series. In version 8.0 the workaround is a bit more convoluted. You could mimic this with a self-consumption profile that acts as a stand-in for the losses in ramp-up (you would also need to simulate, then post process, create the load profile, then simulate again), but that is less practical as a workaround.
-
 Prelbe joined the community
 -
Is there a feature to simulate plant ramp-up. For example. 0-100% in 15 minutes? This is due to grid code limitations. Thanks.
-
 avalero joined the community
 -

Issues with Orientation and shading scene
Linda Thoren replied to Luca M's topic in Shadings and tracking
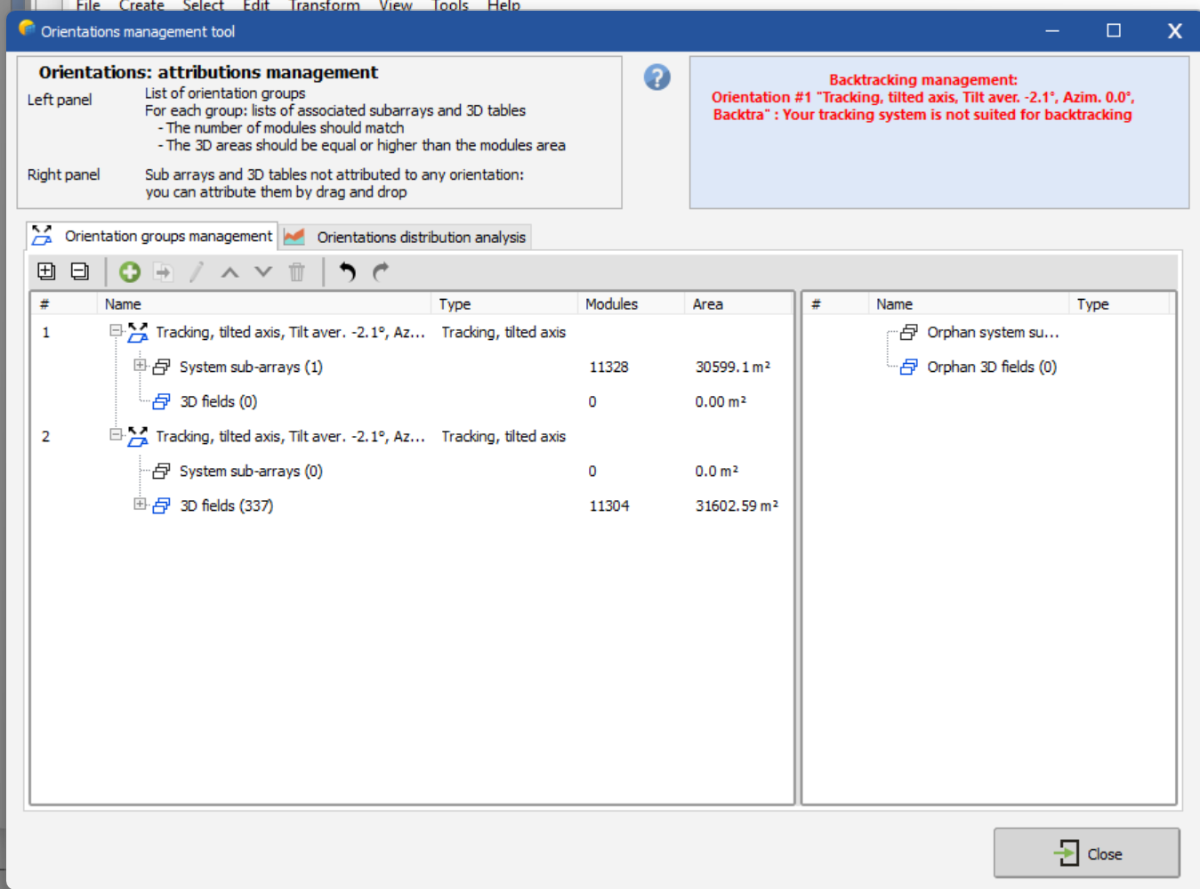
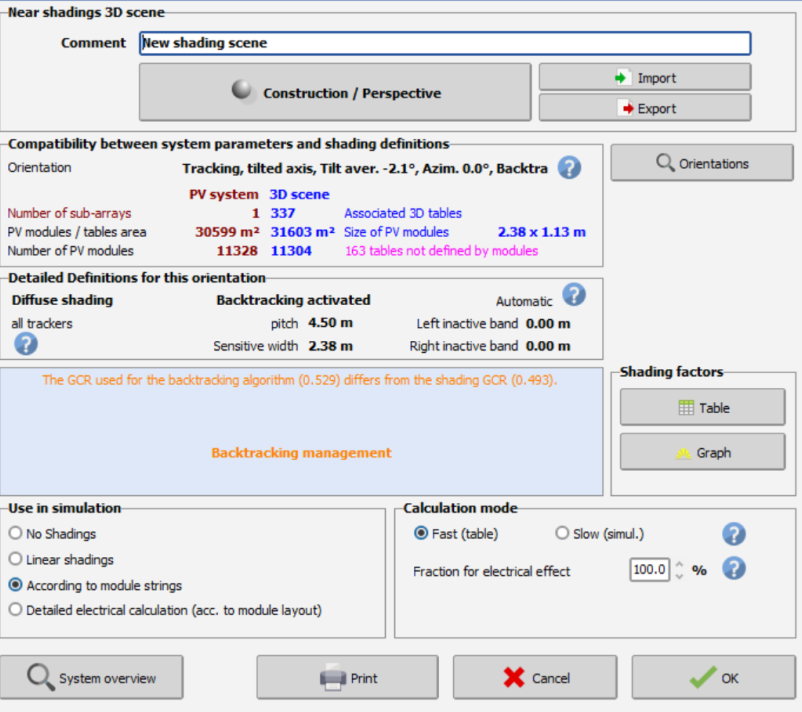
Hello, 1. In version 8.0.19 we have been improving the orientation grouping function. Which version are you using? What tolerance is set in the project settings? 2. The issue could from the fact that you can define multiple gaps for your tracker in PVcase, motor gap, joint gap, horizontal gap between modules and vertical gap between modules (though normally this would lead to the opposite issue, that more modules are placed in the 3D scene than in the system definition). PVsyst we handle only horizontal gap between modules and vertical gaps between modules, so the PVC file doesn’t contain the other information. The PVC file only contains the total length/width of the trackers and the horizontal/vertical gaps between modules. Did you check the "Terrain following trackers" checkbox in the "Frame creation" tab in PVcase? This setting should break the PVcase trackers into multiple smaller trackers for PVsyst (according to the defined gaps), placing the modules at the correct location. In this case, PVsyst will divide the tracker where the motor gap is. I also notice that 163 tables are not defined by modules, potentially the mismatch comes from these tables. Kind regards -

Large Discrepancy in Total AC Power After Simulation
Robin Vincent replied to Jherche's topic in Simulations
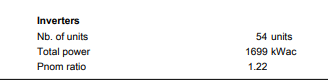
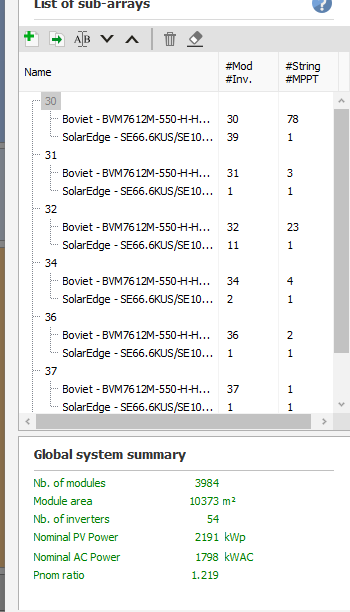
There is a known issue where the total AC power in the report is not accurate with SolarEdge subarrays. This is due to the way the total is computed in the report, based on individual MPPT powers. With SolarEdge and its specific way to attribute (and distribute) strings to inverters, the computation is sometimes incorrect. This issue is on our roadmap, but as it does not impact the simulation results, it has been scheduled for a later version. -
Hi, I'm modeling quite a large project where there are 18x SolarEdge SE100KUS inverters, all using C651U optimizers. I've modeled a total of 54 total units (33.33 kW each). The Global system summary accurately calculates 1800 kWac. However, after running the simulation, there is a very large discrepancy where total ac power comes out to 1699 kWac. How can this discrepancy be fixed? Thanks!
-
 Jherche joined the community
 -
Hello, I'm having some issues after updating from PVsyst 7 to 8: 1. Orientation management issues once the scene is imported from PV Case in .pvc format Once I import the .pvc file, in the Orientation management tool I always have 2 orientation groups. Is there a way to avoid this to happen? 2. Mismatch of tables between 3D scene and PV system scene I always have a number of modules different from the number of tables
-
 Luca M joined the community
 -
We also have a comparison of different data sources available here, although we cannot possibly cover all countries: https://www.pvsyst.com/help/meteo-database/import-meteo-data/data-source-comparison.html#comparison-between-several-data-sources-for-different-continents If you need a more precise estimate for the locatiosn of your choice, I advise to get dat from different providers and compare the weather files using our comparison tool https://www.pvsyst.com/help/meteo-database/compare-meteo-data/index.html
-
 jihun joined the community
 -

How to configure a tracker to lock the rotation
dtarin replied to Antonio Augusto Ananias's topic in Simulations
Curious why you have included the +1 there. You can simulate a tracking system at [X,X] for min and max to lock the tracker for all hours to a single angle. If you need to more than one angle, this can be done with batch simulation easily. -
@Michele Oliosi would you please be able to comment on this? Thanks
-
Hello, I have a question about annual variability. I have read the information available in the PVsyst help section and have seen that you have a table with the percentage variability according to different locations, their climate, latitude, and global solar radiation index (GHI). I mainly work with simulations for countries such as Honduras, Colombia, and Mexico, among others in this region. Where can I find the variability for these countries? Best regards!
-
 apointmedia joined the community
 -
The production is mainly determined by the system capacity (10.32). The "number of sheds" = number of rows is only used for shadings calculations. Increasing the number of rows means that for a larger proportion of rows the row-to-row shadings will be present. This is why the production decreases, because shadings are a bit larger.
-
How to configure a tracker to lock the rotation
Michele Oliosi replied to Antonio Augusto Ananias's topic in Simulations
It is easier to transform fixed tilt structures to trackers in the 3D scene, using the Transform menu. The other way around can be more of a hassle. The wind stow option is a good option. it necessitates however to import weather data from a file in which you prepare a wind speed time series > some number. Another option is setting the tracker limit angles to e.g. min X and max X+1° if you are okay to fix the tracker to this 1° range. X and X might work too, though I would double check the output with the X, X+1 to make sure it is consistent. -
PVSyst vs pvlib tracking angle comparison
Michele Oliosi replied to kapetav's topic in Shadings and tracking
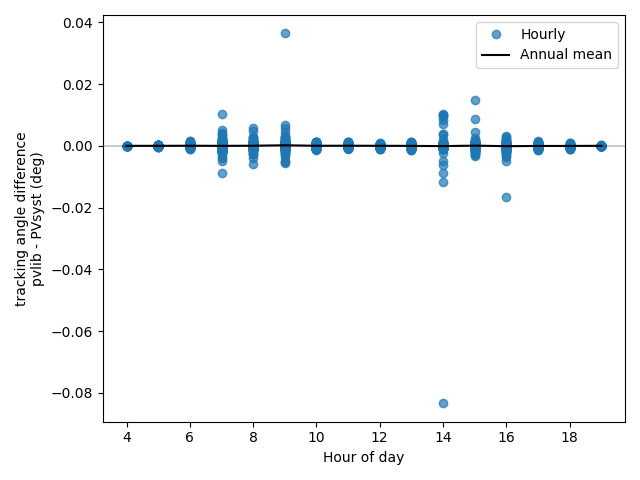
yes this is because of the ratio of width and pitch (GCR) which ultimately controls the tracking algorithm. In your case the GCR is .5. which explains that these two modifications are equivalent (approximately). I would still suggest the remove 1 cm option as better since it mimics most correctly what pvsyst does and is more general to other GCR ratios. -
 machinecoffee03 joined the community
 -

PVSyst vs pvlib tracking angle comparison
kapetav replied to kapetav's topic in Shadings and tracking
It seems I get the same result whether I add 2cm to the pitch or subtract 1cm from the sensitive width:
-
 I would like to know whether it is possible to use an already existing PVsyst simulation configured with single-axis trackers and simply lock the tracker rotation, keeping the modules fixed at a single tilt angle (for example, by using the stow position). Specifically, is there a way in PVsyst to block the tracker rotation and manually define a fixed tilt angle for the modules while maintaining the original tracker-based geometry and layout? Or, alternatively, if the intention is to simulate the system with a fixed tilt, is it necessary to rebuild the entire model using fixed structures with the desired tilt angle instead of trackers?
 -
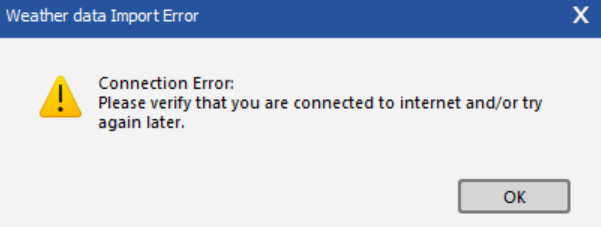
Hi, I am getting the following error while trying to get PVGIS TMY data from the weather data import: Anyone with the same problem? Thanks.
-
PVSyst vs pvlib tracking angle comparison
Michele Oliosi replied to kapetav's topic in Shadings and tracking
To compare with baseline pvlib, I would rather remove 2 cm to the "Sensitive width". Might be 1 cm, I am not 100% sure if 2 is double counting. -
Indeed this is a limitation we still have. The electrical shadings in general in PVsyst are further explained in the following video: