
Lazare Fesnien
-
Posts
276 -
Joined
-
Last visited
Everything posted by Lazare Fesnien
-
Hi, For the moment this feature is under development. In the meantime you can put an insignificant value or calculate or estimate a value for "Global wiring resistance (mOhm)" or "Loss Fraction at STC (%)"
-

Need of solar water pump solution for various needs
Lazare Fesnien replied to chanakya patel's topic in Suggestions
Hi, Thank you for your comments, indeed we will develop these solutions soon in order to meet the different irrigation criteria. -
Hi, The SolarEdge distributed architecture is based on a unique system design approach, characterized by a distributed DC-DC power optimizer for each PV module (or group of PV modules). These optimizers, with a current-driven output, are connected in series as strings, which are then connected in parallel to the input of a special (proprietary) inverter. Each power optimizer can manage 1 to 4 PV modules, and performs the MPP tracking at the input module (or group of modules) level. The specificity of the SolarEdge inverters is that the voltage of the full optimizers string is fixed (usually 350V or 700V for most inverters), so that the current of the whole string (i.e. each optimizer output) is imposed according to the available PV power at Pmpp of each input module. During the simulation, the efficiency of each optimizer is evaluated. It depends on the Current boost ratio (the longer optimizer string, the lower efficiency). Operating at a fixed voltage means that the Power Optimizers in a string operate completely independently one from the other, so that at a given time the module productions may be different without any effect on the system (shadings, mismatch, different orientations, etc). In PVsyst this requires a very special procedure for the elaboration and sizing of the system. You should first define the system, with one sub-array per kind of string (i.e. number of modules in series). Then you should press the button "String configuration" for attributing each specific string to its own inverter. See the help : https://www.pvsyst.com/help/solaredge_architecture.htm?zoom_highlightsub=solaredge https://www.pvsyst.com/help/solaredge_procedure.htm?zoom_highlightsub=solaredge
-
Hi, Is your problem visible on the entire inverter database or only on an inverter that you have imported/created? If a component is not visible in the drop-down list from the system, this indicates that the component is not fully defined in the database and that it cannot be used for a simulation
-
Hi, We update the database using the requests of the manufacturers, and publish it with each new issue of PVsyst. We can't of course follow all the new products of all manufacturers in the world. We don't want to include data without the acknowledgement of the manufacturer. Nevertheless you can easily create your own components by yourself. The easiest way is to choose a similar existing device in the database, modify its parameters according to the manufacturer's datasheets, and save it under a new name, therefore creating a new file in your database. For adjusting the parameters you have to open the battery dialog within the software. However for Li-Ion batteries, this is not so simple. For defining a battery pack, you should define a single cell, and then construct the battery pack as an assembly of these cells. Constructing the cell's file requires to avail of detailed datasheets of this cell. And the elaboration of the parameters passes by a detailed analysis of these data (especially the charging / discharging curves).
-
Hi, The horizon profile may be defined manually by a set of (Azimuth/Height) points in degrees. These may be from on-site measurements (using land-surveyors instruments like compass and inclinometer). They can be imported from several sources: From your workspace: · PVsyst internal file - all horizon files that are saved in your workspace From external files: From web sources directly (requires an active internet connection) Please read :http:// https://www.pvsyst.com/help/horizon_import.htm?zoom_highlightsub=Import+horizon
-
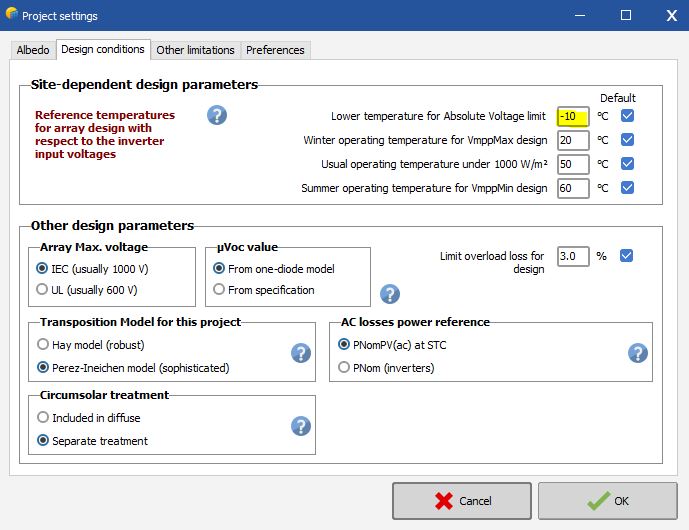
Hi, You need to change the value below: Absolute Cell lower temperature for determining the Maximum possible voltage of the array. The default is set to -10°C for most European countries (best practice rule). For this limit, the cell temperature is considered as the ambient temperature (worst case when the sun suddenly appears on the field). You should define the lowest temperature ever observed during the day for this site.
-
Unbalanced MPPTs, secondary unused on all but one inverter
Lazare Fesnien replied to jaredm's topic in How-to
Hi, An improvement in version 7 has been made on this subject. For more details please read: https://www.pvsyst.com/help/inverter_multi_mppt.htm?zoom_highlightsub=second+input https://www.pvsyst.com/help/multi_mppt_use.htm -
Hi, This is not an "error". it is the manufacturer who has inserted these components into the database under this name. If you check Impp x Vmpp = Pnom, this corresponds to the Pnom defined in the file. File names are different for each manufacturer
-
Hi, Inverters with Unbalanced MPPT inputs : Some special inverters (namely in the Tripower series of SMA) have 2 MPPT inputs with very different powers. In practice this is very useful as you can define an array without much constraints about the module number on the main input, and one string with the remaining of your modules to be installed - whatever their number - on the secondary input. This feature is part of the Inverter's definition. With these very special unbalanced inverters, when defining a sub-array you will have the choice between "Main" and "Secondary" MPPT inputs. In principle you should define sub-arrays for the same number of "Main" and "Secondary" inputs (i.e. use all the available inputs). However the button "adjust" gives the opportunity of not using the secondary input. Please check with the manufacturer that this is really possible with the real inverters you are using. At the design time, the nominal powers of each input are evaluated according to the maximum currents specified for each MPPT inputs. This may sometimes lead to unacceptable overload losses. If this warning is red (error), you have to increase the allowed overload energy loss in the "Project's" parameters (button "Albedo-Settings"). At the Simulation time, the power sharing (as mentioned above for normal MPPT inputs) is automatically performed as function of the PV modules connected in each sub-array. The Pnom of each MPPT input is evaluated just before the simulation.
-
Multiple arrays in stand alone simulation
Lazare Fesnien replied to project_eco's topic in Simulations
Hi, Sorry, with stand-alone systems, only one sub-array is possible. Therefore one only orientation. This is a limitation of PVsyst, that we should improve in the year. -
Hi, This is probably due to a problem when defining your component. For more details, a youtube video is available on our channel:
-
Hi, Details are available in the loss diagram and in the graphs. For more information on this topic, please read: https://www.pvsyst.com/help/self_consumption.htm?zoom_highlightsub=Self+consumption https://www.pvsyst.com/help/tariffs.htm?zoom_highlightsub=Self+consumption https://www.pvsyst.com/help/gridstorage_self_cons.htm?zoom_highlightsub=Self+consumption
-
Hi, EArray = Effective energy at the array output E_Grid = Energy injected into the grid For more details on energy management with self-consumption please read: https://www.pvsyst.com/help/self_consumption.htm?zoom_highlightsub=Self+consumption
-
What could be the maximum power of my battery?
Lazare Fesnien replied to omairahm's topic in Simulations
Hi, Is this for a "grid connected" or "stand alone" simulation? Should your battery park be able to cover all of your needs or only a part? A tool in PVsyst is available to calculate the energy stored in your battery bank. -
How accurate is creating a dummy multi MPPT device?
Lazare Fesnien replied to Ivan29's topic in How-to
Hi, It will be necessary to pay attention to the maximum current of each MPPT in order to respect the current and the maximum power admissible by the inverter -
Hi, Yes, for this you must define or import a load profile from the "self-consumption" tab
-
Hi, For this type of question, please contact http://support@pvsyst.com directly.
-
Hi, Indeed it is a hard limit of PVsyst. Stand alone systems are normally intended for small installations (house, village etc....). As you have chosen a universal regulator, it automatically adapts to all your different configurations.
-
Hi, When you have a different number of strings on the MPPT inputs, you should create one sub-array for each configuration (for example one sub-array for the MPPTs with a single string, and another one for the MPPTs with two strings). Then, in ‘power sharing’, you tell PVsyst which sub-arrays belong to the same inverter and how the power of the inputs is balanced.
-
Load Profile Graphs Missing/Incorrect in Report
Lazare Fesnien replied to lenergy's topic in Problems / Bugs
Hi, Sorry for the inconvenience, this is due to a bug in an older version. These issues have been resolved in our new releases -
Hi, The number of modules in series has to match the following conditions: - The minimum array operating voltage (i.e. at max. module operating temperature, 60°C by default) should be above the minimum inverter's operating voltage (Vmin of MPPT range). - The maximum array operating voltage (i.e. at min. module operating temperature, 20°C by default) has to stay below the maximum inverter's operating voltage (Vmax of MPPT range). - The maximum array absolute voltage (i.e. Voc at min. temperature, -10°C by default) has to stay below the absolute maximum inverter's input voltage. - The maximum array absolute voltage (i.e. Voc at min. temperature, -10°C by default) should not overcome the maximum system voltage specified for the PV module. When the desired array configuration doesn't match these requirements, the system is usually not properly sized. Please see the diagram in the "System" definitions, button "Show sizing", which summarizes all these constraints: Design temperatures : These conditions involve design temperatures, which are part of your project and may be changed according to your climate in the definition of the project, option "Albedo and settings". The default values (for each new project) may be redefined in the Hidden Parameters, topic "System design parameters". These are: - Maximum cell temperature in operating conditions, default 60°C, - Summer usual operating conditions, not used for sizing constraints, default 50°C, - Winter minimum cell temperature in operating conditions, default 20°C, - Absolute Cell lower temperature for determining the Maximum possible voltage of the array. The default is set to -10°C for most European countries (best practice rule). For this limit, the cell temperature is considered as the ambient temperature (worst case when the sun suddenly appears on the field). You should define the lowest temperature ever observed during the day for this site.
-
Hi, Can you describe precisely the error you have?
-
Hi, We update the database using the requests of the manufacturers, and publish it with each new issue of PVsyst. We can't of course follow all the new products of all manufacturers in the world. We don't want to include data without the acknowledgement of the manufacturer. Nevertheless you can easily create your own components by yourself. The easiest way is to choose a similar existing device in the database, modify its parameters according to the manufacturer's datasheets, and save it under a new name, therefore creating a new file in your database. You have a tutorial for that on youtube: https://www.youtube.com/c/PVsystTutos, page Component database