


Lazare Fesnien
-
Posts
269 -
Joined
-
Last visited
Posts posted by Lazare Fesnien
-
-
Dear Sharoff Dion,
The "quick optimization" tool is a display tool, it has no impact on the simulation.
By default PVsyst checks the "winter" box.
Regards
-
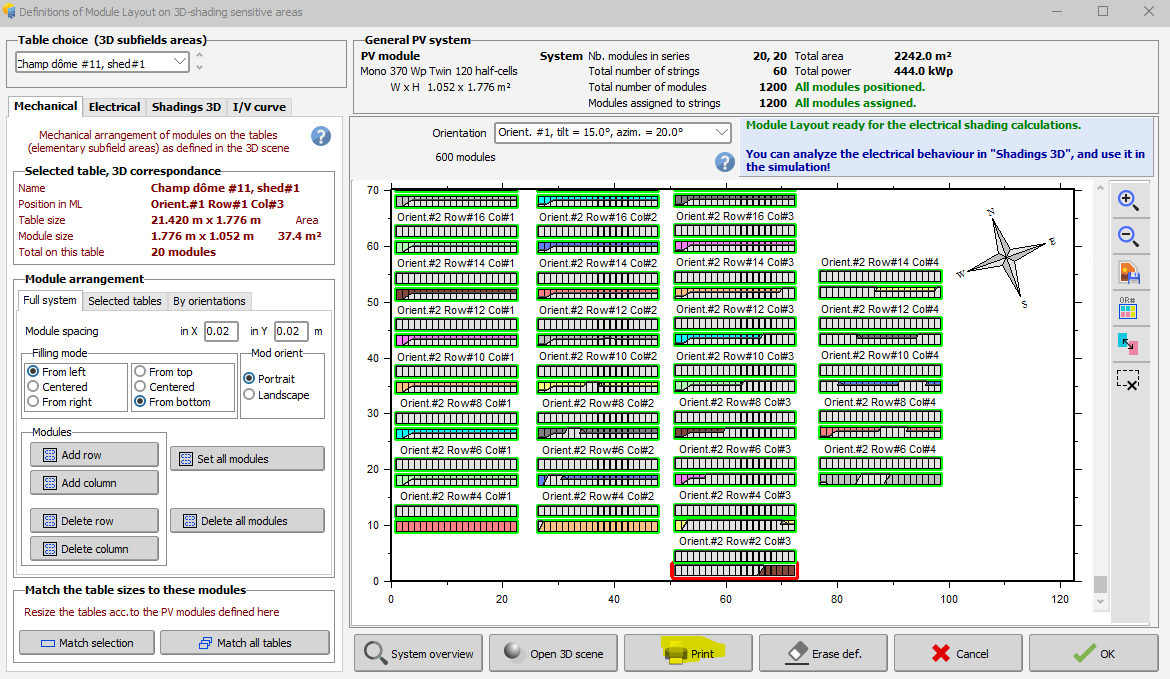
Dear Garf,
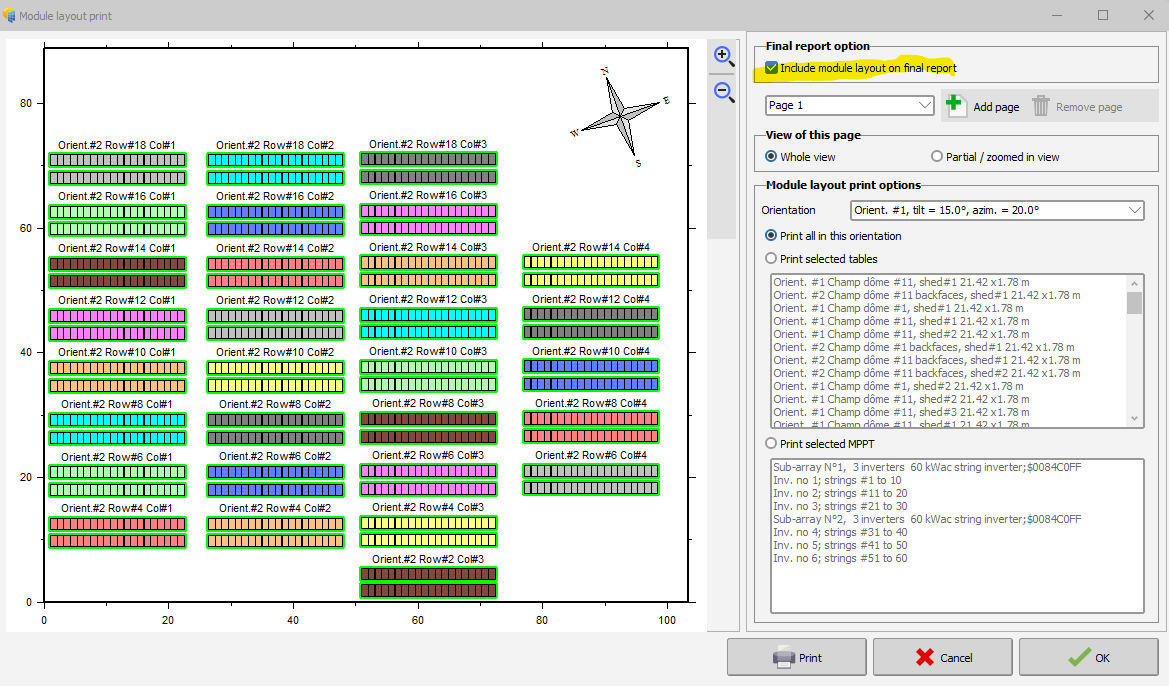
To do this, please click on "PRINT" :

Then check the box "include module layout on final report" :
Regards,
-
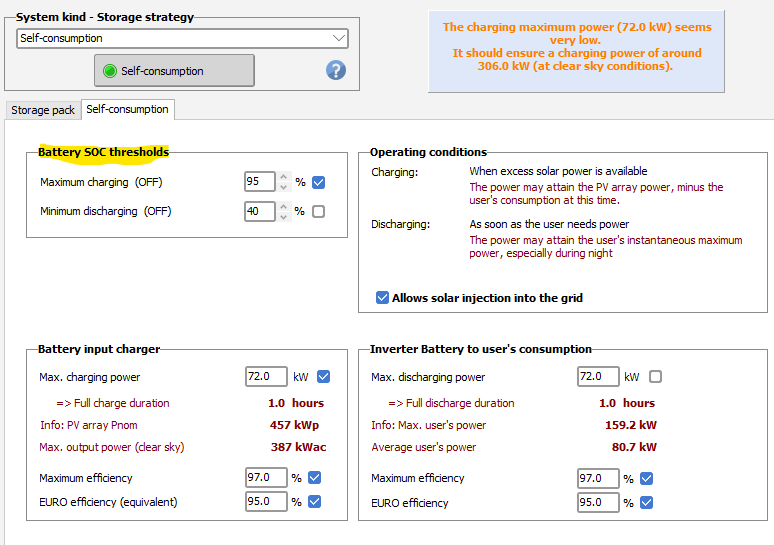
Dear Nio,
In a project connected to the grid, this changes here :
-
The absolute low temperature is not taken by the meteo file.
You can modify it if you have data on it.
Please read our FAQ : https://www.pvsyst.com/help/pvmodule_lowlighttool.htm?zoom_highlightsub=low+light
-
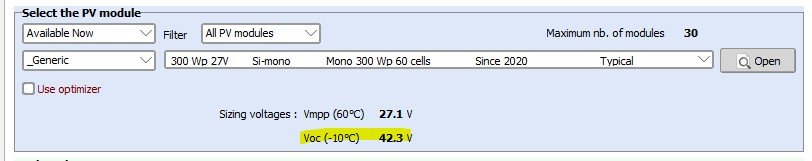
Dear Moataz,
In the system tab, when choosing the PV module, PVsyst displays the voltage Voc at -10°C. It is this value which is taken into account for the calculation of the maximum number of modules in series.
Absolute Cell lower temperature for determining the Maximum possible voltage of the array. The default is set to -10°C for most European countries (best practice rule).
For this limit, the cell temperature is considered as the ambient temperature (worst case when the sun suddenly appears on the field).
You should define the lowest temperature ever observed during the day for this site.
NB: these parameters are used for design only. They are not involved in the simulation in any way.
Please read : https://www.pvsyst.com/help/inverter_array_sizing.htm?zoom_highlightsub=Array+voltage+sizing
Regards

-
Dear Sir,
Can you send us your project in ZIP format to support@pvsyst.com in order to give you a precise answer?
-
Dear Sir,
Can you send us your project in ZIP format to support@pvsyst.com in order to give you a precise answer?
Regards -
Bonjour,
Cela est très étrange effectivement.
Pouvez vous nous envoyer votre projet zip à l'adresse support@pvsyst.com ?
-
Dear Said Allaw,
The "Reactive power" is not a real electrical power: you cannot produce any movement or heat with it.
Reciprocally, the production of reactive power doesn't consume any "real" (active) energy.
Now the output electronic circuits of some inverters are able to "produce" a reactive power on the grid, by "absorbing" power from the grid and "reinjecting" it with a phase shift. They may behave in the same way as a capacitor for "absorbing" reactive energy (or possibly an inductor, but this is not useful). This feature is sometimes provided by PV plants to the grid, especially during night.
This contribution is not treated by PVsyst, as it is not related to the PV production. PVsyst only treats the Reactive power associated with a PV "active" power production. The reactive power treated in PVsyst is always proportional to the Active power.
The operating value will depend on the available irradiance. This always produces the active power (POutInv = Parray * inverter efficiency).
Now if you have defined a phase shift, the inverter will also produce a reactive “power” POutInv_R = POutInv * Sin(Phi). But this doesn’t consume any additional power.
-
Dear Said Allaw,
PVsyst treats the Reactive power (or energy) linked to the PV production. This is done by a constant factor (Cos(Phi)) specified/required by the Grid manager. This reactive power is proportional to the produced energy.
See the help " Project design > Grid-connected system definition > Power Factor".
A reactive power may be created or absorbed, depending on your definition (Leading or Lagging power factor)
-
Dear Said Allaw,
Currently PVsyst does not allow pumping simulation without reservoir.
You can either put a very large or very small tank in the system to get around this limit.
-
Dear SSIRIS,
Yes it's intentional.
This function is under development by our teams.
Regards,
-
Dear Bendesa1962,
Can you make me a screenshot of the window with this error to explain ?
-
Hi,
Below is a link to a PVsyst video explaining how to create an OND file.
If you are stuck, you can send us your OND file and datasheet so that we can help you solve the problem (support@pvsyst.com)
-
Dear Ayad,
The ohmic resistance of the wiring circuit induces losses ( ELoss = Rw · I² ) between the power available from the modules and the power at the terminals of the sub-array.
The relevant parameter for the simulation is the Rw value, which is an equivalent resistance of the wires, as "seen" from the input of the global sub-array (i.e. the set of MPPT inputs defined in this sub-array). You should define one Rw value for each sub-array in your system.
A PVsyst tool allows you to easily calculate this information in "Detailed Losses" then "Ohmic Losses" then "Detailed Computation"
Regards,
-
Hi,
You can account for the aging of the PV modules in ‘Detailed losses -> Aging’. This allows you to make a simulation for one specific year of operation. You can also make multi-year simulations in ‘Advanced simul. -> Aging tool’.
PVsyst will not change the nominal power of the PV modules, but simulate with a model of degraded PV modules. This means that the performance ratio PR will decrease with time, since nominal power stays the same, but effective generated power will decrease.
The aging of inverters is not modeled in PVsyst.
For more explanations on how to use the aging tools of PVsyst, please see the corresponding help page : https://www.pvsyst.com/help/ageing_tool.htm
-
Hi,
It all depends on the characteristics of your system.
There is no good or bad value
-
Hi,
This difference is due to several reasons :
- In grid connected, the inverter has effective MPPT inputs to seek the maximum power point
- Stand alone, regulators with MPPT don't have good efficiency.
In the grid connected system, losses and gains are put by default in the tab "detailed losses" it's necessary to look at the two complete reports to visualize the differences.
-
Hi,
Can you send me an image of the error in order to understand the context ?
Here are some explanations below while waiting for a complement :
https://www.pvsyst.com/help/simulation_variables_standalone.htm?zoom_highlightsub=Array+oper
-
Hi,
The value 165.6 MWh corresponds to the energy injected into the grid (coming from your PV production).
The value 158.9 MWh corresponds to the energy needed from the grid to supply your load profile.
When your production is greater than you load profile, energy has to go somewhere, either into batteries or into the grid.
If you want to use only the energy of your PV array, you must either modify your load profile or set up a battery park.
Regards
-
Hi,
Currently, it's not possible to add consumer lines, we will develop this soon.
Regards,
-
Hi,
These results are annual, to understand where the missing energy comes from you can look at the diagram of the losses month by month in order to control these values.
Regards,
-
Hi,
Remember that the Active Power [kW] = Apparent power [kVA] * cos(Phi).
The real power (i.e. corresponding to a useable energy) is indeed the active power. This is what is produced by the PV array and transformed by the inverter into output power.
The apparent Power is the quadratic sum of the active power and the reactive power. But the reactive power IS NOT A POWER. You cannot produce movement or heat with it.
If the limit is specified as Active power, the actual limit is completely independent on the Power factor.
-
Hi,
With an error in red, you cannot continue in the simulation.
To resolve this error, you can uncheck the "efficiency defined for 3 voltages" box and click on the "efficiency curve" page to check if a EURO and MAX efficiency value is well defined.
Module Orientation for Standalone PV system
in Problems / Bugs
Posted
If you have made an orientation and azimuth choice with an annual irradiance optimization, the first estimates appear. When you click on OK and then return to the window, PVsyst does not change the Azimuth and tilt values but does not show the graph by default in Winter (the most unfavorable) this does not change the simulation or your parameters