All Activity
- Today
-
 Raquel Freitas joined the community
 -
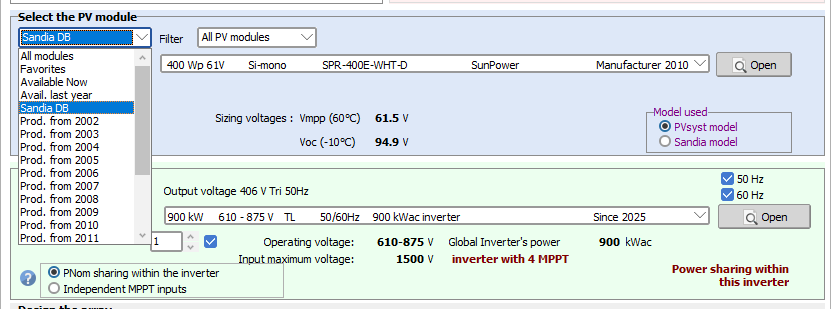
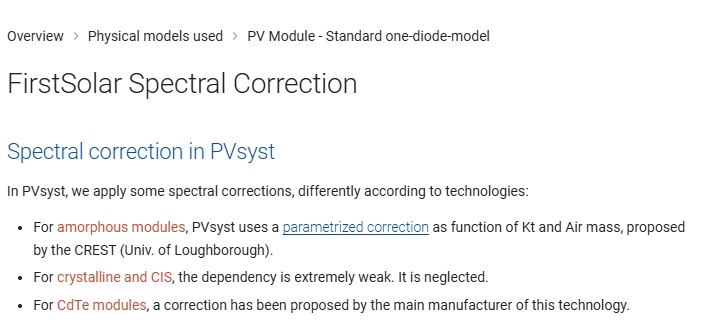
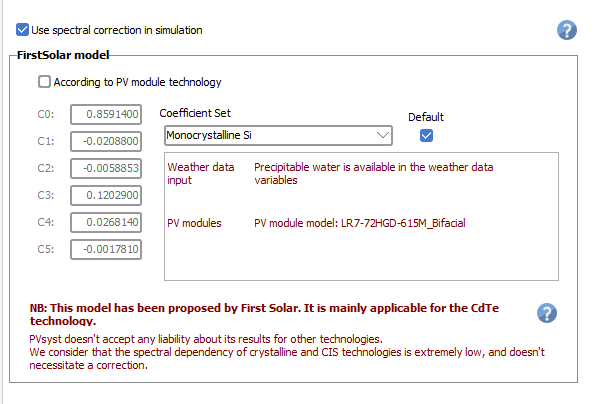
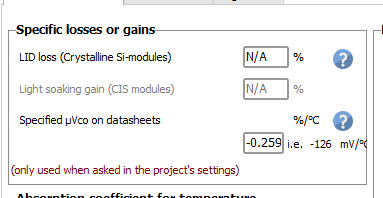
Hello, The Sandia model is only an option for panels in the Sandia database. You can choose to filter the Sandia Database among the available panels and there you have an option to change to the Sandia model. In your print screen, you have defined the First Solar Spectral correction. By default PVsyst propose no spectral correction for crystalline modules

-
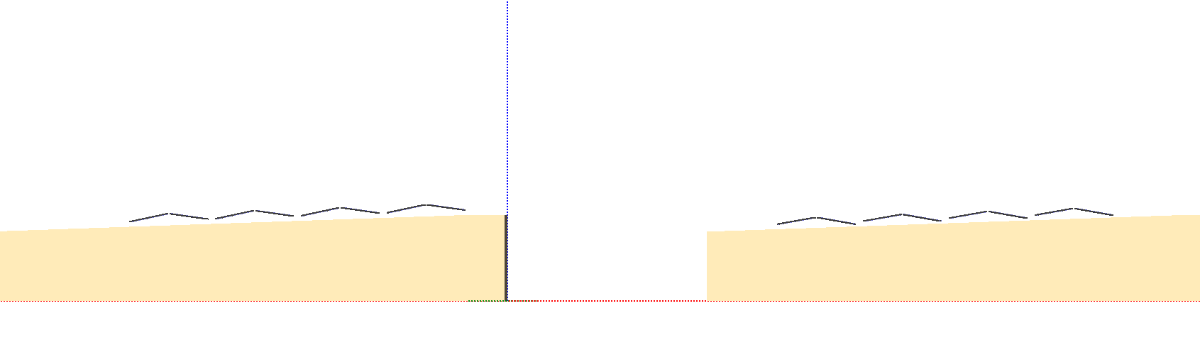
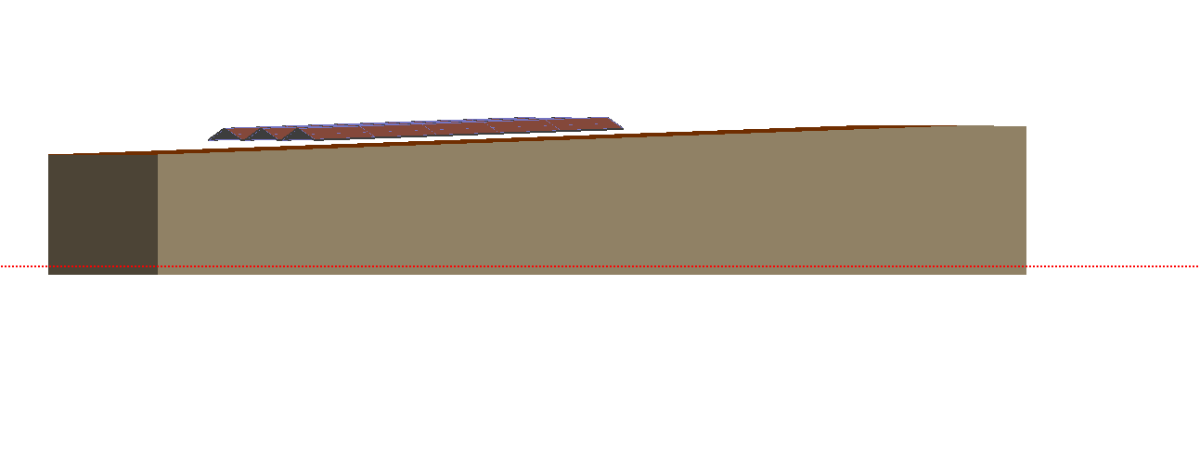
Hello, If the domes are placed along the tilted roof, you can simply add a "baseline slope" of 2° and the domes will follow the roof: In the case the domes would be placed perpendicular to the slope, it is less straight foreword. - By creating an array of domes, right click on the array and "ungroup", then mark all the tables and in the "Scene object", right click and use the "automatic altitude option". This is the alternative to right in the image, where the pair of domes are horizontal, though each pair are following the tilt of the roof. - By creating an array of domes, right click and "convert to domes to fixed tables", then mark all the tables and in the "Scene object", right click and use the "automatic altitude option". The altitude for each table will then precisely follow the tilt of the roof, though the tilt of the panels should be adapted to arrive compensate for the tilted roof. In the "list and management of objects (Ctrl+G), add 2 degrees to the tilt for the lower panels, and reduce the tilt with 2° for the upper panels. This is the alternative to the left in the image. I hope this answers your question
-
Hi, Indeed you should check the multi-MPPT feature and click on the Power sharing button to activate the power sharing feature (drag the sub-array from the list to the right to the configuration to the left). By defining this correctly, it would be expected to decrease the overload loss over nominal inverter power.
-
.thumb.jpg.7a7a69b1be13dd12a84d60db91984313.jpg) Amigo Tyres joined the community
Amigo Tyres joined the community -
Thanks you for your response!!
-
Ahhh... Understood, thank your Linda, many thanks for your response.
- Yesterday
-

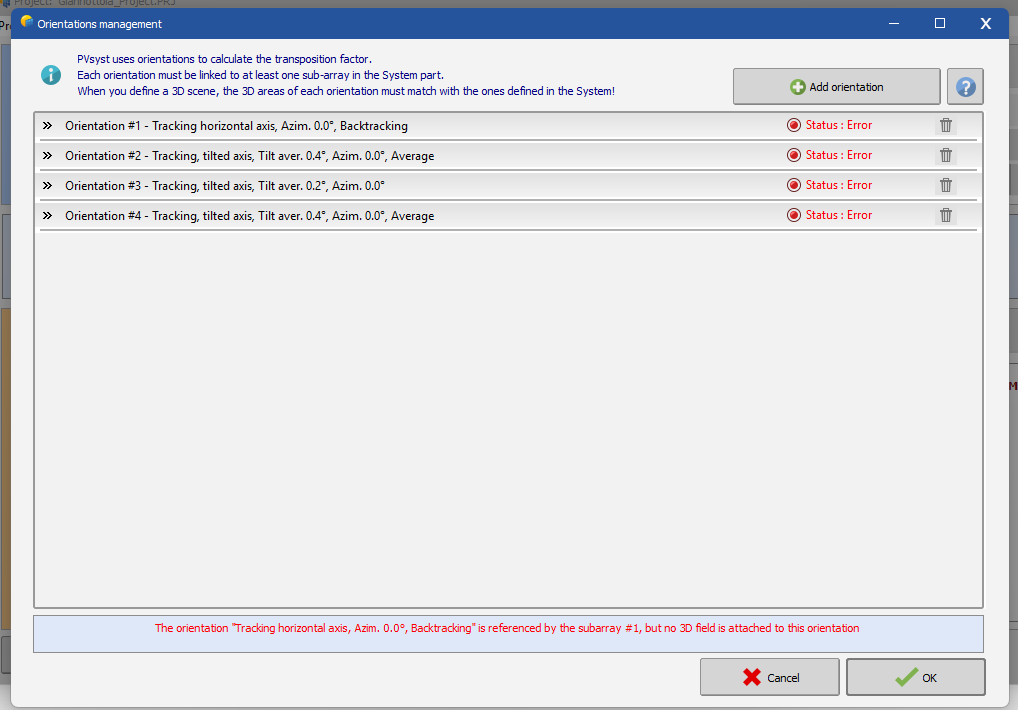
Error for two orientation when importing virtocad PVC file
sherry replied to sherry's topic in Shadings and tracking
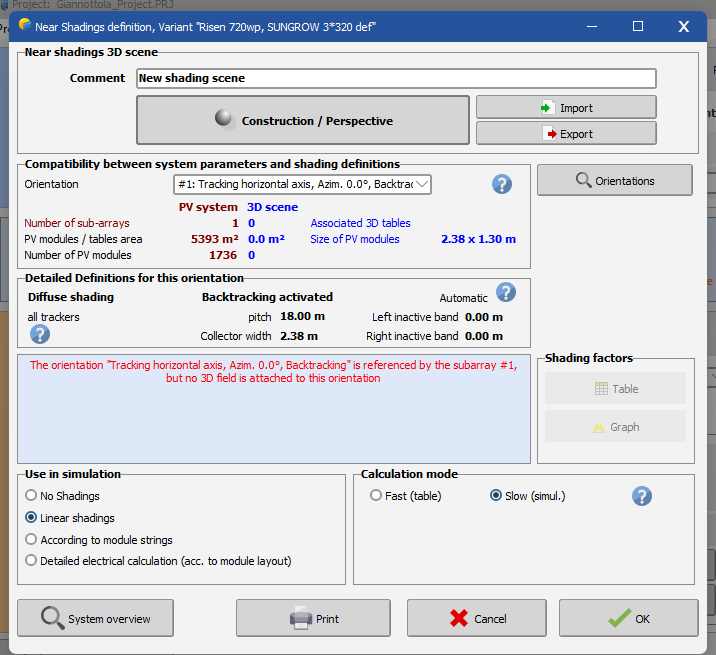
However, I only have one orientation. I am not satisfied with the new update of PVsyst; I think the previous version (7) was better than the 8 . -
I imported a PVC file from VirtoCAD into PVsyst 8.0.9, but during the simulation, I got an error stating that there are two orientations. ''the orientation tracking horizontal axis,azim 00 backtracking is referenced by the subarray 1,but no 3d field is attached to this orientation'' but i didnt add all these orentation that you can see in the photo .... in pvsyst 8.0.9, can anybody resolve this problem?
-
Hi, Your answer helps me a lot. But there is one thing I'm concerned about. Do I need to check on the "Multi-MPPT feature"? Because the message describes my inverter configuration exactly, it also lowers my production simulation. I wonder which is correct.
-
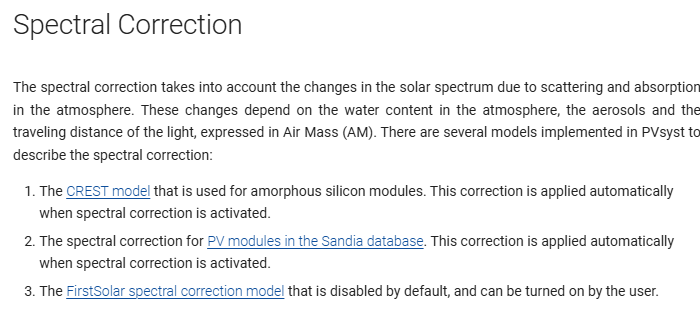
Hi, I model utility scale n-type mono crystalline PV modules. I am not sure what settings for Spectral Correction I should use. I am aware that the FirstSolar model is not considered reliable. However, I would like to take into account the Spectral Correction for PV modules in the Sandia Database. To my understanding, even if the module used is not available in the database, a similar module is selected for the spectral correction. Is below the correct way of setting the spectral correction, in this case? Thanks!
-
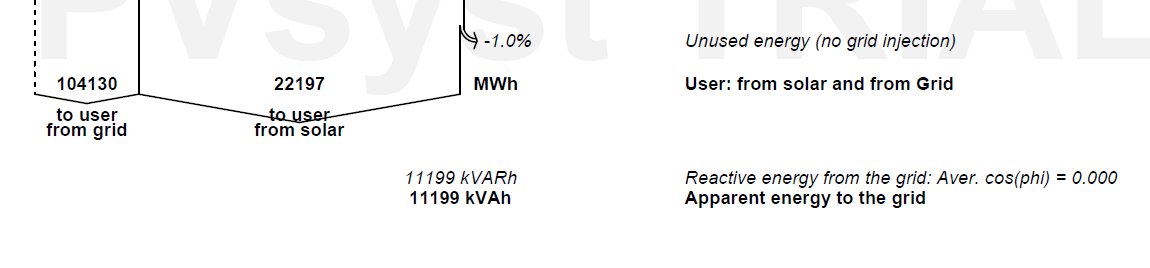
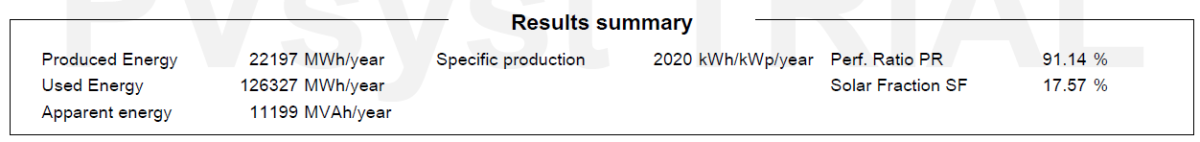
 Good evening, I've been working on a simulation for a grid connected self consuption pv plant. I considered a power factor of 0.9 in order to take into account the needs of reactive power and the losses diagram shows the results with, at least in my opinion, the wrong units and the wrong name: The "Apparent energy to the grid" should be "Reactive energy to the grid", and the units MVARh Also, the results summary part has an error too: The "Apparent energy" should be "Reactive energy" and the units MVARh/year; if it has to show the Apparent energy, the absolute value showcased should be higher than the absolute value of "Produced Energy". I'm using the 8.0.9 version of the software. I guess that this a bug cause I've made other versions of this same project and the errors persist. Thanks in adavance for your answer.
-
Patricio Segura joined the community
-
 buffelkip joined the community
 -
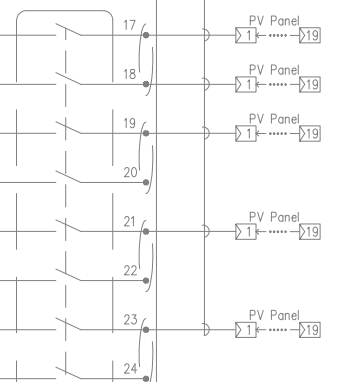
Hello, 1/ It is important that you have a multiple between the number of strings and number of MPPT inputs so that PVsyst can equally distribute the strings over the MPPTs, since there is no power sharing within the sub-array, only between the sub-arrays. 2/ I understand that your inverter has 12 MPPTs, some MPPTs with 2 strings and others with 1 strings, some with 18 panels in series and others with 19. You can either define each MPPT individually in separate sub-arrays: - 1st sub-array with 2 strings of 18 panels - 2nd the same - 3rd sub-array 1 string of 18 - etc. Or you can group all the MPPTs with the same configuration in the same sub-array, for instance: - 1st sub-array with 3 MPPTs with 6 strings of 18 - 2nd sub-array with 3 MPPTs and 3 strings of 18 (just to highlight here that it would not be correct to define 6 MPPTs with 9 strings of 18, since it would not be a multiple between the number of MPPTs and number of strings) - 3rd sub-array with 5 MPPTs with 5 strings of 19 - 4th sub-array with 1 MPPT with 2 strings of 19 If you have 11 inverters with the same configuration, you can multiply the number of MPPTs and the numbers of strings in each sub-array with 11 (33 MPPTs and 66 strings in the first sub-array etc.) I hope this clarifies the use of the Power sharing feature. You find more examples in the following youtube tutorial:
-
Hi, I need to model a PV system with Domes (East West 10 deg tilt) on a 2 deg tilted roof (East West). Can this be modeled selecting Orientation as Domes? OR how it should be done? Thanks. Shakya
-
 Shared Spaces In Gurgaon joined the community
 -
 ste.satel joined the community
 -
Hello, We are trying to model single axis trackers on different slopes: - from +5 to -5 degrees N-S - from +5 to -5 degrees E-W The 'axis tilt' value for trackers can be changed to model N-S slopes in an array of trackers in the 3D scene. However, when we do a message appears saying "tracker axis must be horizonal for PVsyst to model the bifacial gain". Is there no way around this currently? Secondly, there doesn't seem to be a method of inputting a E-W (tracker to tracker) slope for the array of trackers. Please could you point me in the right direction if there is a way of doing this? Kind regards, James.
-
Hi Dtarin, I try it and when I maximize again the window, the drawing area automatically shrink.
- Last week
-
Reduce the size of the window then maximize again.
-
I guess it depends on whether you think the degradation rate is a positive or negative number. When I see "annual guaranteed lower limit diminution rate," I think in terms of the magnitude. I believe that the warrantee specifies the maximum amount of degradation you are supposed to see, not the minimum. The minimum would be 0% (least degradation). The graph also shows that the warranted degradation rate is the greatest (largest decrease), but the resulting efficiency is the lowest. Personally, I would buy the modules with the lowest degradation rate. [Maybe this would be clearer if the words "greater" and "lower" were used rather than "higher" and "lower," because the second pair of words implies a direction rather than the overall size of a change? Not sure.]
-

PVsyst Aging _ Clarification on Degradation Calculation in PVsyst
LauraH replied to Kanagavel K's topic in Simulations
Kanagavel -- The degradation used is the average over each year. The important thing is that the warranty is not an absolute value, it is a degradation RATE. So if the warrantee is 0.5% per year, the degradation proceeds as follows: Year 1: 0% to 0.5%, average 0.25% Year 2: 0.5% to 1.0%, average 0.75% Year 3: 1.0% to 0.5%, average 1.25% By the end of each year, degradation has increased 0.5%, so the step from year to year is 0.5% or the warranted rate. Note that, as stated elsewhere, this form of degradation isn't the only one the plant undergoes. For example, module capacity mismatch increases as some modules degrade faster than others. This is accounted for separately in PVsyst. -
 Philip joined the community
 -
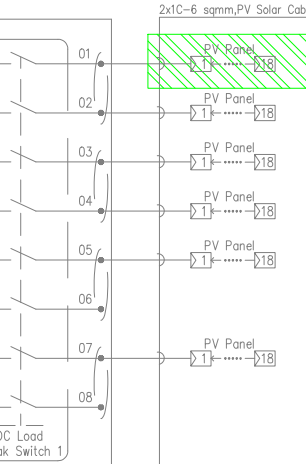
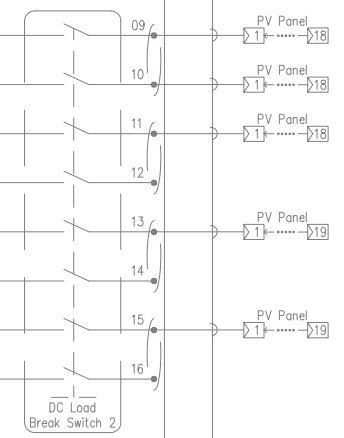
Hi there, I am using PVsyst for some rooftop solar project designs. And here are my problems: 1/ Sharing power function. "The power sharing of the PVsyst model acts between sub-arrays, but not within a sub-array." I didn't understand it clearly. Could anyone explain it more? Thanks 2/ I have an old project. It used Sungrow SG125cx-p2 with a DC single-line diagram like the one below. My question is: How can I define this in the sub-array function? Because the old simulation looks incorrect. More info: DC/AC = 1.337. PV 580Wp. And I have 11 Inverters configured like this.
-
Dear Johnny, First of all, in a self-consumption + storage system, the system responds to the user's load. So, if you have a small load profile and a large PV system, excess energy will be injected into the grid. Since I don’t know your exact goal, I suggest creating multiple variants — starting with fewer PV modules, then trying with higher storage capacity. This will give you different results and help you find the best configuration. Regards,
-
 Evie Buckmaster joined the community
 -
 BAMOGO Abdoulquemio joined the community
 -
 Jose B.M. joined the community
 -
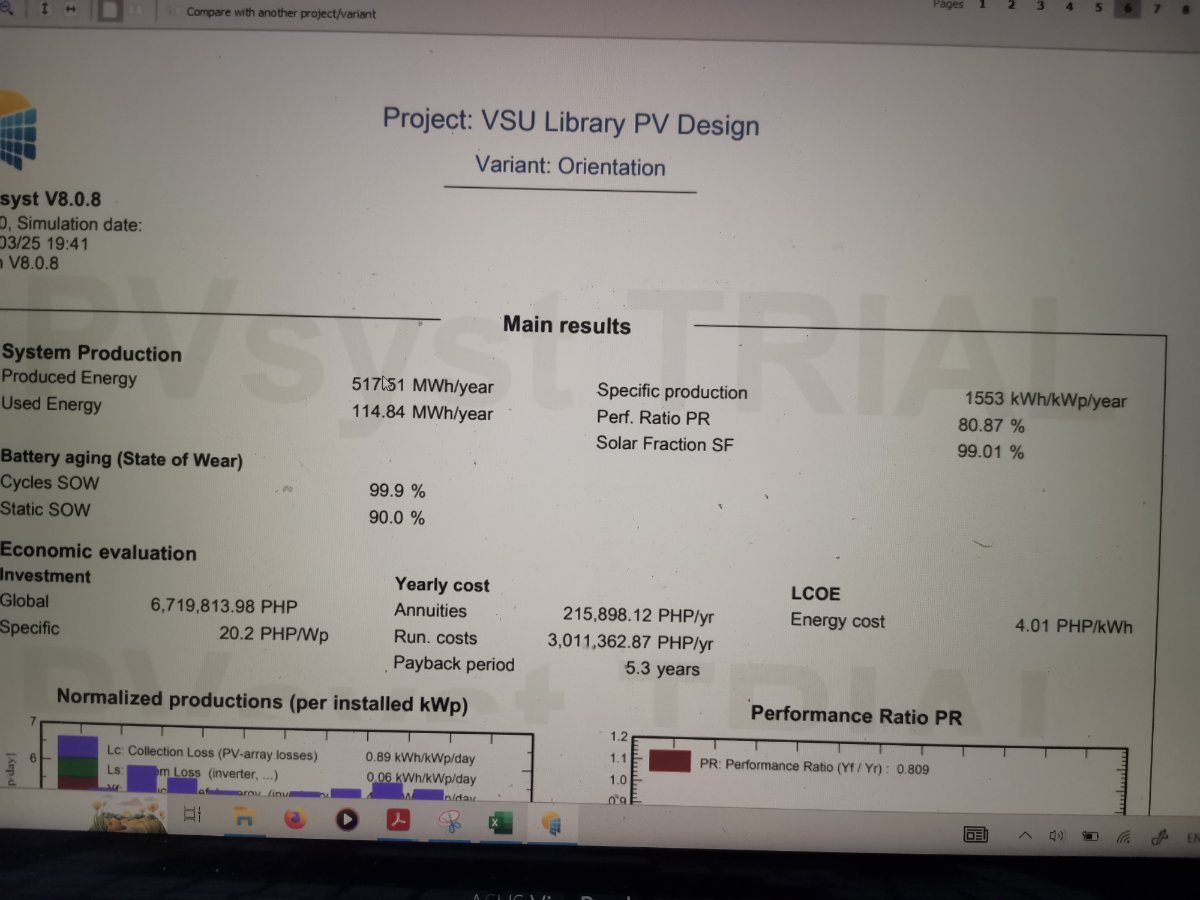
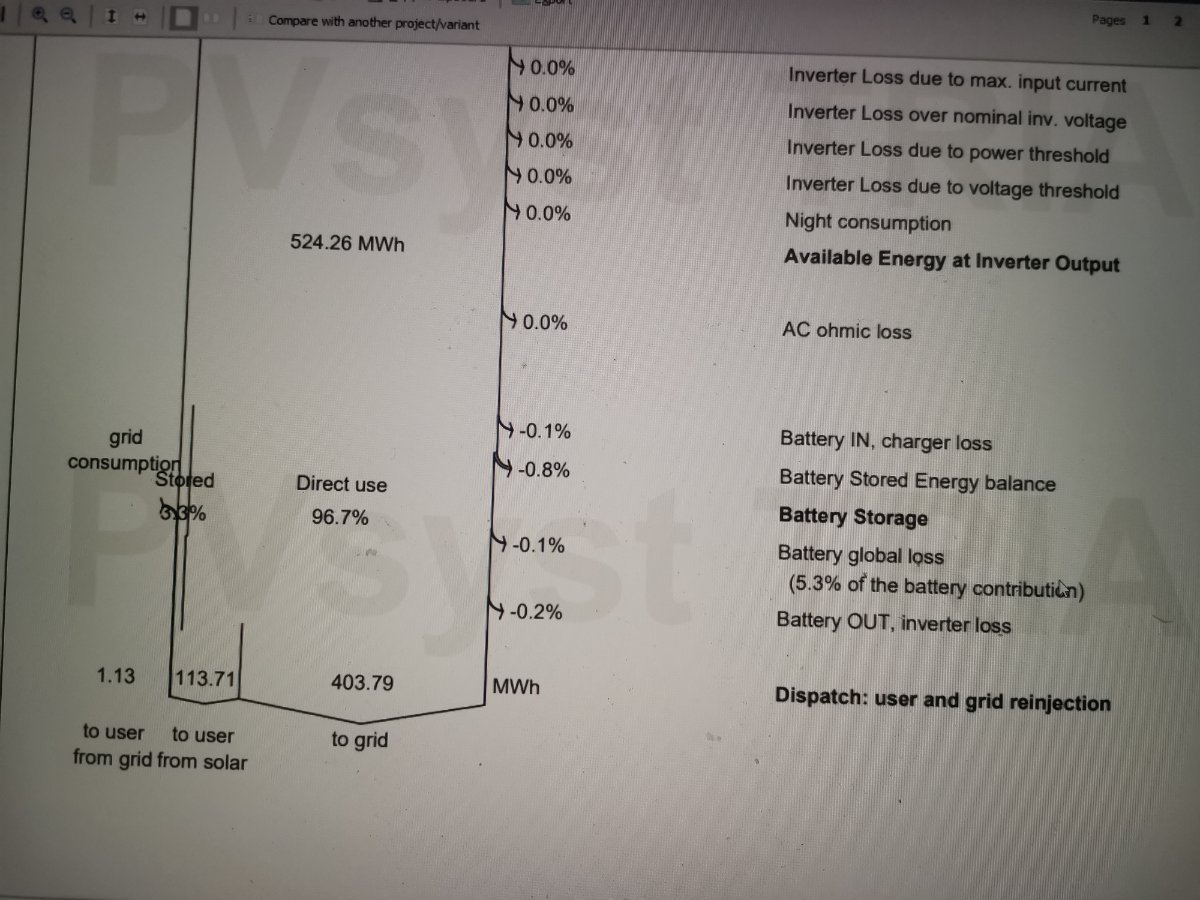
Hello everyone. I'd have hard times using this software since I am new. I am designing a hybrid system with battery. I'd like to ask if how to properly design my system since I have only a daily demand of 313kWh and my PV system panel that is to be yield is 333kW per day. However, as I simulate my system for a year it has a lot of energy excess that is to be sent on the grid which is not ideal since my goal is that the PV should utilize the energy and the minimal excess must be on battery or to sale on grid.
-
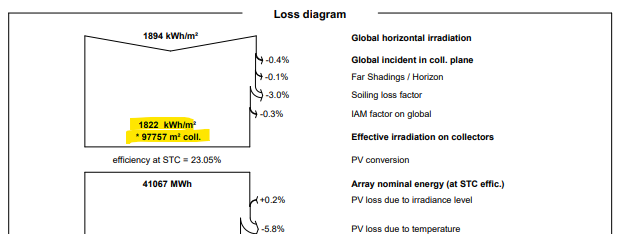
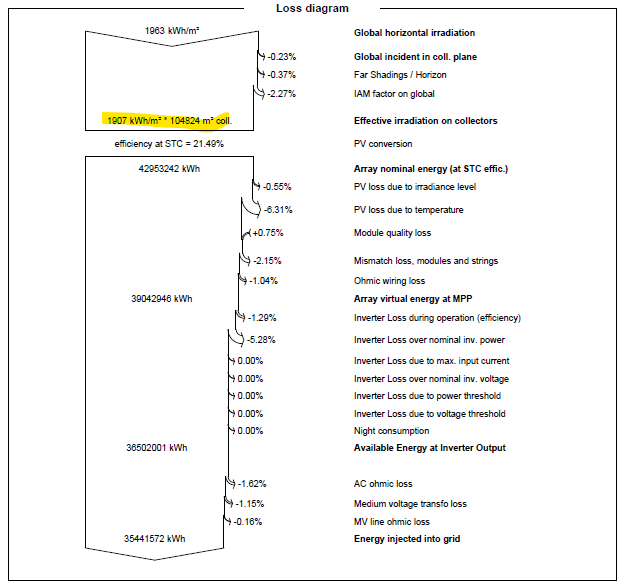
Hello, Indeed, the first input of the Global horizontal irradiation is different between the two diagrams. Verify that you have the same coordinates and are using the same weather data provider.
-
To modifiy this parameter, you must go to the file in question then : "Additional Data" then "Secondary parameters" :
-
Hi all, I been learning to use Pvsyst, i recently try to compare my simulation with my friend. In the loss diagram i found that the Irradiation level for both are different. Any other setting or configuration i might need to look at given the location set point is the same.
-
 BillingSoftware changed their profile photo
 -

Units of Energy in PVsyst 8760 CSV Output File
Luca Antognini replied to kjs55's topic in Suggestions
Hi! The variable in the hourly energy variables are sometimes displayed with units "kW" instead of "kWh". This is indeed a bit confusing but for time step of one hour this is equivalent. The case of the apparent and reactive energy units should be unified with the rest in the future. In particular the reactive energy should be displayed by convention in kVARh instead of kVAh (even though they are all pseudo-units, equivalent to kW in the end). -
Luca Antognini changed their profile photo
-
Any response here ?