All Activity
- Today
-
Dear Pvsyst CLI team, Is it possible to API Interface with Pvsyst CLI Thanks & Regards, Kanagavel K
-
 oomar_d joined the community
 -
Hello, The values used in the system sizing serve only as a guideline and provide an order-of-magnitude estimate, considering only the initial front-side production (excluding for instance losses and rear-side generation). For an accurate assessment of overload losses, you should run a simulation.
-
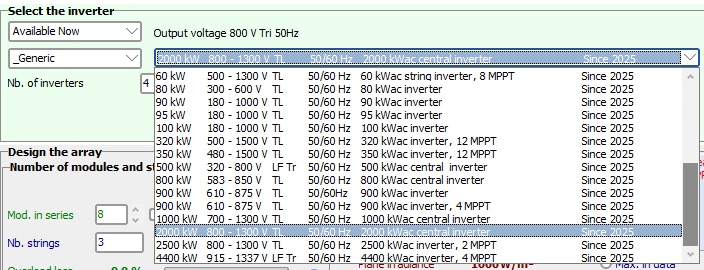
Among the Generic inverter in the database, you can find examples of central inverters. Here you see that there are no MPPTs. By opening the .OND file, you find this information in the Additional parameters tab.

-
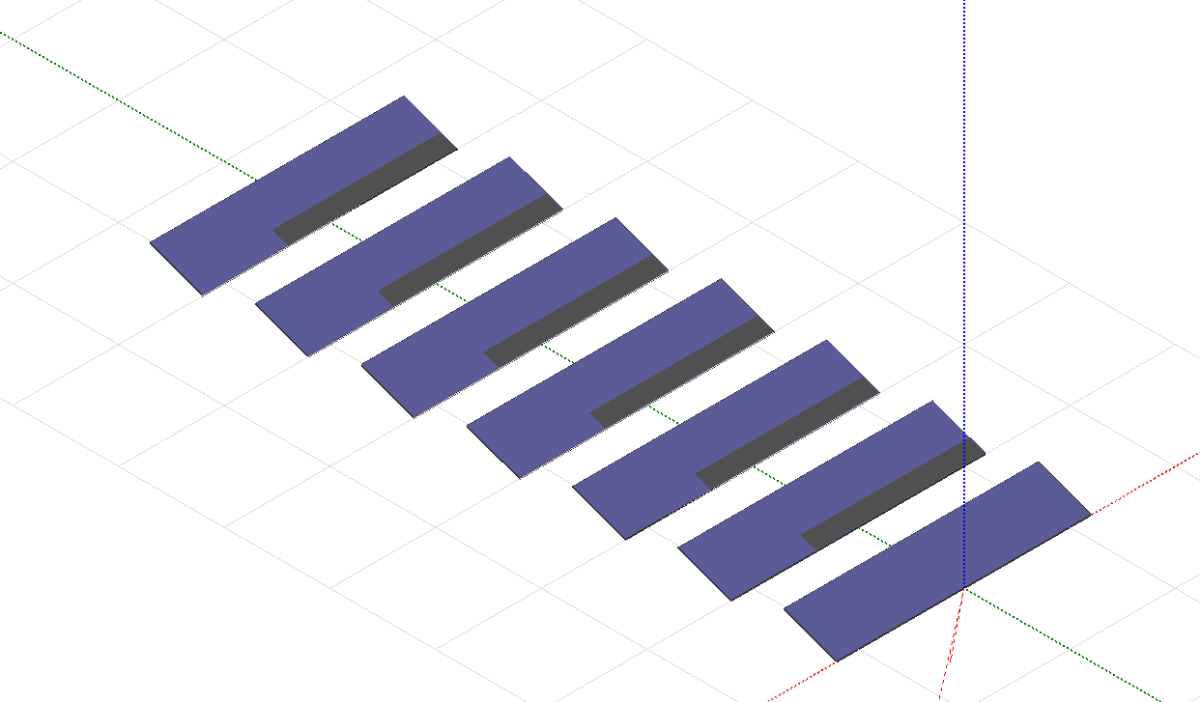
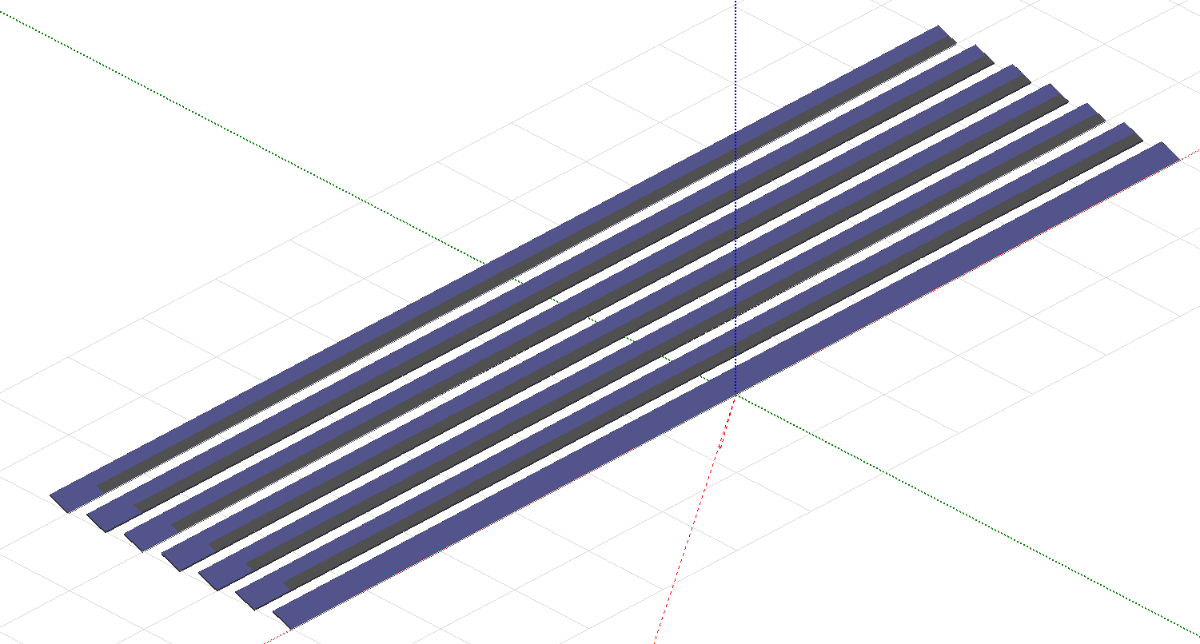
Indeed, the first row will not have any mutual shadings. For “unlimited” long tables, mutual shading can be applied uniformly across the entire row, allowing edge effects to be neglected. In the two images below, you can see an example, that for long tables, the impact of edge effects is limited to the lower-left corner and is therefore negligible. However, for shorter tables, this assumption becomes less valid.
-
 Hi, We were trying to decrease the file size of the report for a very complex simulation by decreasing the resolution setting to the lowest possible but the exported file doesn't seem to change at all even when setting it to max or min values. Is this not the correct setting? Thank you and best regards
 -
Hi, While working with Bifacial module ,the system sizing in PVsyst is considering only the front side side parameter ( Neglecting Imp due to rear side) to calculate the string sizing, Inverter overload losses and Pnom ratio.I understand that bifacial gain highly variable outcome but under certain conditions rear side contribution would lead to higher overload loss and Pnom values.I want to understand how PVsyst is considering the bifacial outcome in system sizing.
-
So I am designing a 2MW FPV system and in the design I used about 7 strings inverters and no MPPT, does this mean they are central?
- Yesterday
-
 TAPOTANAY joined the community
 -
 This will describe how to use PVsyst on an Azure Virtual Machine, which is different from Azure Virtual Desktop. Azure Virtual Dekstop is not suitable for PVsyst as it is running on a specific Windows version which is actually a Server version. To be able to use PVsyst on Azure VM you need to make sure that you attach a secondary hard drive to the VM because the OS harddisk ID will always change when rebooting the machine. So basically you can create a basic HDD (not even an SSD) of 32GB (minimum available size now) and attach it to the VM prior to activating PVsyst. If you already activated PVsyst on the machine, you need to contact our support in order to reset your license : https://www.pvsyst.com/contact/
 -
Hello, In the database we unfortunately do not have a filter to sort out the central inverters from the string inverters. In PVsyst, the difference from a string inverter and a central inverter would be characterized by the fact that the central inverter do not have multiple MPPTs
-
@dtarinCan you please clarify how these modules (Modules along the edge) receives less shading. Because I think only the first row will receive less shading while rest of row will have similar shading effect due to mutual shading. Does it also means that given project would always generate more power in 3D scene in comparison to Unlimited tracker mode.
-
 Anna Bertomeu joined the community
 -
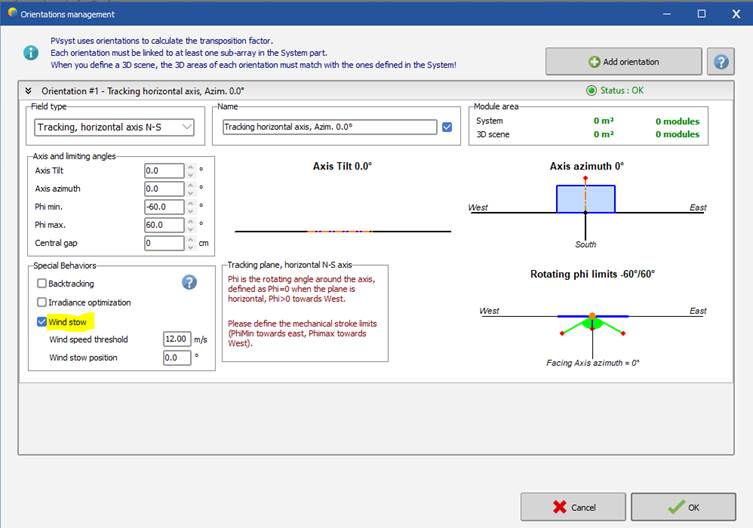
Hello, PVsyst does not consider any loss due to tracking inaccuracy and there is no general “other losses” parameter, though you could possibly add such a loss as a “soiling loss” for instance. If wind velocity is available in the meteorological data, you can simulate wind stow behavior. You would define a wind speed threshold, and if the wind speed during a particular hour exceeds this threshold, the simulation would be done for the defined wind stow position for that hour. This would normally result in a less optimized tilt angle and thus less production, though it will not directly appear as a loss in the loss diagram.
-

Finding out the reflection caused by the solar panels
Adeline replied to Adeline's topic in Simulations
Thank you! -
In general, the denomination of a given time interval in PVsyst is always defined as the beginning of this interval. This is valid for hourly, daily or monthly values. For meteo data, the time stamp is the time interval over which the irradiance measurement (or any other value) is averaged. For example, the time stamp 11:00 corresponds to measurements averaged between 11:00 and 12:00. When using irradiance models, the solar geometry should be calculated for an "average" of the time interval. PVsyst uses the middle of this time interval (in the previous example 11:30). Different weather data providers have their own definition of the timestamp and thus will be adapted to match the one in PVsyst.
-
I have a question regarding the use of the central inverter. I am designing a 2MW floating PV system and the system suggested string inverter, however, I would like to try the central inverter to compare between systems. Where can I find the central inverter option?
- Last week
-
Regarding the orientation and tilt angle of the panel, I recommend you to double check the normal orientation in Rhino before exporting the file, because PVsyst reads the orientation according to the default Z+.
-
 RhondaSeverson joined the community
 -

Energy Generation Difference between Report and Aging Table
dtarin replied to Solaranger's topic in Problems / Bugs
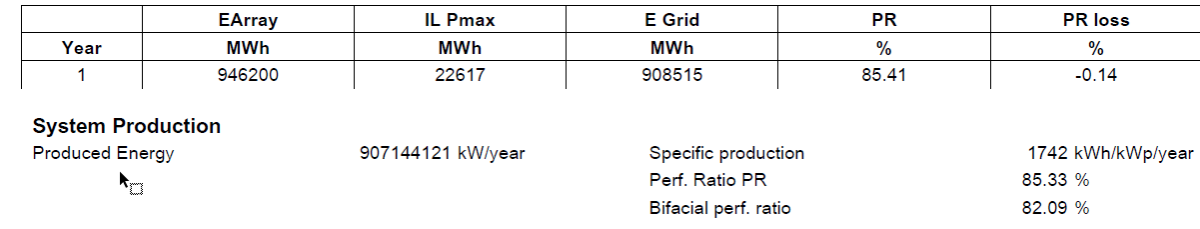
I am seeing difference of 0.15% in 8.0.12 which is non-trivial. Aging tool on top, PVsyst report result on bottom.
-
Useful Out and Egrid are the same. I suggest including InvOut It seems IL Pmax will include grid limitation loss when there is a limit applied in the IL Pmax figure, even if it is set to account for loss separately under energy management. I suggest quantifying IL Pmax as its defined in energy management, or by default include POI loss as a separate value, and let users add together if they want. EArrayMPP is more useful than EArray, I recommend adding it or replacing EArray with it.
-
PVsyst doesn't output 8760 files past year 36. It will complete the simulations and generate the pdf report, but not the excel output. v8.0.12
-
 Abraham Osei Nyarko joined the community
 -
Hi all, I’m currently working on large-scale solar PV projects using single-axis trackers with bifacial modules, and I had a couple of questions regarding how PVSyst handles certain tracker-related losses. Tracking Accuracy Loss: Does PVSyst internally account for any energy loss due to tracking inaccuracies (like small misalignments or sensor/controller errors)? If not, is it recommended to include this manually under “Other Losses”? If so, what would be a reasonable default assumption? Wind Stow Loss: In cases where trackers go into a stow position during high wind events, is there any way to model this loss in PVSyst? Or should this be estimated separately and added manually to the loss diagram? Both of these can add up to 1–3% energy loss annually, and we want to make sure they are properly accounted for in our generation estimates — especially when working on PR guarantees or bankable yield assessments. Would appreciate any guidance or best practices from the community or the PVSyst team.
-
Simulate with as few trees as possible. Take into account things like the total elevation at the top of the trees (tree height + ground elevation) and the distance relative to the panels.
-
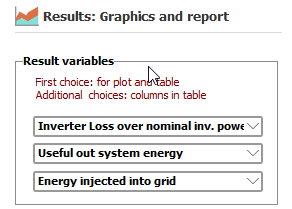
export simulations to excel. output the variables you need and analyze from there.
-
This doesnt look off but not enough info here. The difference between 100m and 50m is .07%. Between 8.5m and 50m, energy plateaus. Since you havent included those simulations, it looks linear there.
-
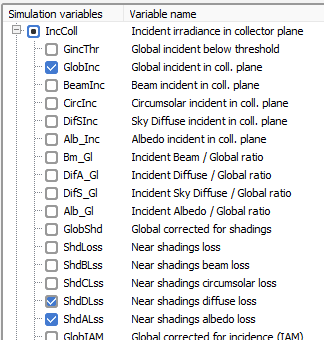
 Hi, I would suggest looking at more variables. I strongly suspect that the dominant loss factor is the losses on the diffuse component. These will have a less sharp decrease than other losses, especially in the case of backtracking, which zeroes-out the direct shading losses. You can take a look at ShdDLss and ShdALss.
-

Shading forest for utility projects
Muhammed Sarikaya replied to CarlosSolis's topic in Shadings and tracking
Dear Carlos, I don’t recommend importing a detailed 3D forest file into PVsyst. The more detailed the 3D scene is, the longer it takes to calculate the shading impact on the PV tables. For the horizon line, you can already import the mountain line in PVsyst using the horizon feature. In the 3D scene, if there is a forest at the edge of your terrain, I suggest drawing a wall to represent the last row of trees. Regards, -
The Voc does not change very much with irradiance. At -10°C, going from 1000W/m2 to 500 W/m2 will change the Voc only around 2%. The irradiance chosen for the worst case scenario is not necessarily the one when the inverters perform a regular self-check in the morning. It could happen that the DC is connected at a time when there is already a significant irradiance, but the ambient temperature is still low. There are two settings in PVsyst that will control the check of the maximum array voltage: In the project settings it is possible to set the temperature at which the check will be performed. If the single diode model parameters in the PAN lead to a temperature coefficient for Voc that is larger than the one specified by the PV module manufacturer, it is possible to introduce this value in the PAN file, and then in the project settings tell PVsyst to use that coefficient instead of the single diode model calculation.