All Activity
- Today
-

Decomposition and transposition models
Luca Antognini replied to dina.christensen.martinsen's topic in Meteo data
Hello James! ==> Beware that you are comparing those model on a single location: Erbs might could be less biased than DIRINDEX at another location. Usually, if those models were fitted on a dataset large enough, they should reach a very low global bias. ==> It always makes sense to improve our models, for hourly timescale as well. We compared so far the ability of Engerer2 and Erbs to reproduce ground measurement of 113 weather stations (IEA-PVPS dataset). We are going to carry this comparison more in depth for several additional model in the future, with in particular DIRINT, that is used for example by Meteonorm, and potentially DIRINDEX as well. These comparisons will serve the purpose of documenting our implementations of the models accross PVsyst version notably. However, those kind of study already exists in the literature, but none of them point to a universal model yet that would outperform greatly all the others. Edit: For the moment, for hourly simulation, the Erbs model is still used. Note well that those models are used only in the case of custom weather import where no DHI data are provided. -

Unusual results in the modeling of bifacial vertical PV
Michele Oliosi replied to sofya's topic in Problems / Bugs
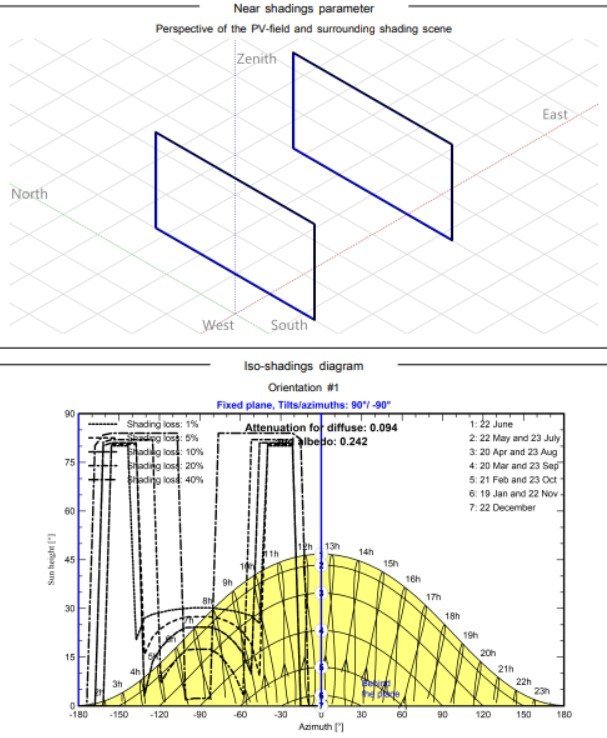
Hi, Thanks for reaching out on the forum. The main difficulty is that front side and backside are modeled differently in PVsyst. Starting with the shadings in the iso-shadings diagram, these shading factors are only applied to the front side. This is why the shading just shows up on negative azimuth side, which must be the front side in your case. The backside shadings are applied differently: they are inherent to a view factor model. The back side is mainly modeled as defined in the System > Bifacial system window. There, you should activate a bifacial model, and make sure albedo coefficients are consistent with the front side ones (found in the project settings). The structure shading factor should be chosen as zero to match what happens on the front side (unless there is some component clutter in the backside, cables, combiner boxes, etc). Moreover, I'd recommend choosing a mismatch loss factor in the Bifacial system window equal to the front side's electrical shading loss. This latter factor will appear in the loss diagram if you choose a fitting model in Near shadings: either the partition model (according to module strings) or the module layout model (detailed electrical calculation). -
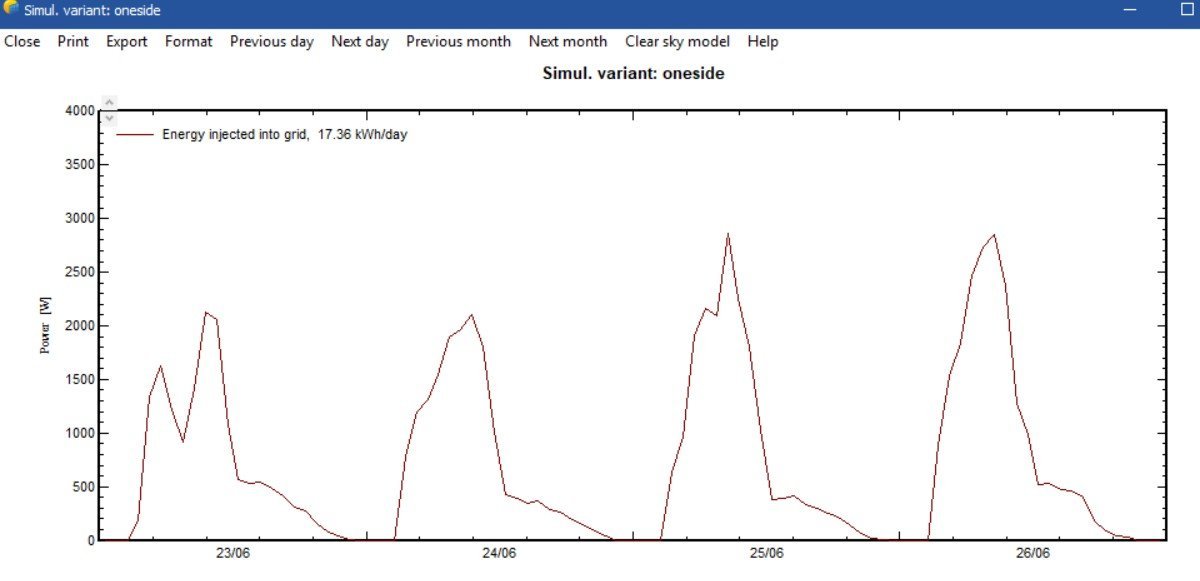
I came across unusual results when modeling a solar power plant. 2 rows of 4 modules at a distance of 4 meters from each other. They are located in the far north. I can't interpret the shading graph. Shouldn't it be symmetrical about noon? The hourly production schedule is also unclear. The gap in the mine should be at noon (when the sun is shining into the end of the panel). But here it is strongly shifted, and the output gradually decreases in the evening.

-
 sofya joined the community
 -

How to generate .SIT files for PVsyst outside PVsyst ?
Hizir Apaydin replied to VUG's topic in How-to
Dear Vo, Yes, you can generate .SIT files outside of PVsyst by using the PVsystCLI tool. One of the features of this command-line tool is the ability to create site files directly from location coordinates and a monthly weather dataset, without requiring any interaction with the PVsyst GUI. You can find more details about this feature in the following documentation: https://www.pvsyst.com/help-cli/use-cases/create-site.html https://www.pvsyst.com/help-cli/reference/index.html#create-site Best regards, -

Contributing Factors to Inverter Loss over nominal inv. power
Robin Vincent replied to Tina Dornbusch's topic in Simulations
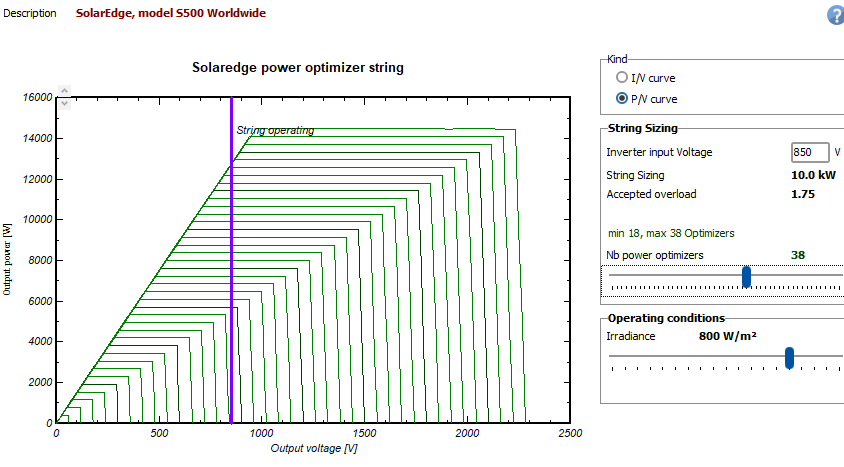
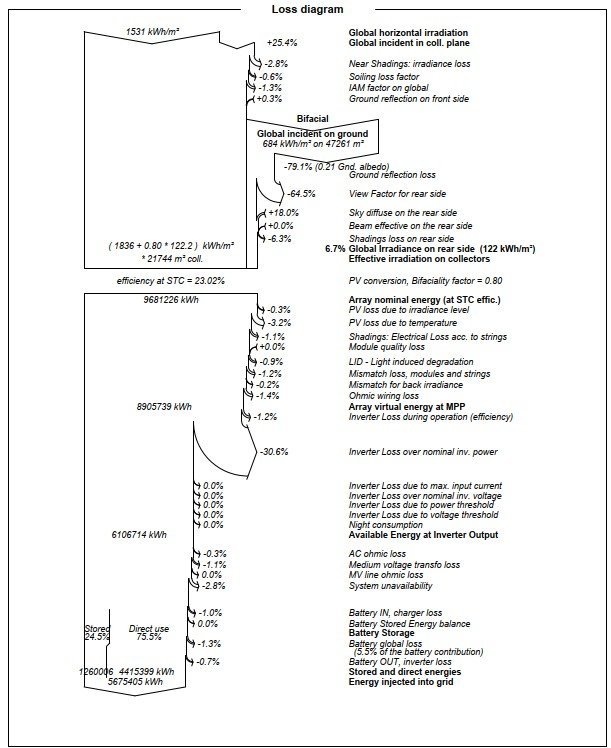
Inverter loss over nominal power usually represents the energy lost due to the inverter max AC power. It can also include the energy lost due to the grid maximum power if the option "Account as separate loss" in the power limitation window is not selected. Having optimizers in your system should have a very limited impact on the inverter clipping losses, as long as they are not limiting the max string power. With SolarEdge, this will mostly depends on the number of optimizers per string. In the example below, the max string power cannot be reached. The string operates at constant voltage (850V), but the max optimizer current is 15A so the max output power is limited to 12.75kW. In this situation, the clipping that used to be necessary at inverter level will occur at optimizer level. You can check this by looking at OP_Imax or OP_Pmax values, respectively, the clipping loss due to the max optimizer current and max optimizer power. NB: There is a known issue in PVsyst 8.0.15 to 8.0.21 that overestimates the current clipping losses. If you are in this situation, please use PVsyst 8.1.0 or later. In the case of the inverter, the percentages are expressed based on EArray, not Egrid. Could that explain the discrepancies you are seeing ?
- Yesterday
-
 Please help me understand what drives "inverter loss over nominal inv. power" in the loss waterfall. I was under the impression that this was essentially just clipping losses from high DC:AC ratio, but this appears to be incorrect based on project modeling to compare SMA Core1 inverters against SolarEdge inverters. For a project in California where I modeled this comparison, I kept all factors the same except the inverter and slight changes in DC:AC ratio due to different inverter sizes. Waterfall losses show: SMA inverters, 1.18 DC:AC ratio: 4.5% inverter loss over nominal inv. power SolarEdge inverters with DC optimizers, 1.19 DC:AC Ratio: 0% inverter loss over nominal inv. power For reference, I ran a similar project in New Jersey which shows: SMA Inverters, 1.42 DC:AC ratio: 2.4% inverter loss over nominal inv. power Solar Edge Inverters, 1.37 DC:AC Ratio: 0.8% inverter loss over nominal inv. power Is there something in the optimizer function that is causing this substantial difference, and the discrepancy between impacts in NJ and CA? I will also note that, in trying to understand the difference, I produced an hourly report of the California project with SMA inverters including all inverter losses, which actually left me more confused. I've provided, for reference, the results of summing the hourly values for different inverter losses and dividing by EGrid, which I assume should give us the appropriate loss percentage (but please tell me if I'm thinking of this wrong): InvLoss: 7.63% IL_Oper: 2.88% IL_Pmin: 0.00% IL_Vmin: 0.00% IL_Vmax: 0.00% IL_Imax: 0.00% IL_Nigh: 0.02% Thank you for any help you can provide!
 -
Hi, I would like to understand is it possible to generate .SIT files to use in PVsyst but generated with an external algorithm ? Is there a standard format example that I can consult for the preparation of the .SIT file ? I would like to do this in order to be able to do a batch simulation on multiple points when I don't have already the file prepared with the classical method in pvsyst. Thank you!! Vo
-
 Irtubes joined the community
 -
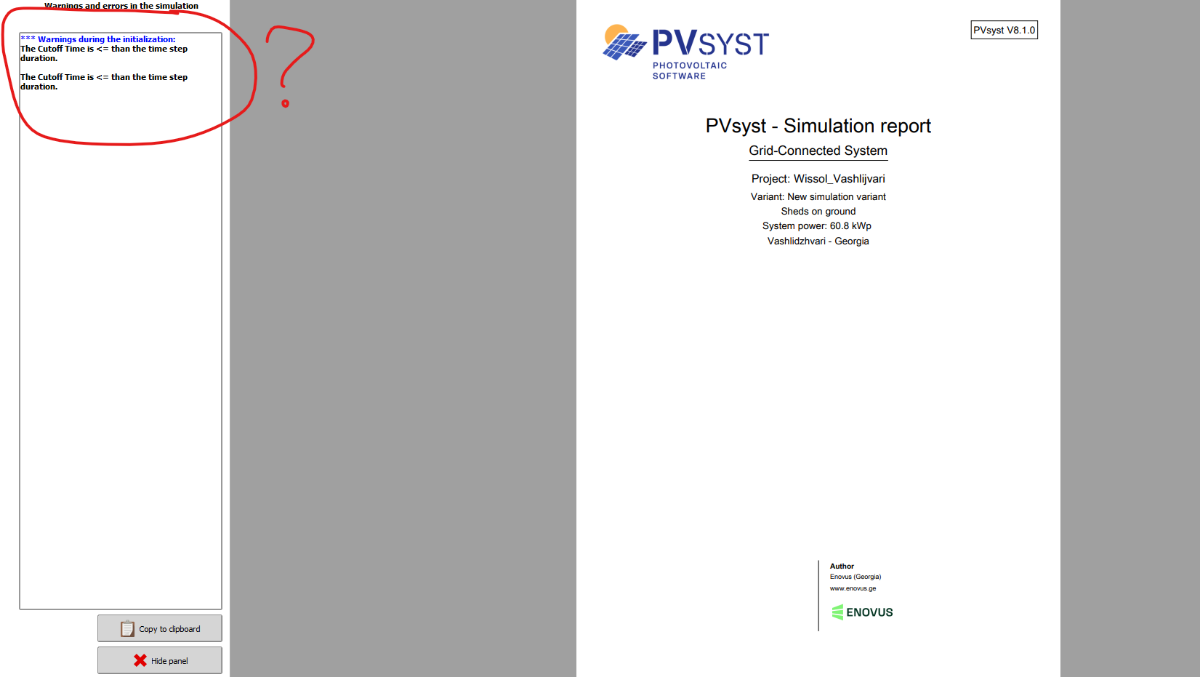
The Cutoff Time is <= than the time step duration.
Luca Antognini replied to Nikoloz's topic in Problems / Bugs
Hello, Sorry for this warning message, it is nothing to worry about. It doesn't impact the simulation and can be ignored. It will be removed in 8.1.01. It is related to the thermalisation time of your subarrays compared to the simulation timestep. But it should not have been classified as a warning, only an information for internal use at PVsyst - because it should be present in the back for conditions that are actually suitable for a good simulation. -
 I would like to suggest allowing the Bifacial Mismatch Factor to be defined individually for each PV module type within a project, rather than as a single global value. This would provide greater accuracy for simulations using multiple bifacial technologies or module architectures in a single variant. Thank you for considering this enhancement to the bifacial modeling workflow.
 -
 dirtbikes4677 joined the community
 -
Hi, We have defined the DC Ohmic losses to be 2.00% of STC for each subarray. However, in the report, it is presented as differing values 1.94-1.96%. We haven't used the detailed calculation tool. The calculated Ohmic values are the same in the Detailed Losses configuration and the report for each subarray, which suggests that the model is calculating the % loss with different STC powers to the report? In case it is relevant, it's a SolarEdge system with multiple orientations spread across multiple inverters. Thanks.
- Last week
-
Large Discrepancy in Total AC Power After Simulation
Robin Vincent replied to Jherche's topic in Simulations
PVsyst will use the value specified as the inverter AC power, in this case 33.3kW. If a difference of 0.1% on the total AC power is a problem, you could copy the inverter, change the max AC power to 33.4kW, and replace 1/3 of your inverters with this new one. As long as the inverter name is unchanged, it will be usable with the same optimizers. -

Large Discrepancy in Total AC Power After Simulation
PranavK replied to Jherche's topic in Simulations
Hello @Robin Vincent, I had a quick question related to a similar scenario. The system I’m working on has a target AC capacity of 900 kW. In PVsyst, I’ve modeled this using 27 units of 33.3 kW (SE100KUS equivalent), which corresponds to 9 inverters. However, PVsyst reflects the total AC capacity as 899 kW (27 × 33.3 = 899.1 kW, rounded). I wanted to clarify the following: Does PVsyst internally use 899 kWAC or 900 kWAC for generation calculations in this case? What would be the best way to model the system so that the AC capacity reflects exactly 900 kWAC instead of 899 kWAC? Appreciate your guidance on this. Thanks! -
Hello , after last update som error accures. What does it mean?
-
Bifacial Modeling for the Carport System
PranavK replied to PranavK's topic in Shadings and tracking
Thanks a lot for your help, this worked. -
 Temus Oral Care joined the community
 -
Hi, I've contacted Huawei, I will let you know of the answer.
-
 surron352 joined the community
 -
 surron352 joined the community
 -
 Adeyhemmy joined the community
 -
 Hello, Indeed it is on our roadmap to quickly implement an option to run the simulation in additional time steps intervals, for instance 15minutes. This will indeed allow for the simulation to run faster. At the moment, a good workaround is to to create a custom file with 15 minute data.
 -
 Hi PVSYST Team, Thank you for the implementation of the sub-hourly simulation feature in PVsyst 8.1. It is something many of us have been waiting for. I am currently trying to generate meteorological data with a 15-minute resolution using different sources in PVsyst, and I have tested the following approaches: Pull with Meteonorm 9: it seems to only allow hourly data or minute-level data. While minute data could technically work, generating datasets at that resolution can become quite heavy and time-consuming for large projects with complex topography. Synthetic data generation: https://www.pvsyst.com/help/meteo-database/synthetic-data-generation/execute-generation.html From what I can see, this option also only allows hourly or 1-minute frequency. At the moment, the only way I have found to work with 15-minute data is by using the “Import a custom file” option. With the new import tool it is possible to specify a 15-minute timestep, which works well if the dataset already exists externally. My question is the following: Is there any option within PVsyst meteo databases (e.g., Meteonorm or tool synthetic generation) to directly generate sub-hourly data with a specific timestep such as 10, 15, or 30 minutes, instead of only hourly or 1-minute resolution? Or is importing a custom dataset currently the only workflow for these intermediate time resolutions? Thanks in advance for any guidance.
 -
Hi Robin, Thank you for your quick awnswer, do you maybe have an contact by Huawei for these kind of issues? I would think that if PVSyst contacts them the issue will be resolved a lot quicker. I expect it to take a long time for the information to end up at the right place if I would just contact the general Huawei support. Kind regards,
-
Interpreting Shading Loss in 8760s for PV Capacity Testing
Linda Thoren replied to Jherche's topic in Shadings and tracking
Yes FShdBm = beam shading factor. FShdBm < 1 indicates that beam (direct) irradiance is being reduced by shading. 1.0 = no beam shading 0.95 = 5% beam shading loss 0.00 = fully shaded from beam irradiance ShdBlss = beam shading loss value. ShdBlss > 0 indicates a non-zero beam shading loss, so this also means shading is occurring. 0 = no shading loss -

Decomposition and transposition models
James Barry replied to dina.christensen.martinsen's topic in Meteo data
Hi @Michele Oliosi, I am happy to see that you have implemented some changes in the new version! Could you clarify - is the modified coefficient Perez model and the Engerer2 model only used for 1-minute and/or sub-hourly data? Would it not make sense to also enable the new models for hourly data, and to add DIRINT as well. In your announcement, you say that "[the Erbs model is] based on a single clearness indicator, [and] is considered to have sufficient accuracy for hourly simulation. However, at shorter timescales, it fails to capture fast phenomena such as cloud enhancement and results in a systematic discrepancy compared to real measurements." This is only part of the problem with the Erbs model. It also can perform poorly under very clear skies, i.e. steady atmospheric conditions without fast phenomena, by simply overestimating the atmospheric turbidity. In this case it would make sense to add the DIRINT or DIRINDEX models, even for hourly data. -
 Neutron Sunray joined the community
 -
 Pedro Arana joined the community
 -

Interpreting Shading Loss in 8760s for PV Capacity Testing
Jherche replied to Jherche's topic in Shadings and tracking
@Linda Thoren Just so I'm clear, can you elaborate on the significance of both terms? What do the values for FShdBm and ShdBlss mean? For capacity testing should the values of ShdBlss be zero? What happens when you get values > 1? is that just a simulation error? it makes sense to me that 1 would correlate to 100% shading. FShdBm = 1 means no shading? -
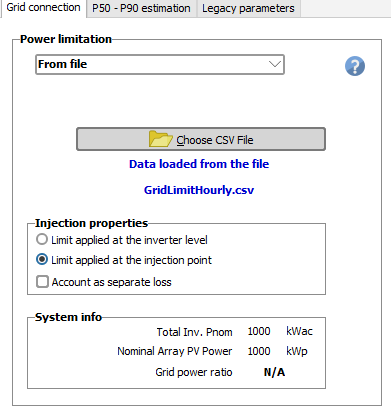
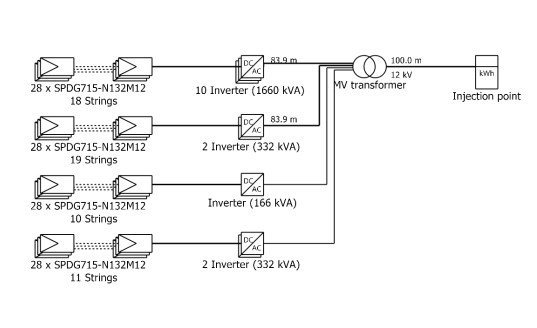
Dear Nikhil Lokhande Thanks for your feedback! As you correctly analyzed, the battery is currently shared across the whole system, between the final MV transformer and the injection point. You could find some very far-fetched workaround (splitting your system into two variants and upscaling your inverters so as to not clip and use a variable grid limitation to reintroduce the clipping after the battery), but I'm not sure about the reliability of the results you may obtain that way. We have planned for more options in terms of battery connection, but it won't be before the next major version at the very least. Secondary Reporting Observations: SLD Visualization: The single loss diagram is currently under heavy rework and should be available in the next major version. System Overview: The chargers (Dynapower DPS-500) are omitted from the primary System Overview tab, which focuses only on the grid-feeding inverters. As mentioned, the battery can only be set on the AC side for the moment, so it is not possible to simulate a system with DC-DC converters. Questions for the Community/Developers: Is there a workaround to "un-assign" a specific sub-array from the DC-coupled storage bus within the same variant? : Not for the moment (DC coupling is not possible either) If we must run two separate projects and combine the hourly data in Excel to respect the 2.49 MW POI limit, how can we best account for the shared "Grid Power Limitation" within PVsyst’s energy management logic? When applying the grid limitation to individual inverters during the simulation, PVsyst is dispatching the total value based on the estimated AC power of each inverter. You could reproduce a similar strategy if you split your system into two variants. run the two variants without grid limitation Compute the relative production of each system Compute the grid limit for each system at each time step based on the total grid limit and the relative production Use the possibility introduced with PVsyst 8.1 to import a time series for the grid limitation Run the simulation again with the grid limitation activated. You can also create alternative strategies to reflect your system behavior if needed (e.g : prioritize one side of the system for example).
-
Hello PVsyst Team and Forum Community, I am currently modeling a 5.00 MWdc / 2.49 MWac utility-scale project in PVsyst 8.1.0 that utilizes a split-architecture. I am seeking guidance on how to accurately isolate storage to a specific sub-array or if this is a planned feature for future updates. System Architecture: Our design uses two distinct paths tied to a single 2.49 MW AC Point of Interconnection (POI): Path 1 (DC-Coupled): 4.364 MWp PV array connected via 4x Dynapower DPS-500 DC-DC converters to a 10 MWh BESS. This path uses 4x Solectria PVS-500 (1.992 MW AC total) bi-directional inverters. The ILR on this path is high (2.18) specifically to maximize clipping recapture. Path 2 (PV-Only): 0.641 MWp PV array connected to 3x Solectria XGI 1500-166 inverters (0.498 MW AC total). This path has no battery and should feed the grid directly. The Issue: In the current version (8.1.0), the Storage menu for DC-coupled systems appears to follow a "Global DC Bus" logic. I am unable to find a way to assign the battery and the DC-DC chargers exclusively to the DC bus of Sub-array 1 while treating Sub-array 2 as a standard PV-to-grid path. As a result, the simulation assumes the battery can "see" the excess energy from the entire 5 MWdc array, which does not reflect the physical wiring of the site. Secondary Reporting Observations: SLD Visualization: Even in 8.1.0, the Single Line Diagram tool does not render symbols for the battery or the DC-DC converters (chargers), making it difficult to present the architecture to stakeholders within the report. System Overview: The chargers (Dynapower DPS-500) are omitted from the primary System Overview tab, which focuses only on the grid-feeding inverters. Questions for the Community/Developers: Is there a workaround to "un-assign" a specific sub-array from the DC-coupled storage bus within the same variant? If we must run two separate projects and combine the hourly data in Excel to respect the 2.49 MW POI limit, how can we best account for the shared "Grid Power Limitation" within PVsyst’s energy management logic? Any insights on how to handle this "Hybrid" Path 1/Path 2 architecture would be greatly appreciated.
-
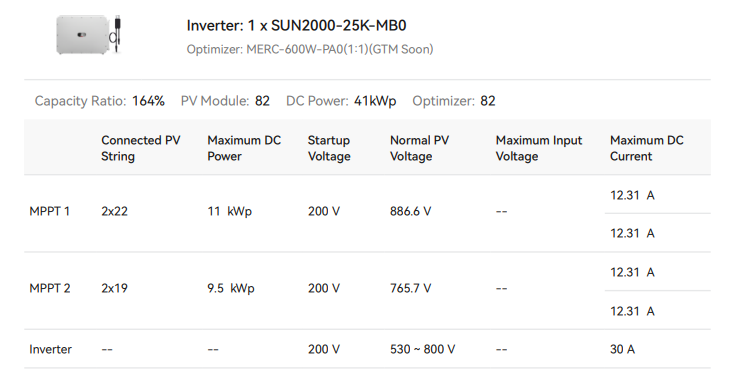
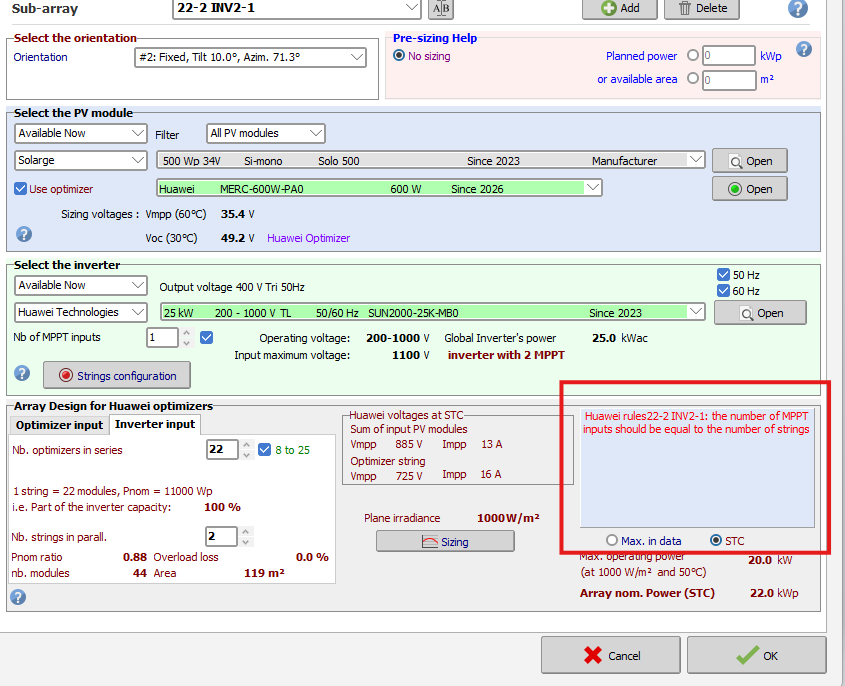
Inverter/optimizer combination rules are directly sent by Huawei to PVsyst. Huawei's latest update indicates that this specific inverter can only connect to a total of two strings. As it seems different from what the data sheet in your screenshot suggests, I'd recommend that you contact Huawei to report the issue, and ask them to update their PVsyst database.
-
Good morning, I think there is a bug in the Huawei rules for the new optimizers in the latest update. In PVSyst I'm not able to connect 2 strings of MERC-600W-PA0 optimizers on 1 MPPT while this is possible in the Huawei Smart design 2.0, so it should be possible. Please see the included image from Huawei Smart Design, and the fault from PVSyst. Kind Regards,