All Activity
- Past hour
-
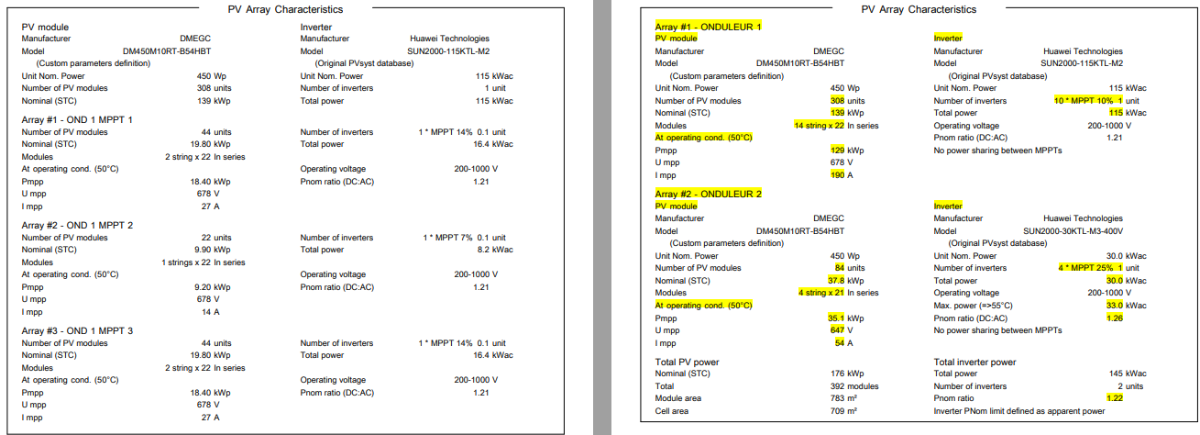
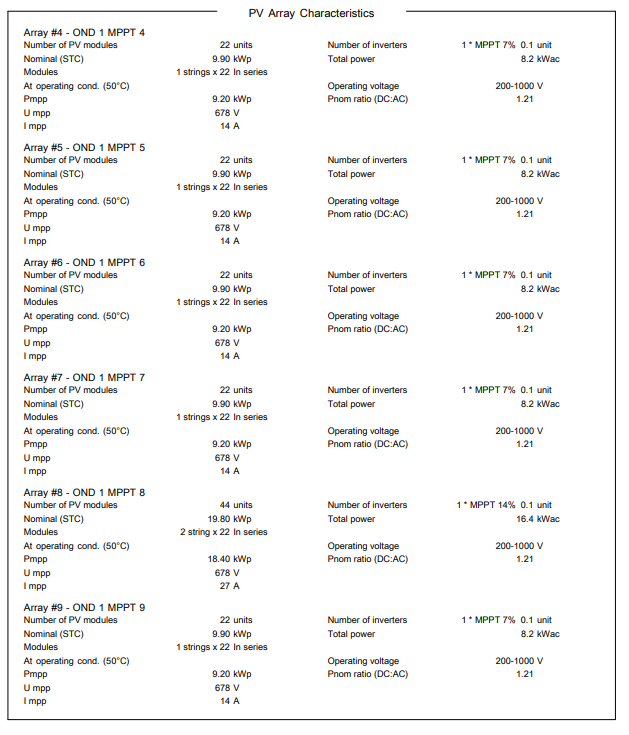
Hello, When using the independent MPPT inputs feature, it is very important to have a multiple between the number of strings and MPPTs in each sub-array, or PVsyst can not equally distribute the strings over the MPPTs and you risk incorrect evaluation of the inverter losses over nominal inverter power. The MPPT and Power sharing feature is fully described in the following youtube tutorial:
-
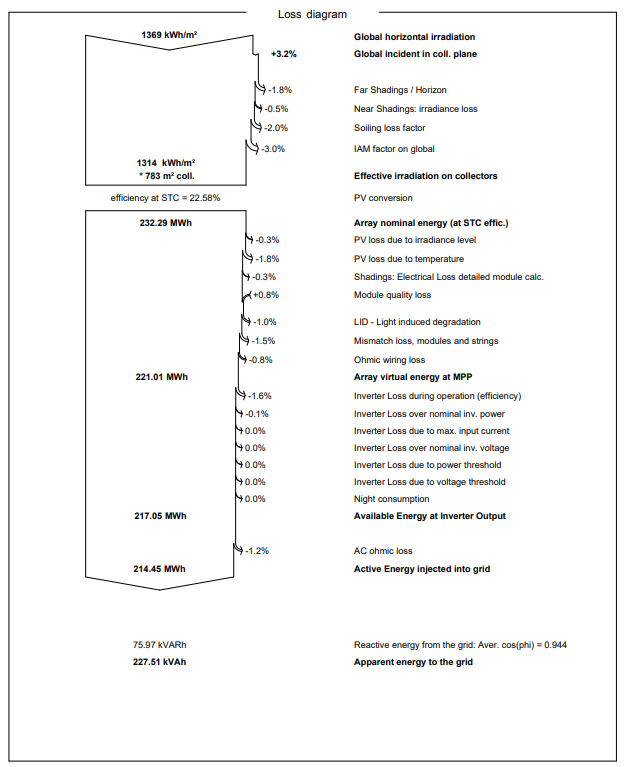
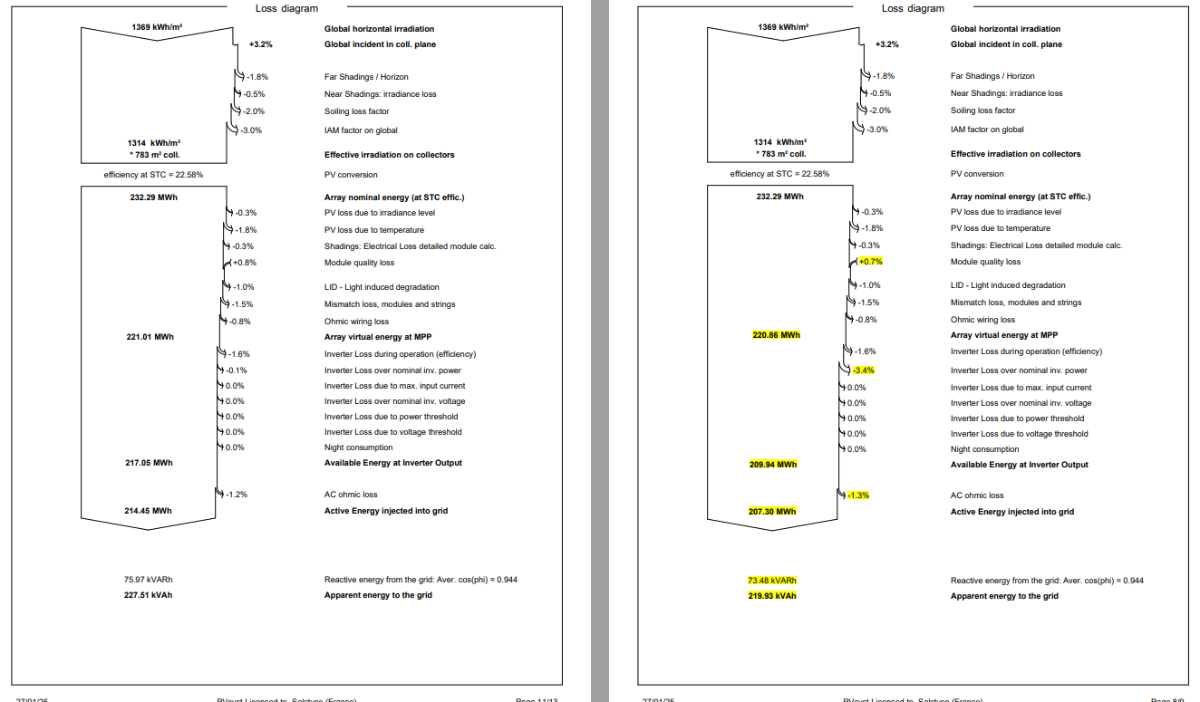
Hello, I noticed something in the software regarding inverter loss over nominal inv. power : The creation of a subfield for each MPPT in the system or t he grouping of multiple MPPTs into the same subfield leads to significant simulation differences (see the example below with an additional 3% in losses). How PVSYST manages the repartition of strings when we don't create a subfield for each MPPT ? Is there a trick to avoid creating a subfield for each MPPT (to save time) without generating these losses? Thanks you for your help

- Today
-
 A client has requested that we conduct an assessment of string inverters versus central inverters on PVsyst by analysing the inverter losses on an annual basis for a 25-year lifecycle. In addition to the typical losses displayed in the simulation report, they would like to see the annual clipping losses as well as the nett yield as a result of these losses by means of a 1 - 25 year generation table (I have read that this is done via PVsyst's Batch Mode capability, but needed guidance on the approach). Please may you assist by providing assistance on how to approach this client request on the PVsyst platform for both scenarios. Many thanks!
 -
 luca bartoli joined the community
 -
 Bieng joined the community
 - Yesterday
-
In the case that different PV modules (and unique .PAN files) are defined in Subarray 1 and Subarray 2, how does PVsyst consider the different temperature coefficients and low light performance of each module in the simulation? I can see one aggregated number in the results, but I am wondering how the calculation is performed and if the unique module / .PAN characteristics are both considered. Does the answer change if the mixed modules share an inverter?
-
 Elise joined the community
 -
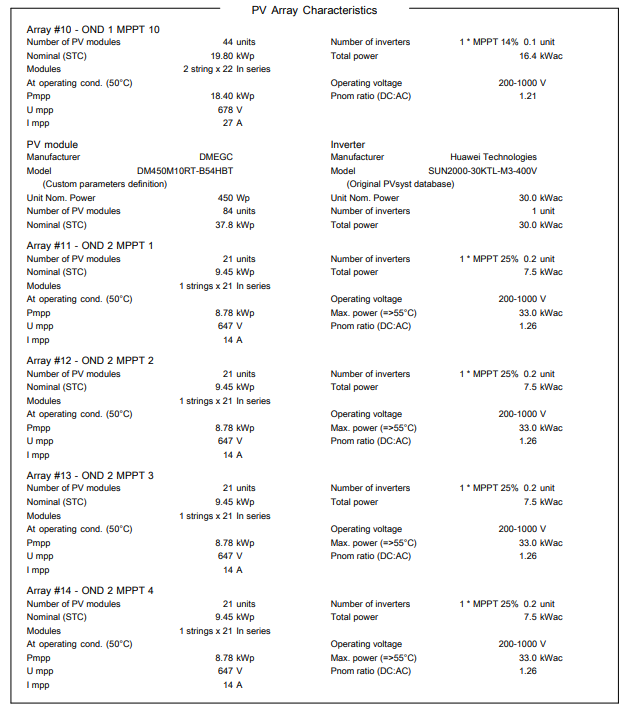
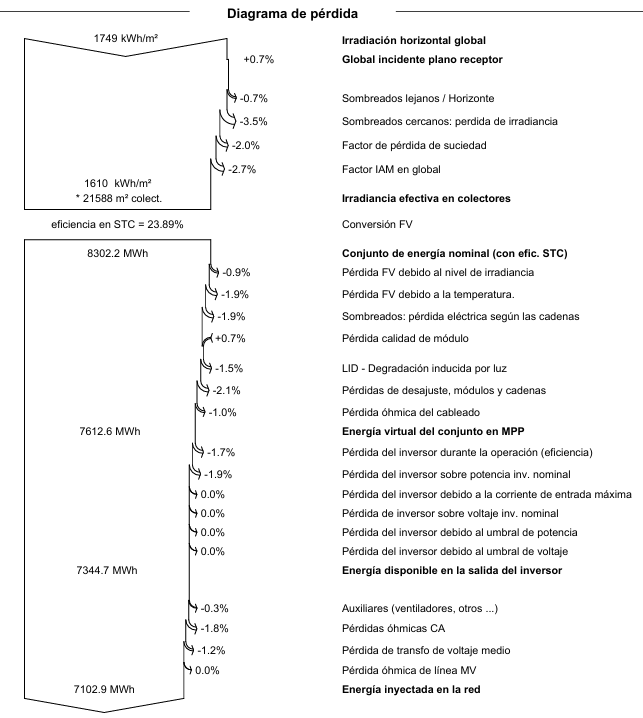
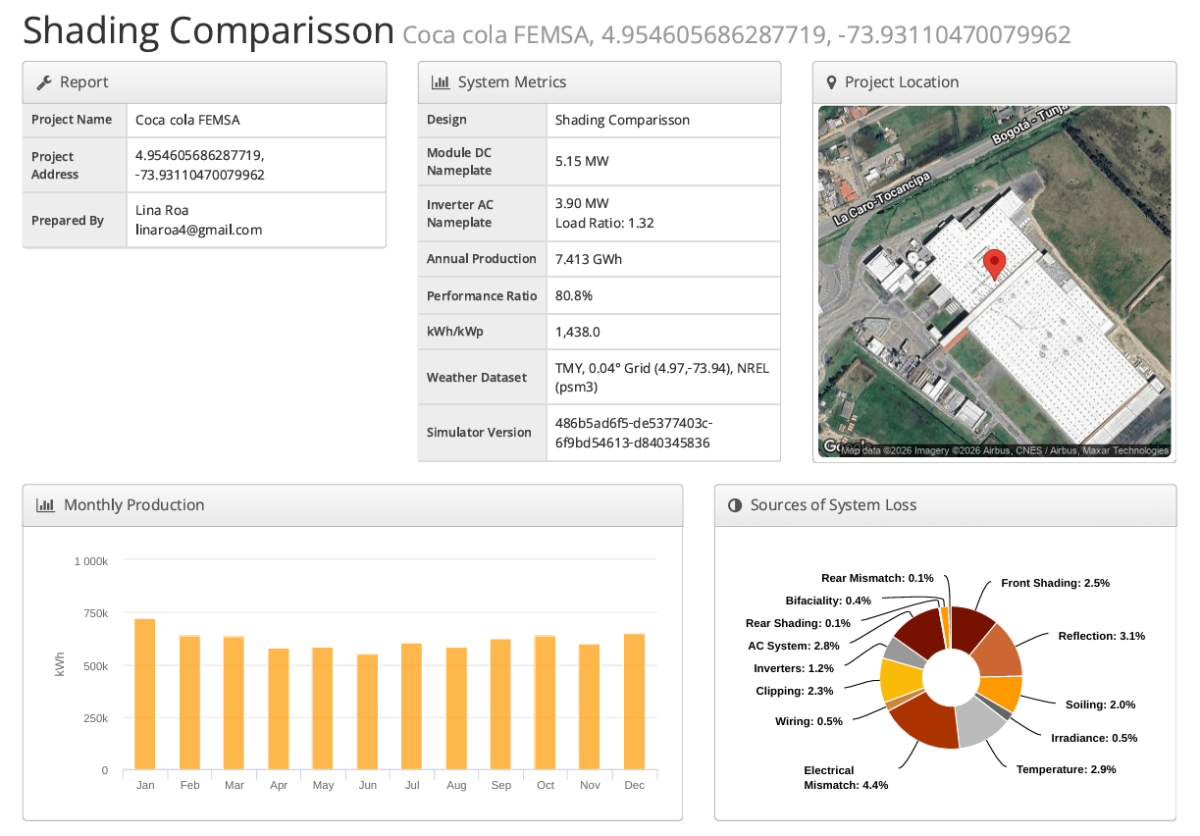
 Hi all, We are currently performing a technical comparison between PVsyst and HelioScope for a C&I rooftop project (FEMSA Coca-Cola case), and we observed that shading losses reported in HelioScope appear lower than those obtained in PVsyst. In PVsyst, we are considering: Near shading irradiance losses (~3.5%) Additional electrical mismatch losses due to shading (~1.9%) This leads to a relevant question from a modeling standpoint: In HelioScope, are shading losses reported as: Pure irradiance (geometrical) losses only?FEMSA_ Coca-cola_ Tocancipá_Project.VC1-Report.pdfFEMSA_ Coca-cola_ Tocancipá_Project.VC1-Report.pdfFEMSA_ Coca-cola_ Tocancipá_Project.VC1-Report.pdf Or do they already include the electrical mismatch effects caused by partial shading? From a methodological perspective, we are trying to understand whether including: Irradiance shading losses, and Additional electrical mismatch losses could potentially lead to double counting in PVSyst, depending on how each software handles the shading model internally. PVSyst results: Helioscope results: We would appreciate clarification from anyone who has experience reconciling results between the two platforms. Best regards, Angel Duarte
-
Angel David Duarte Moreno joined the community
-
You are correct, DTArrGl is weighted using GlobEff but it is computed as follows: DTArrGl = (T_Array - T_Amb) / GlobEff Note that it is only calculated for GlobEff > 7W/m2 and set to 0 otherwise as it becomes insignificant for very low irradiances.
-
Hello, I have a question about the DTArrGl parameter. On the help page it says it is DTArr weighted by the "effective" global irradiation which I have assumed to be GlobEff. I'm having trouble understanding how this is calculated though. To my understanding, being weighted by something means that GlobEff should be multiplied by DTArr but this doesn't appear to be the case. Any support would be helpful
-
 JillStirling joined the community
 - Last week
-
 MM_Oxford joined the community
 -

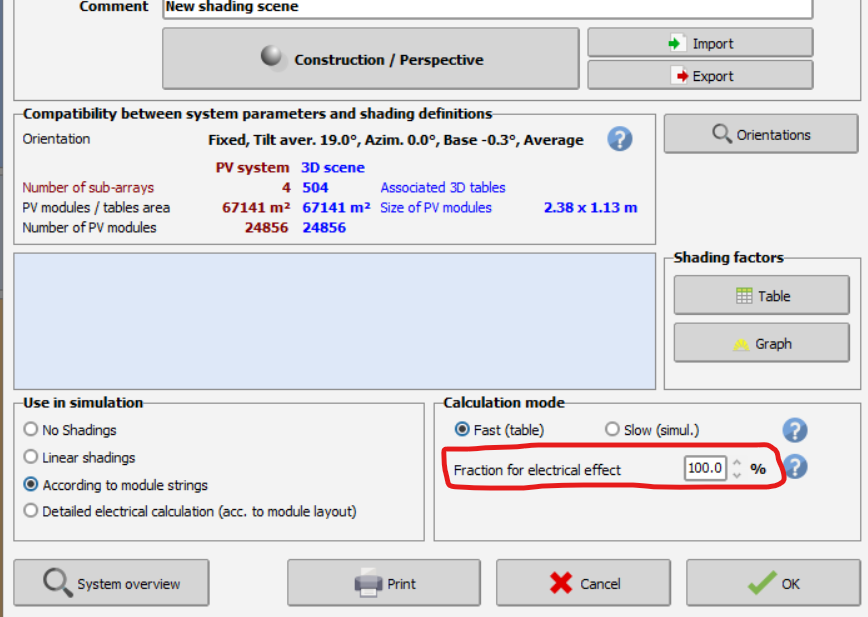
Fraction for electrical effect percentage
Linda Thoren replied to AdelB's topic in Shadings and tracking
Hello, This depends on your system layout. If the majority of the shadings are regular mutual shadings, you can leave the fraction for electrical effect to 100%. If you have several shading objects in the scene causing irregular shadings, you might need to adapt this value. This is furthered discussed in our help: https://www.pvsyst.com/help/project-design/shadings/electrical-shadings-module-strings/index.html#module-layout-reference Kind regards -
Hello, can you please tell what is the "standard / recommended" percentage for the electrical effect when using a slow simulation ? i'm using a 3D scene, two strings in portrait with a halfcut modules.
-
The last generated Monte Carlo values is for year 30. You can still simulate a degradation beyond this, though after 30 it is assumed to be a linear trend.
-
In the coming PVsyst version 8.1, several input parameters can be defined as hourly values via a .csv file. This will allow snow coverage (in %) to be specified on an hourly basis if desired. However, we are not currently implementing more advanced snow-coverage models, though this is on our roadmap for a future version.
-
Hello, If you for instance have self-consumption or storage, System production production is not necessarily the same as E_grid. What version of PVsyst are you using? There may be differences due to rounding of results when saving files. However, these differences are necessarily negligible. If they are not, there may indeed be a problem and feel free to export your project as a zip file and send us an email to support@pvsyst.com
-
Good morning, Are you planning to account for snow losses? In 2017, you considered using an hourly snow coverage ratio set by the user. The key issue was evaluating electrical mismatch when only part of the system has snow cover. Some providers supply snow loss and soiling data; do you have ideas for integrating these into PVSyst? The second ones are easy, the first ones no. Thank you very much!
-
Thanks for your response. Just to confirm, is the 30-year period in PVSyst 8?
-
 surronelectricbike8 joined the community
 -
Bumping this. Any plans to incorporate this in future versions? Modern design software spit out shd or pvc files quite easily (both should be able to be imported). I think the only hangup with this is the partition definition for each shade scene, but if this were added to 3D shadings parameter, the user could define the geometric area of a partition that gets applied to each scene. Diffuse shading can be set to central tracker for quick analysis by default, backtracking activation is already an option for batch sims.
-
 Vinay Gurram joined the community
 -
 Mister Alex joined the community
 -
Hi, The Monte Carlo values are currently generated for up to 30 years. For simulations extending beyond 30 years, a linear trend based on the last two data points is applied. Thank you for your feedback. I’ve noted the interest in generating Monte Carlo values over a longer horizon and potentially this can be developed for a future version.
-
 Juan Tamad joined the community
 -
Hi, I'm curious how / where the spectral correction model (e.g. when using First Solar) is applied. It's reported as a power correction in the output file; when I compare that power correction to Earray (or EarrMPP), the relative difference is close to - but not exactly the same - as the spectral correction factor calculated with the Gueymard & Panchula/Lee models. Is the correction applied to one of the irradiance quantities, and if so - which one? Thanks! -Johan
-
Regarding the aging: Is there a specific reason why the Monte Carlo values are only calculated up to year 25? Most projects now have lifespans extending beyond that. Would it be possible to increase the number of steps, perhaps up to year 40? Thank you.
-
Hello, does someone know if it makes sense to decrease the "fraction for electrical effect" percentage (i.e. from 100% to XX%) to take into account the supposed better behavior of BC modules (Longi, Aiko, ...) in terms of electrical mismatch induced by 3D scene shading (for a utility-scale PV plant)? A manufacturer proposes to set the fraction to 70% according to its investigation and some laboratory tests by TUV, but I'm not sure they can completely trusted. Did anyone encounter the same issue/doubt? Does PVsyst team have any suggestion on how to handle this in PVsyst (if possible) and if make sense to set to 70%? Hope to have any feedback. Kind regards Michele
- Earlier
-
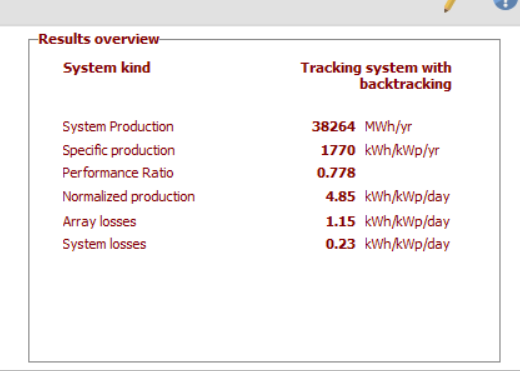
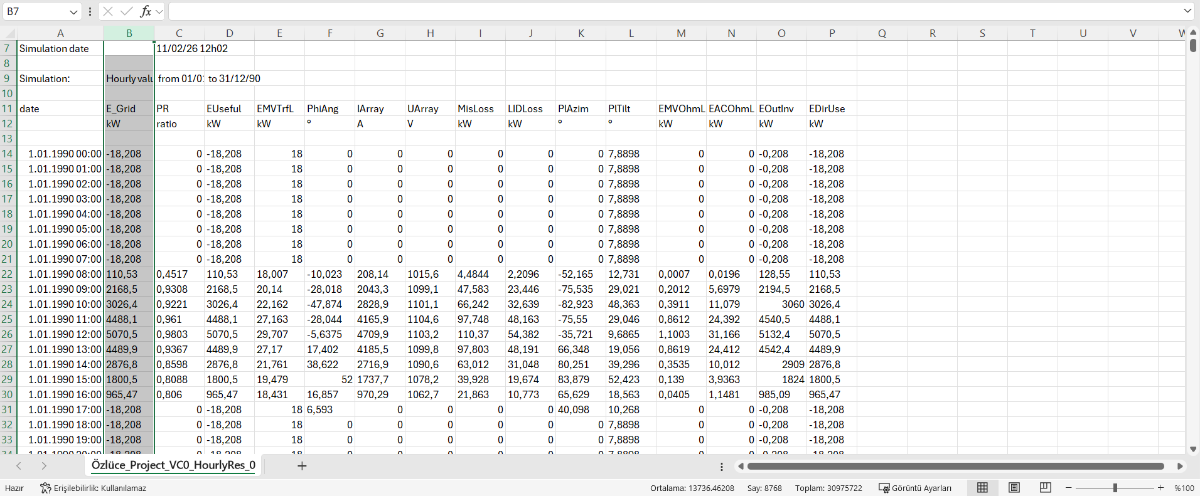
I Ran simulation my system production is 38264 Mwh but hourl output file total is 30975 MWh how can ı fix that issue
-
My revised hypothesis (to be confirmed/determined) is that this is just a rounding issue; namely, that PVsyst limits the number of decimal places of E_Grid in the CSV, so the summed value over the 8760 E_Grid column of the CSV file does not always round to the same integer value as the annual E_Grid value shown on the Loss Tree or in the PVsyst "Balances and main results" table.
-
 When using the optimization tool with a 3D scene, PVsyst will change the nominal tilt of each individual table in the 3D scene without changing the base slopes. If there are nominal tilt differences these will be lost. If there are base slope differences, these are kept, which may result in an effective average tilt different than the value you chose in the optimization tool.
 -
Hi ! Currently that is difficult to do for each table. For zones, a workaround can be found. The idea is to use the "partial shadings caclulation group" concept (https://www.pvsyst.com/help/project-design/shadings/partial-shadings-and-calculations.html). You can put a zone in the group. Then run the simulation, and the shading loss factor will be computed on that group + any additional shading objects (not the other tables though unfortunately). For zones the approximation should be good. This can be done through the interface, and as long as there are not too many groups should be feasible by hand. I have been experimenting with a script and PVsystCLI to try to define the groups by modifying the variant file and running the simulation programmatically. While this is possible, it is rather convoluted. The caveat of the other tables not casting shadows remains though. I need to experiment a bit more to get a result table by table.
-
Right, this setting is not very realistic anyway, it creates very long trackers if I recall correctly.
-
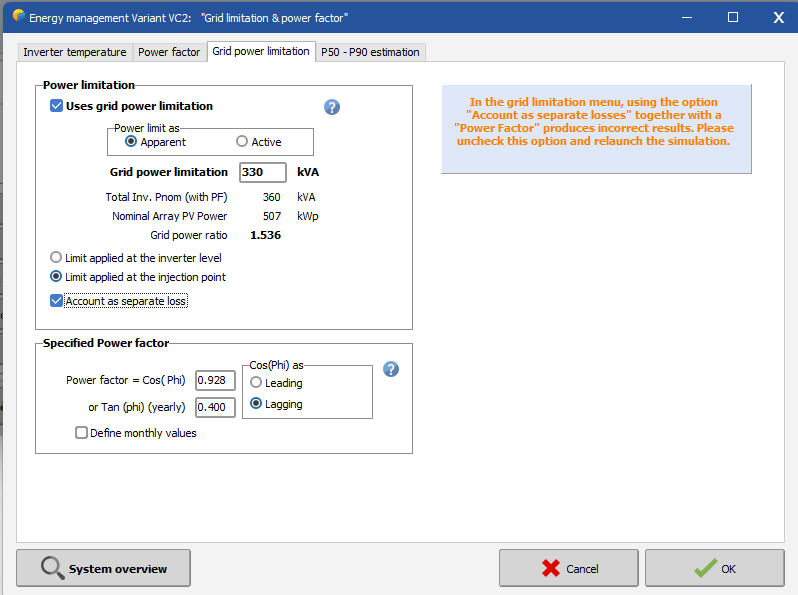
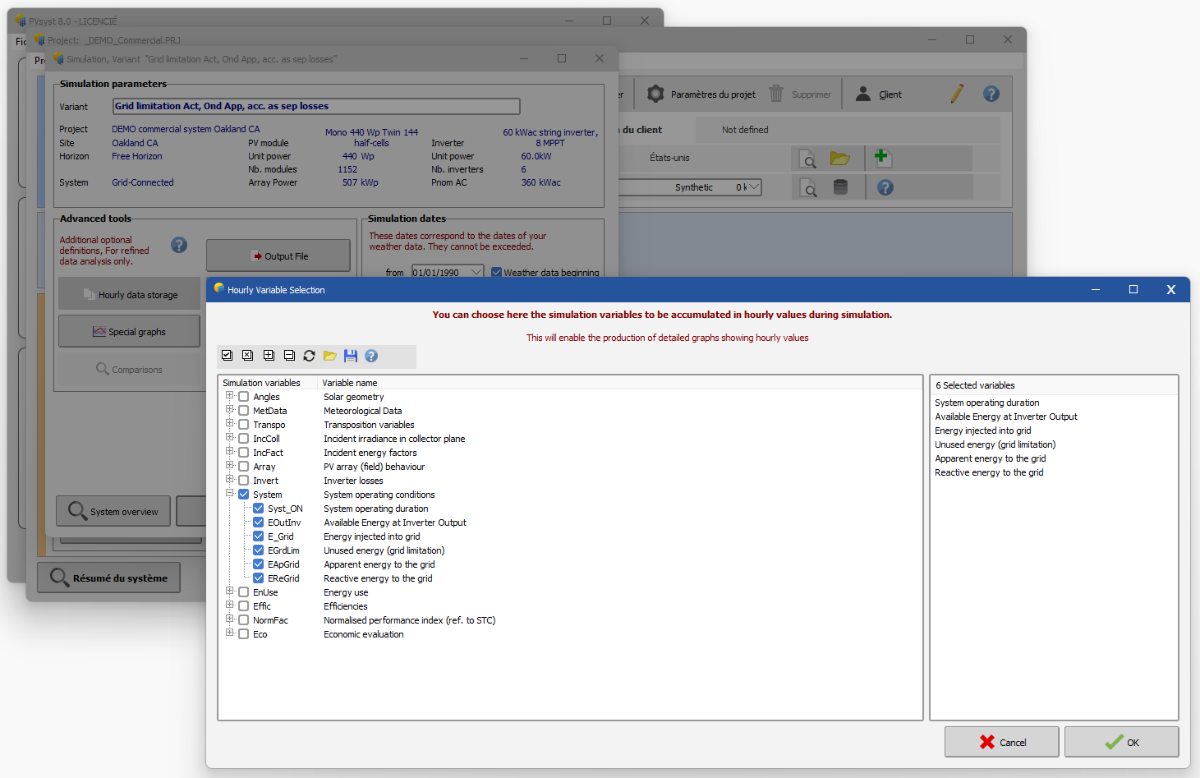
 Grid Power Limitation: The option "Account as separate loss" in the menu grid power limitation may pose a problem when used together with a power factor. However the loss diagram and .csv simulation output are not affected. Hourly Graphs may be affected upon context: When the simulation variables EReGrid, EApGrid and EGrdLim are not explicitly saved, it can trigger wrong calculations of the reactive and apparent energy in the hourly plots (too high values for both). Saving those variables in the menu "Advanced simulation / Hourly data storage" solves the issue: Until the option is fixed in a future version, the software will display a warning when both options are used together.