kjs55
Members-
Posts
156 -
Joined
-
Last visited
Everything posted by kjs55
-
PVsyst v6: Inconsistent Date Format in Hourly Output .CSV File
kjs55 replied to kjs55's topic in Problems / Bugs
None of the methods proposed thus far in this thread work for me over the entire PVsyst date column. You can see the problem if you open the PVsyst output CSV file in Excel and add a new column with the formula =DAY(PVsyst_date) and drag it down. The root problem is that the PVsyst output date column contains mixed data types/formats (both serial numbers and text strings). Here is what I finally found to work for the default PVsyst output date format "DD/MM/YY; Hour; (Excel)": year =IF(ISNUMBER(PVsyst_date+0),YEAR(INT(PVsyst_date+0)),1900+VALUE(MID(TRIM(PVsyst_date),7,2))) month =IF(ISNUMBER(PVsyst_date+0),DAY(INT(PVsyst_date+0)),VALUE(MID(TRIM(PVsyst_date),4,2))) day =IF(ISNUMBER(PVsyst_date+0),MONTH(INT(PVsyst_date+0)),VALUE(LEFT(TRIM(PVsyst_date),2))) hour =IF(ISNUMBER(PVsyst_date+0),QUOTIENT(ROUND(MOD(PVsyst_date+0,1)*1440,0),60),VALUE(MID(TRIM(PVsyst_date),10,2))) minute =IF(ISNUMBER(PVsyst_date+0),MOD(ROUND(MOD(PVsyst_date+0,1)*1440,0),60),VALUE(RIGHT(TRIM(PVsyst_date),2))) second =IF(ISNUMBER(PVsyst_date+0),MOD(ROUND(MOD(PVsyst_date+0,1)*86400,0),60),0) xlsdatenum =DATE(year,month,day) + TIME(hour,minute,second) -
I'm getting a 404 Error for URL: <https://www.pvsyst.com/old-versions/> (i.e., the link for downloading past versions of PVsyst) Thanks.
-
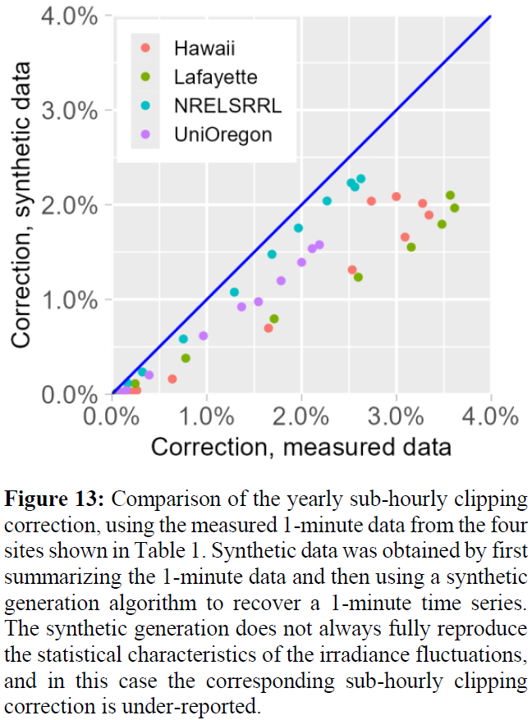
@Linda Thoren Scientific literature (e.g., Clean Power Research CPR, UL, Townsend, PVsyst, several others) indicates that synthetic 1-min. satellite data exhibit only ~60% of natural radiation's variability as compared to ground-based data, thus defeating the purpose of performing subhourly corrections. For example, below I include an excerpt from a PVsyst publication on this point [1]. Furthermore, it remains unclear how to then accurately use subhourly correction results derived from a 1-min. dataset, obtained via PVsyst V8, together with the ultimate hourly, typical meteorological year TMY dataset employed ubiquitously in the simulation used for project finance. Thank you. 4.3 Synthetic data The correction model relies on sub-hourly data, ideally 1-minute data, or at least a sampling frequency that matches the variations in power of the DC array. Arguably the most reliable source for high frequency data are ground measurements. However, in practice, it can be difficult to obtain this data, especially during preliminary design phases for the PV system. One possibility is to rely on a synthetic generation procedure. This type of approach allows to generate sub-hourly fluctuations from a lower sampling frequency input. For example, one can use typical statistics for sub-hourly data to complement satellite data, which is found generally in 15-minute time steps. The result of this procedure is a high frequency time series that matches the original measurements up to a certain time scale (e.g. 15 minutes for satellite data). We refer the reader to [8], e.g., for a more thorough discussion on this subject. Since the clipping correction can utilize any sub-hourly time series, as a proof of concept, we use here the hourly averages for the data obtained from Table 1 and utilize such a synthetic procedure to generate a 1-minute time series. The results are summarized in Figure 13, compared against those from Figure 11, where the original time series was used. From these preliminary results we can extrapolate that the synthetic generation methodologies may induce further biases. Indeed, in the example we have studied, the clipping correction extracted from the synthetic data is lower for all four sites and for all DC:AC ratios. <see attached image> Figure 13: Comparison of the yearly sub-hourly clipping correction, using the measured 1-minute data from the four sites shown in Table 1. Synthetic data was obtained by first summarizing the 1-minute data and then using a synthetic generation algorithm to recover a 1-minute time series. The synthetic generation does not always fully reproduce the statistical characteristics of the irradiance fluctuations, and in this case the corresponding sub-hourly clipping correction is under-reported. [1] M. Oliosi, B. Wittmer, A. Mermoud, A. Bridel-Bertomeu, and R. Vincent, “Implementation of a Sub-Hourly Clipping Correction in PVsyst.” WIP-Munich, 2024. doi: 10.4229/EUPVSEC2024/4DV.4.7.
-
Bumping this again.
-
I have the same question as LauraH.
-
PVsyst V8.0.12: Hello, the "Operating losses at STC" sections of the PVsyst V8 output PDF report have disappeared (!). See below screenshots as example (V8 screenshot is missing the section; V7 screenshot contains the section on the right-hand side). (NB: Please note the value for Iron Loss Fraction in one of the screenshots is incorrect, as there was a typo in the input. This rapid example was for screenshot purposes only.)
-
There are common instances when we would apply different "soiling" assumptions (which includes dust, snow, etc.) for different PV module types (e.g., monofacial, bifacial). We would like the ability to apply a different set of monthly soiling values for each subarray in PVsyst V8. This would resemble the subarray dropdown menu for the MQA factor in Detailed Losses. Is it on the development roadmap? Thanks.
-
Hi, I'd like to specifically request a 10-min. editing time as an incremental (and meaningful) improvement. Thank you!
-
PVsyst V8 Problem Statement: How to apply spectral adjustments to certain subarrays (containing certain PV module cell types) and *not* to others? Ideas (example only): 1.) This could be handled in the PV module PAN file, through a checkbox which (if checked) will apply spectral adjustments IF the tab in Detailed Losses is applied 2.) This could be handled as a dropdown menu for each subarray on the spectral adjustment tab in Detailed Losses, similar to the MQA factor subarray dropdown menu, where you can toggle on/off spectral adjustments for each subarray 3.) (Least favorite option): If the spectral adjustment tab of Detailed Losses is applied, it could automatically apply spectral adjustments onto the specific technologies involved in each subarray according to PV cell technology type. This is the least favorite option, because not all PV cell technologies should use spectral adjustments (e.g., single-junction Si-based technologies). Conversely (and preferably), Options 1 and 2 above would allow the user to *only* apply spectral adjustments onto the (sub)set of PV cell technologies in the applicable subarrays which require spectral adjustments. Thank you!
-
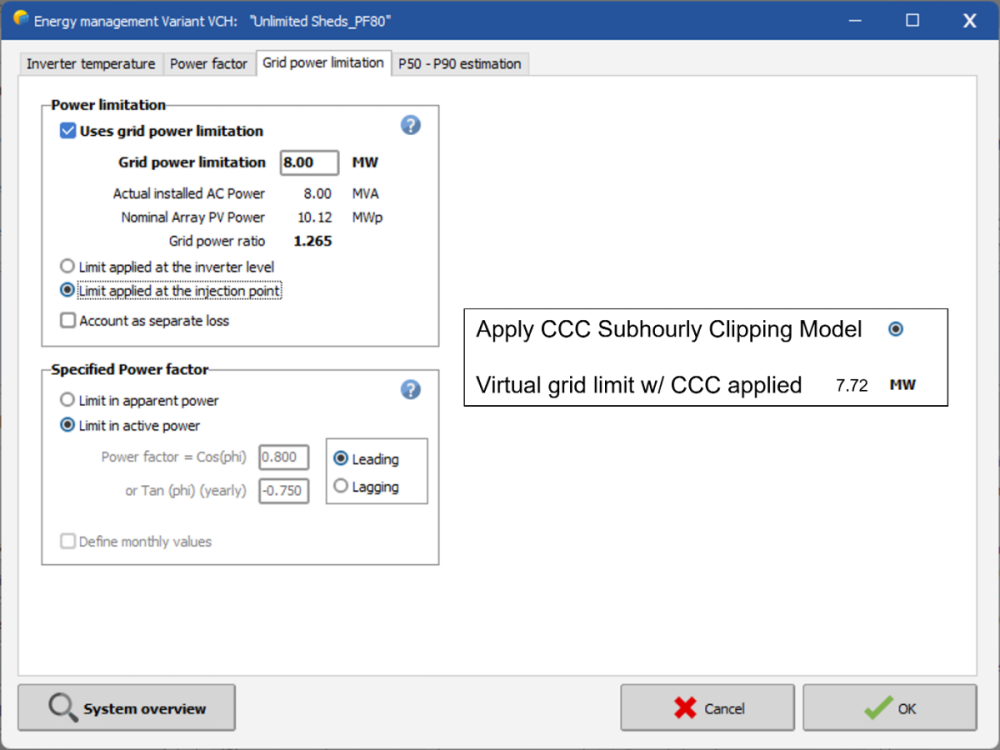
Here's one way CCC could be incorporated into PVsyst, to enable more accurate modeling with standard hourly TMY datasets:
-
Let's imagine you have a 100 MWdc PV system with: - Split Si PV module design using half-cut PV cells in Orientation #1 with split partitioning, and - CdTe PV module design in Orientation #2 with no split partitioning How do you assign: - "according to module strings" with 100% "fraction for electrical effect" for Orientation #1, and - "linear shadings" for Orientation #2 ? Please advise. Thanks.
-
Suggestion to add a third option for the ac losses power reference value, namely, a custom user-defined input value field. The reason for this is that sometimes ac losses are not defined at either of the two (2) presently available toggle options in PVsyst, namely, "PNomPV(ac) at STC" or "PNom (inverters)", but rather at some other ac losses power reference value (e.g., driven by the grid limit). Thanks.
-
Apologies if this is documented somewhere and I missed it (if so, please feel free to point me to the already existing answer). Are "secondary parameters" used in PVsyst's numerical simulations? Or, are these just informative settings? The only help documentation I can find says: "Secondary parameters": sometimes useful parameter. I'm not sure how to interpret this. Please advise. Thanks.
-
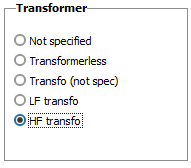
Apologies if this is documented somewhere and I missed it (if so, please feel free to point me to the already existing answer). Would you please explain how the internal transformer settings in the PVsyst .OND file are applied? Or, are these just "informative" settings? Thanks.
-
P.S. Please note the 5xxxx3 MWh value also shows up in the Report on the Loss Tree, in the "Balances and main results" table, etc.
-
PVsyst v7: Sum over E_Grid 8760 is 5xxxx2.3 MWh, which rounds to 5xxxx2 MWh. NB: 8760 has night losses. PVsyst Loss Tree (copied to Clipboard and pasted into Excel) yields 5xxxx3 MWh (no decimal places provided). If you remove one row from the 8760 summation, you get 5xxxx2.5 MWh, which rounds to 5xxxx3 MWh. So this tells me the PVsyst Loss Tree is missing a single row from its summation (namely, it's summing 8759 rows, not all 8760 rows). Please confirm it. (NB: Exact values masked for confidentiality reasons.)
-
PVsyst v7 & v8: In the PVsyst Report (output PDF file), please note the ambient temperature of all inverter power ratings. For example, please include: Unit Nom. Power (~>50 oC) = 765 kWac where the "at 50 oC" is added. Similar to: Max. power (~> 25 degC) = 840 kWac Please see attached screenshot. Thank you!
-
-
Sorry, I don't have time to do a detailed bug report. If you cannot reproduce this, please add a comment and I'll add more details. v7 & v8: Activate Power Factor on PF tab of Energy Management. Then go to next tab Grid Limit and activate w/ Apparent Power basis. You'll see the units of Grid Limit change from MW to MVA. Now return to PF tab and deactivate it. Now return to Grid Limit tab. Units of Grid Limit remain as MVA instead of changing back to MW.
-
Grid Power Limitation - Truncation of Input Value
kjs55 replied to JMBalGrp's topic in Problems / Bugs
I also noticed that the value entered into Grid Limit doesn't round, it truncates. Why? And the allowable significant figures is inconsistent. You can either enter 0.17 kW with max. two (2) sig figs or 999.17 kW with max. five (5) sig figs. Why? The relative (%) impact of the truncation will of course depend on the value entered. It seems like an easy enough fix to allow a fixed number of sig figs, e.g., several (more is better, e.g., so that we can exactly match utility contracts which can be defined as irrational numbers). It also appears that the units go from kW to MW depending on the project's power capacity, so ideally the increased number of allowable sig figs could also be consistent regardless of the units. Thanks.


-Copy.png.a79629189f1d8e9b6c531b86a32afb1b.png)
