julmou
-
Posts
106 -
Joined
-
Last visited
Everything posted by julmou
-
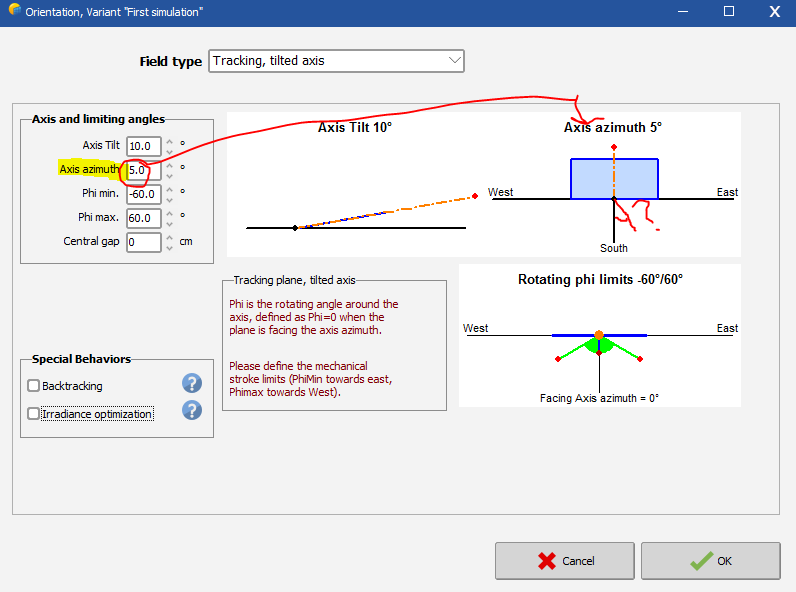
Good morning, Correct me if I'm wrong, but if I give an azimuth (e.g. 5 degrees) to my one-axis N-S horizontal tracker, shouldn't the sketch adjust, in the Orientation section, so that we see the angle between the module and the South? Just like with the "Fixed Tilted Plane". Instead, we just see the size of the module changing, which, in my mind should be what's happening when we give a tilt to the axis (seen from the sky, the module area appears smaller). But again, if we just give an azimuth to our N-S axis/system, shouldn't the module (and the tracker axis) have this azimuth angle, relative to the South, reflected on the sketch/diagram in the right top corner?

-
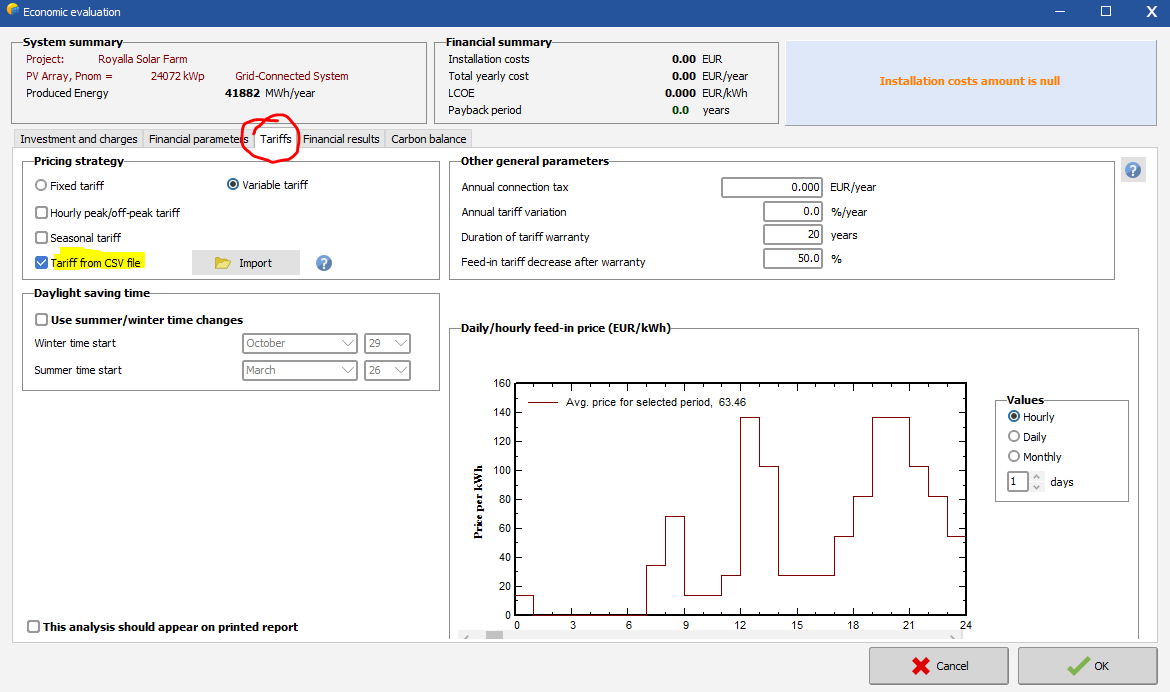
Good morning, I acknowledge all the current options in PVsyst to set up a Tariff in the Economic Evaluation: fixed (there's even an option of an annual tariff variation), variable (hourly and seasonal), and I even played with the Tariff from CSV file (basically giving it an yearly tariff profile, hour by hour), seen screenshot below. However, in all these cases, we assume that the Tariff sticks to only one of these plans. However, we make most of our projects (here in Australia) on a different basis. We would have a combination of fixed tariff and variable tariff. We usually have one main (or several) base PPAs where we sell a defined qty at a fixed price to one or more client(s). The production target for the PPAs are made easily atteignable on purpose. And whatever the surplus of production is sold on the market, at the market price. So we could imagine, as PVsyst Tariffs option, a combined pricing strategy, where we would have a fixed tariff (similar to already existing options) up to the point where the yearly production target at this tariff is met, and then whatever the excess of production would be given a different tariff (like an estimated average market price for the year -> fixed, or a tariff profile -> variable). I do not believe that we are the only ones having this kind of tariff strategy. This could be beneficial to a lot of people. I am not an expert though and perhaps what I just explained can already be done? Please let me know.
-
Hi, sorry to bring it up again, but I posted on the 21st April and didn't get an answer yet on this topic. Thanks so much in advance for helping me! ?
-
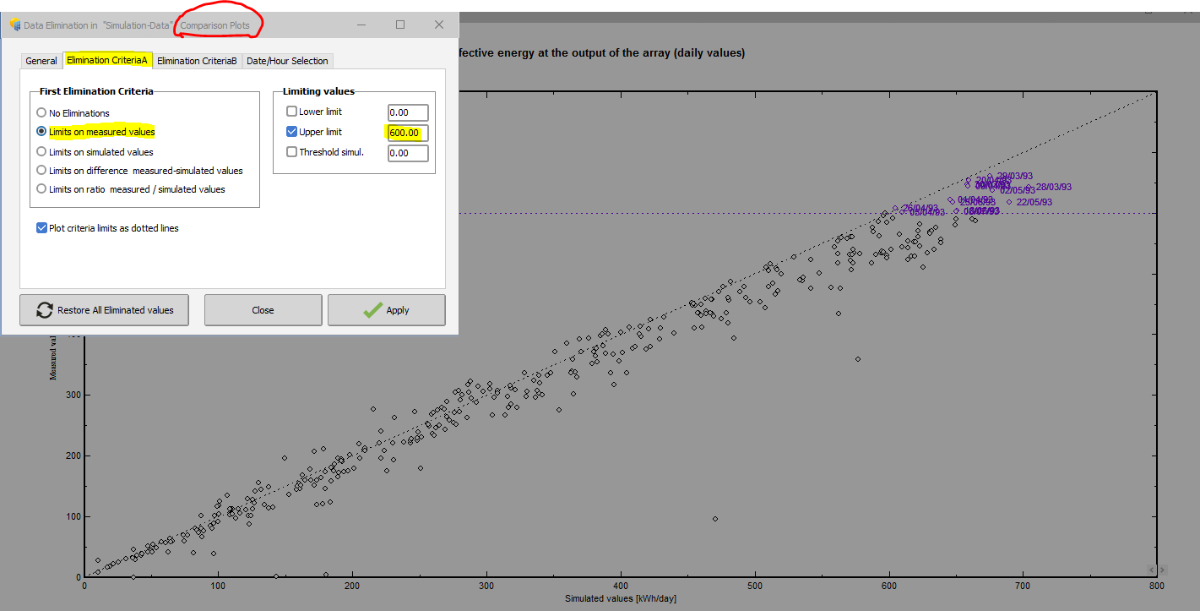
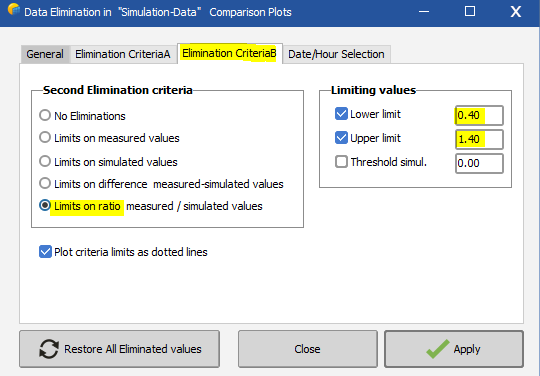
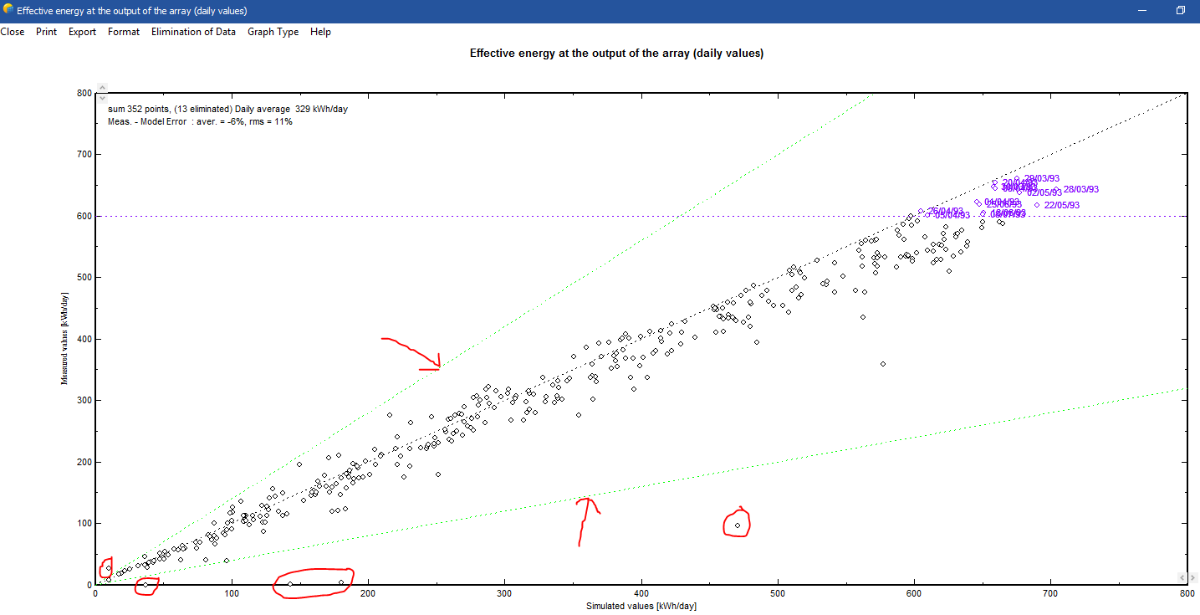
Hello again, So, I have been playing with the Comparisons tool for a bit, using the DEMO_N13_Motorway_Data.PRJ After checking out the different comparison graphs, I tried out the "Elimination of Data" tool by giving some criteria limits. It works great (at first). You can see in the first snapshot below, the limit that I set up is plotted as a dotted line and the dots/values above this line are marked as eliminated. It works just as well with the next few criteria. But the last one "Limits on ratio measured / simulated values" gives me some issues. Let's take an example: I give as Elimination criteria B a lower limit of 0.4 and an upper limit of 1.4 on the ratio (see 2nd snapshot) and apply. You can see the dotted lines appear (light green) to mark the limits, but I don't get any eliminated points/values, even though they're outside the limits, see the 3rd snapshot. I'm not sure if this is a display failure or if they don't get eliminated at all. Please advise.
-
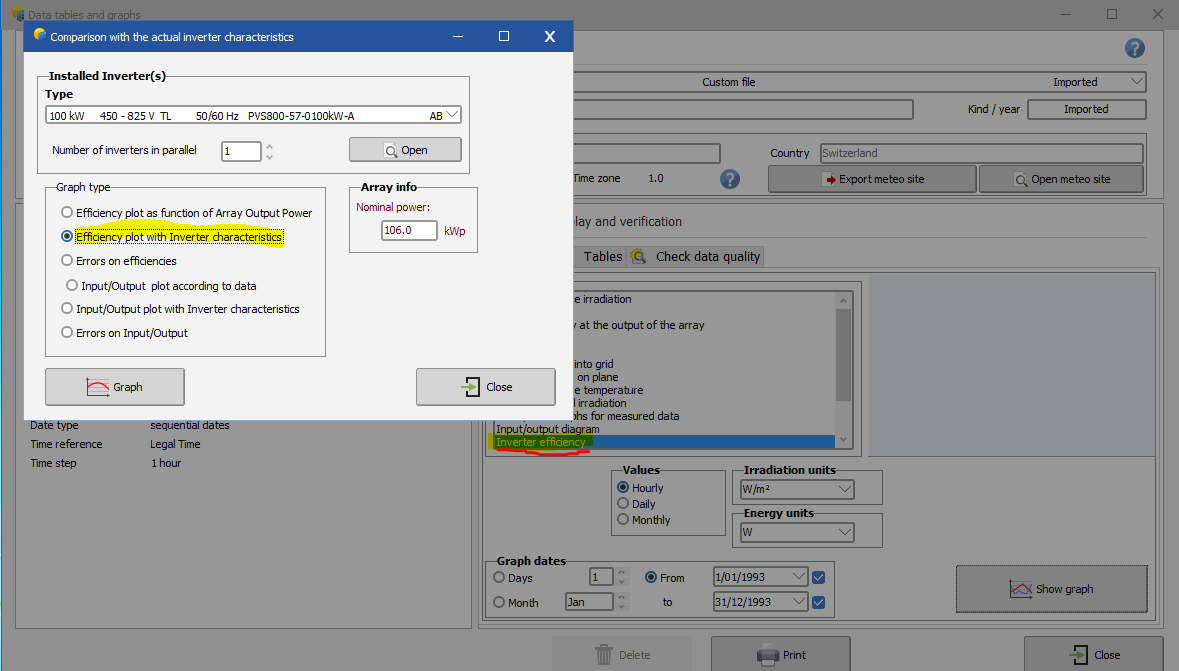
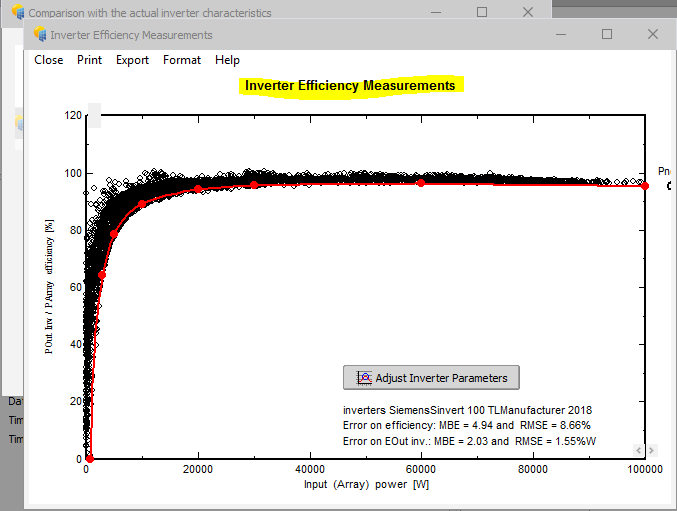
Hello, I have been playing a bit with the Measured Data section (directly accessible from the main welcome page). In there is the "Data tables and graphs" tool, to visualize our imported measured data. In there, after I select an imported custom file (e.g. "N13GlobH.DAM" file, avail. as demo), I can go to the "Graphs" and select the "Inverter efficiency" graph, which then opens a whole new tool. I assume this is the "Inverter modelisation analyser" referred to in this page of the Help: Measured data > Checking the measured data files Once there, I select a "Graph type": Efficiency plot with Inverter characteristics" which is great to see how my system is matching with the theoretical inverter efficiency curve. Now, the only issue is that, from there, I'm stuck. Once the graph is displayed, the program is stuck and I cannot close the window anymore... Also, once I adjusted my inverter parameters to match the plot/data, how do I save the new/edited inverter from there? See the snapshots below. Thanks for your help in advance.
-
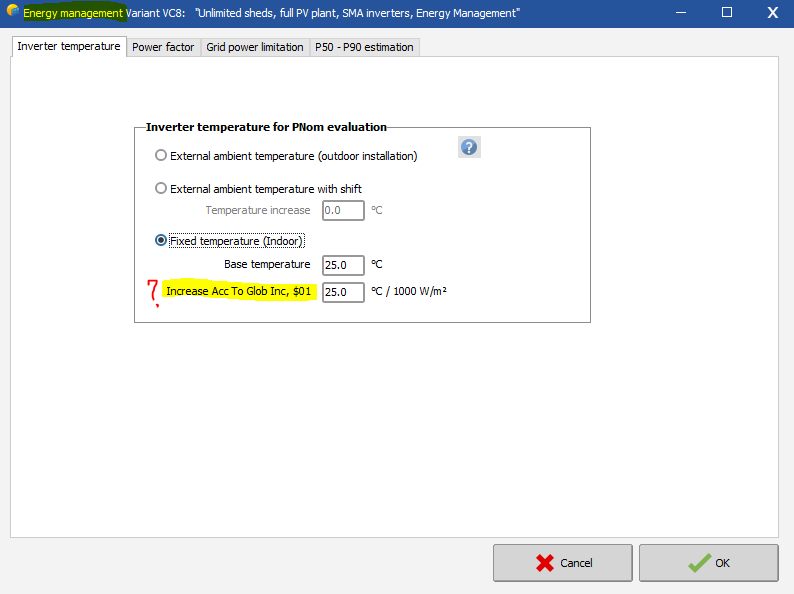
Thank you so much Michele, this is clear for me now. Just one last question to be sure to understand how it works, regarding the "Increase Acc to Glob Inc, $01" parameter (Temperature increase according to incident global irradiation) It seems the standard value by default from the software is 25°C. So just to make sure, if I leave the "Base temperature" value at 25°C (i.e. it is 25°C in the room) and the increase also at 25°C, does this mean if I have 1000 W/m2 irradiance outside, the room temperature will be at 50°C? I mean, is it 25°C base temperature when I have zero irradiance and it only goes up from there? (that could make sense, that would mean 25°C when the inverter is not working basically, and then it goes only up from there with every added irradiance). Thank you in advance for enlightening me. What if the inverter room is cooled and the temperature always stays at a constant value, do I just put the increase at 0 and the "Base temp." as the controlled temp?
-
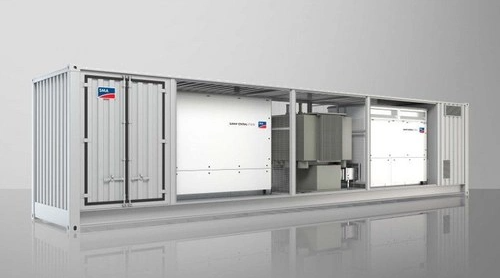
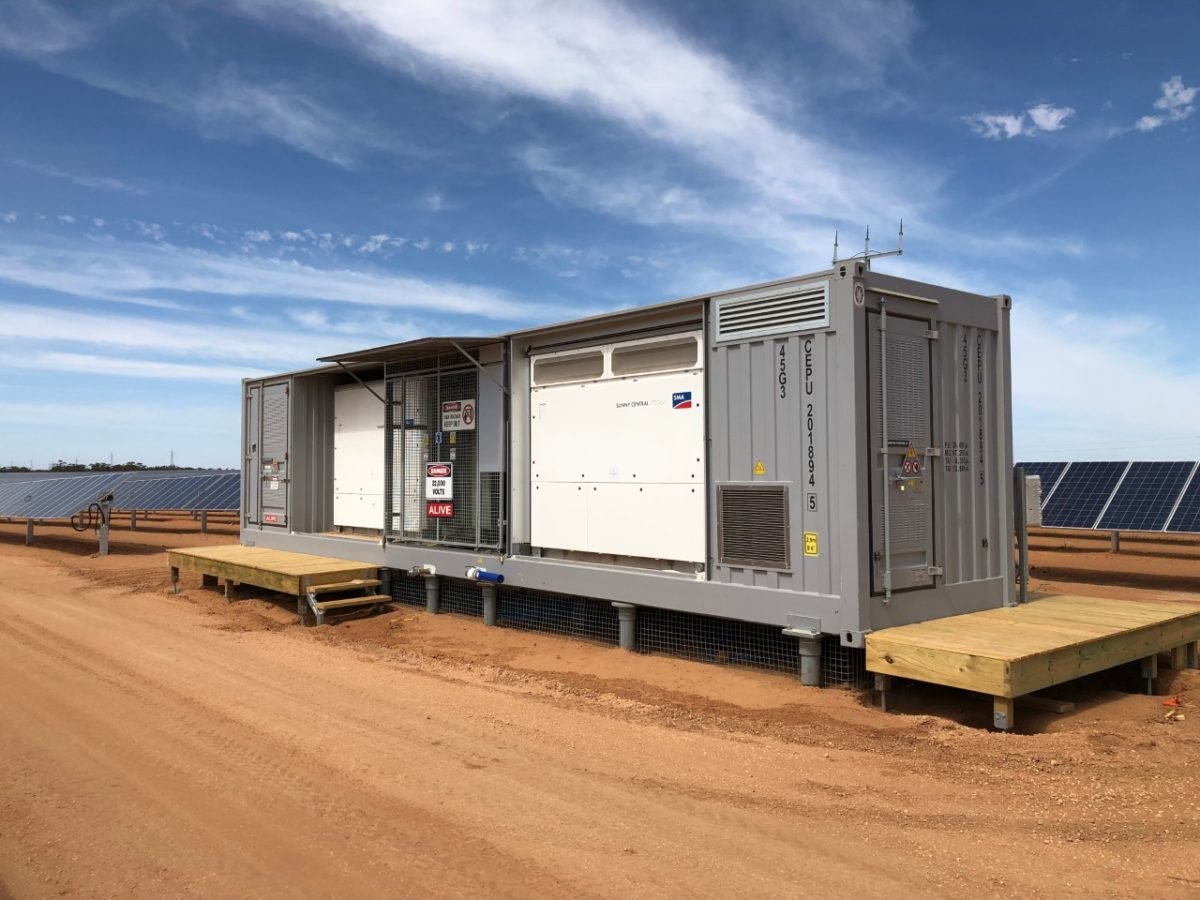
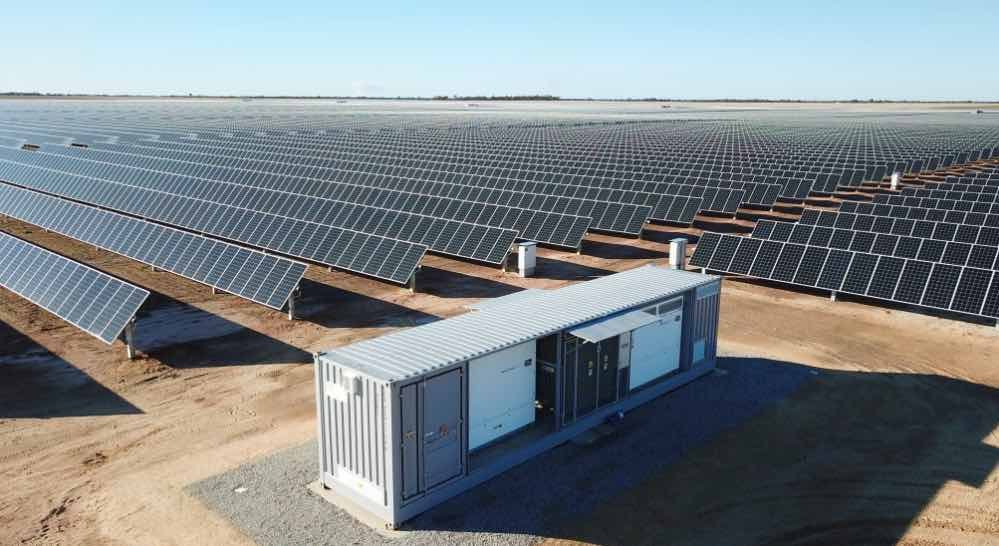
Good morning, I have two questions about the "Inverter temperature" section, when we go to Energy Management. When is an inverter considered indoor? What about the containerised solutions such as provided by SMA? See photos below. Indoor? Outdoor? Also I don't understand the last parameter "Increase Acc to Glob Inc, $011" .... seems a bit obscure to me and I didn't find any info in the Helpfile. Thanks for your help in advance.
-
Good morning, I think there is an issue in the Glossary between the definitions of "Profile Angle" and "Transverse Incidence Angle". The last sentence in the definition of Profile Angle says "We can also name this angle as the "Transverse incidence angle". " But really, they're two different things, aren't they? The profile angle is between the horizontal plane and the profile plane, whereas the transverse incidence angle is between the normal to the collector plane and the profile plane, isn't it?
-
Good morning, I find really useful the "Compare with another project/variant" tool in the report options. It's good to be able to quickly spot the differences of two different systems in a report format. See screenshot below. The engineer might indeed do all sorts of variants or batch simulations but when it is time to report it, it's good that the differences can be presented in such a way. However, I didn't find any option to save, print or export the comparison in the format it is displayed (e.g. as A3 landscape). Is this possible? I think it would be pretty useful. Thanks in advance, Julien
-
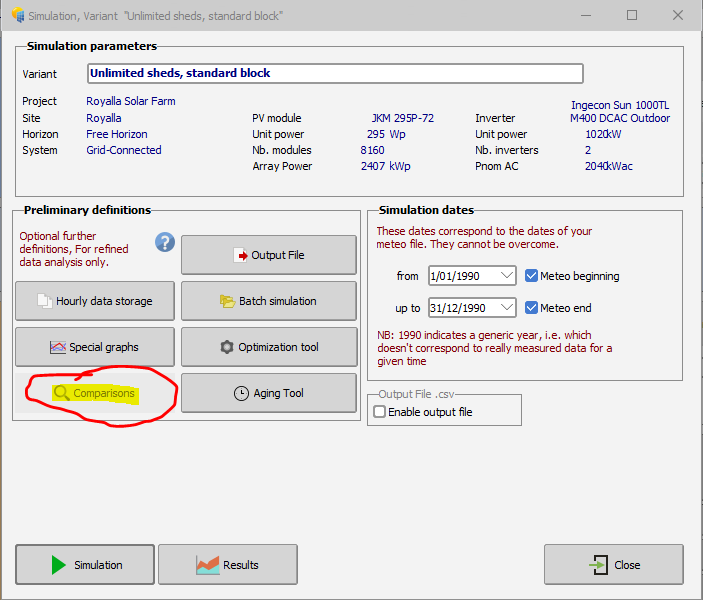
Good morning, I am interested in the "Comparisons" tool in Advanced Simul. It stays greyed out and I don't know how to make this tool available. See snapshot below. Any idea? Thank you
-
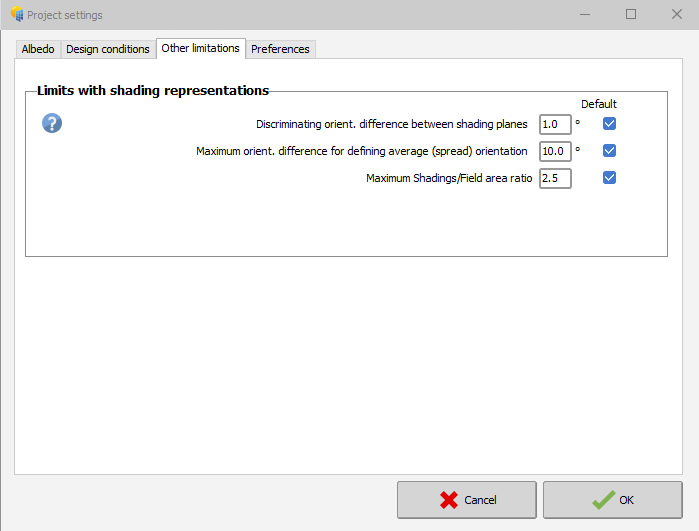
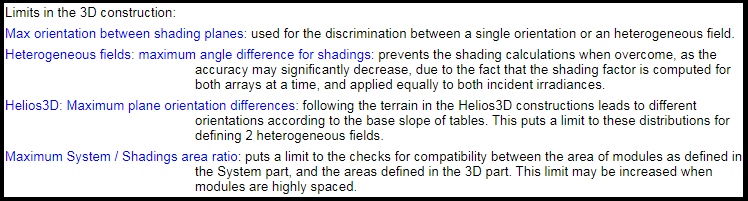
Good morning, I have to admit I'm a bit confused by these settings (Project settings -> Other limitations), even with the official help. The first one "to discriminate if same different shading planes": is this regarding the tilt? (i.e. if we have 24.2° and 24.6°, then it's the same plane, but if 24° and 26° then they are different planes) -> or does this apply to the azimuth as well ? The second one is really going over my head. Also, it seems they are not named the same in the program and in the help, so I'm not sure which one describes which. Happy to be enlightened on what this setting does please :) In the help, there is mention of a "Helios3D max. [...] differences", but this setting doesn't appear on the program? The last one "Maximum System / Shadings area ratio" is clear to me ?
-
Thanks so much, really interesting explanation. It's so much clearer for me now ☺️
-
Hello, In the Economic Evaluation, in the Financial parameters, in the section "Income variation over time", you can give a Discount Rate value. And I understand how it's use to calculate the NPV (Net Present Value). But how do you estimate/determine the Discount rate value to give? (Is it somehow related a little bit to the inflation?) Thanks for your help
-
Hello, With the GCR = Sensitive area / Ground occupation area, is there a way to know the value of the ground occupation area? For example, if I have an "Unlimited sheds" system, in the "Orientation" options, the value of GCR is given, but it would be nice to have an estimate of the actual ground occupied. So that I can adjust my Pitch parameter and number of sheds and keep an eye on the ground occupied, to see if I'm more or less within the area I'm given. Thanks
-
Reactive and apparent energy values in the loss diagram
julmou replied to julmou's topic in Simulations
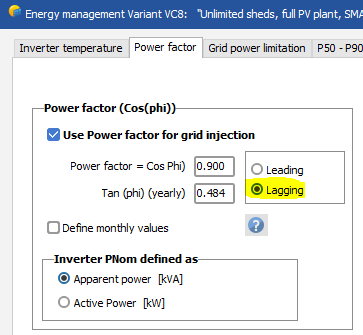
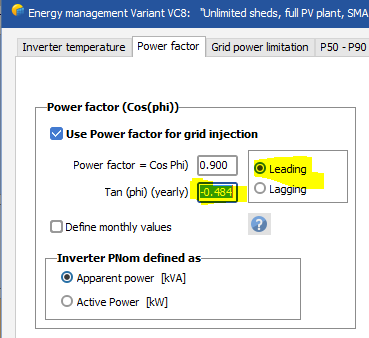
Hi, Thanks André :) Regarding the "from grid" and "to grid", I was checking again, and maybe the mistake, or confusion is not in the report but in the settings. When I enter cos (phi) = 0.9 and tan (phi) = 0.484, tan (phi) is positive, so the angle phi is positive, so we're in a case with a leading phase shift. However, the settings automatically indicates Lagging... So, unless we are meant to give the phi, tan(phi) and cos(phi) from the grid point of view (?) and that the Lagging or Leading is the one of the grid, then the mistake is here. And in that case, the report would be right in saying Reactive energy to the grid. Inversely, with cos (phi) = 0.9 and tan (phi) = -0.484, I have a phi < 0, so a Lagging system, and the settings in PVsyst Energy Management indicates Leading. I think the confusion is there. See snapshots below.
-
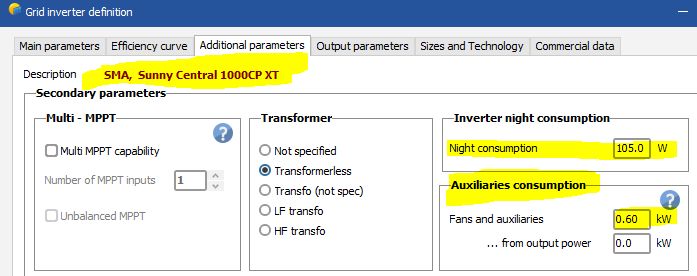
Hello, I have 20x inverters Sunny Central 1000CP XT. In the PVsyst inverter definition, it indicates 105W night consumption, and 0.60kW fans and auxiliaries consumption. However, the SMA datasheet tells something a bit different: For the consumption at night, 100W vs 105W, this is quite similar. But for the consumption during operation, from the max. consumption value at rated power from SMA, I understand that the consumption is proportional to the inverter output power. However, in the PVsyst inverter definition, we have a constant consumption 0.60kW. So my first question is: why are there discrepancies between the datasheet and the inverter definition in PVsyst? When I go to the Detailed Losses settings, at Auxiliaries, and I tick the conveniently placed "Default from inverter's definition" checkbox, I get 12.0kW filled at "Continuous aux. loss", which is logical because I have 20x inverters (20 x 0.6 = 12), however the night consumption stays empty. Why is the night consumption not auto-filled as well, since the value is in the inverter definition?
-
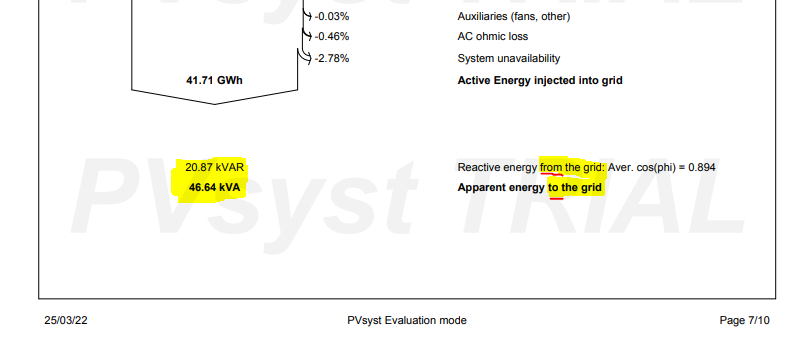
Hello, I have been simulating the use of Power Factor on a 20MW solar farm. The inverters used are 20x SMA Sunny Central 1000CP XT. I have checked the inverter definition and it allows power factor specification, with nominal AC power being apparent power (kVA), in the output parameters. Now, once I'm happy with the whole system, I used the Energy Management section, and specified to "Use Power factor for grid injection" with a tan (phi) = -0.484, and cos (phi) = 0.9, so a Leading power factor. So far so good. Now, the results in the Simulation confuse me a bit. The active energy is all good (obviously more overload loss but it's okay). But I can't interpret well the two values at the bottom of the loss diagram , please see the attached screenshot. First of all, is this energy or power?.... Either it's energy and then the units should be kVARh and kVAh, or it's power but then is this the average power over the whole year, the constant reactive power that's generated, or something else? Second, if my system is leading (so "producing reactive power"), I don't understand why it says "Reactive energy from the grid". I tried then to simulate with a Lagging power factor (tan (phi) = +0.484, and cos (phi) = 0.9), so if it's lagging (like a motor/inductance) it's "consuming" reactive energy from the grid. And this time, the simulation report indicates "Reactive energy to the grid". So I'm really confused...
-
Brilliant! Thanks so much for the clarification! ?
-
Hello, I have spent quite some time understanding how the mutual shading with sheds is estimated and calculated, and how it all works with the GCR and pitch and tilt and limit angle. When choosing "Unlimited sheds" in the Orientation part, the "Shading Graph" and the "Show Optimization" tools are really useful to help us optimize our sheds (with the option of a constant limit angle, or a constant pitch (area ratio)). However, I also note that this analysis is made for a given number of sheds and doesn't take into account that by increasing our GCR (shorter pitch) we can also increase the number of rows/sheds and thus increase our total of MWp we can install. Or said differently, the graphs show the optimization of the yearly irradiance per m2 of collector, but it doesn't take into account that by increasing the GCR we increase the number of m2 of panels (so the number of MWp installed), thus increasing the total energy yield. Instead of deciding on a constant limit angle or a constant pitch/GCR, and then see which tilt would be optimum, as proposed by your model, is there a way to determine the best configuration (both pitch and tilt, as independent parameters) to simply get the max. energy yield from a given surface/area?
-
Am I clear in my last post?
-
With the new PVGIS 5.2 version, more meteorological data has been incorporated and we can see that Australia is finally covered. However, I have been unable to import PVGIS meteo data from with PVsyst so far (using the "Known format" tool). Is this something that will soon be implemented? Thanks https://joint-research-centre.ec.europa.eu/sites/default/files/styles/embed_large/public/2022-02/PVGIS%20Default%20Solar%20Radiation%20Database%20100ppi_1.png?itok=eBSac_GV Default Solar Radiation Databases in PVGIS 5.2
-
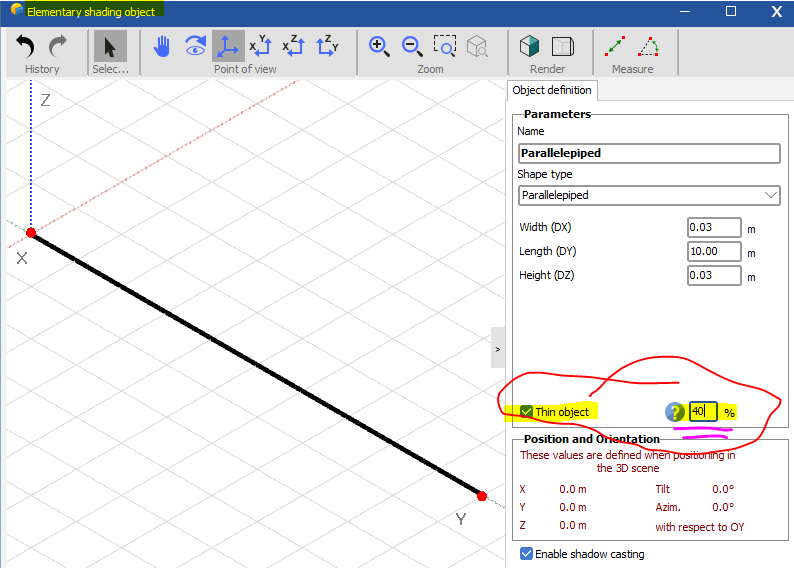
I understand what you're saying. I'm still confused though as to why there are two different values to give: When we create an Elementary shading object, and tick "Thin object", we have to give a value (still unclear to me what this value is) In the Near Shadings main dialog, the "Fraction for electrical effect", which I perfectly understand, but then what's the purpose of the previous value?
-
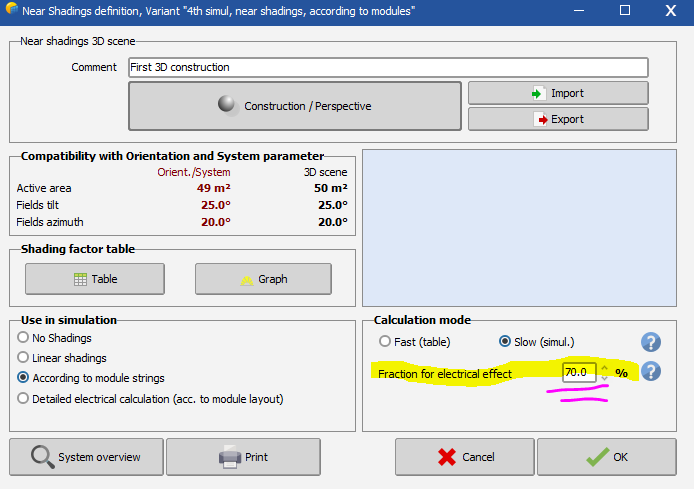
Hello, I find the topic around thin objects rather tricky to understand and would like to know if I'm correct in my assumptions, and then I have a question. When I create an Elementary shading object in the 3D construction tool, I have the option to make it a Thin object if that is the case (let's say it's a cable), then I must give a % value next to it, which I assume is the "Thin object ratio" described in the Helpfile. The way I understand it, the value to give here is always the ratio between the object's width and the width of a cell in the module (13% in the example). Then, thanks to the Thin objects shading analysis tool, I can determine the electrical losses, as a percentage, due to my thin object's shading. If I want to make a simulation, with the "according to module strings" method for my near shadings, then I would use the value found in the previous tool as my "Fraction for electrical effect". Correct ? (8.6% in the example) So overall, after simulation, I will have a decrease of irradiance, associated with the "Thin object ratio", and also some electrical losses, associated with the shaded strings and the "Fraction for electrical effect" that I gave. Right? Thanks for clarifying the above points if I'm mistaken. Now, how do I proceed though if I have a cable, but also a tree, and I want to simulate my near shadings with the "according to module strings" method. What value of "Fraction for electrical effect" do I give in this case? Thanks so much in advance
-
Thanks so much! Yes, they both help!
-
I would be very interested in getting a distribution of the irradiance, on the x-axis the irradiance values in W/m2, and on the y-axis simply the number of hours. Is there a way PVsyst can display such a graph (perhaps in one of the tools) based on the meteorologic hourly data? There is a big interest for me with this kind of data, as PV modules are sold based on the Wp under STC conditions (1000 W/m2), while I believe these STC are rarely met in Nordic countries and there would be an interest in looking for PV modules which perform under low irradiance. Anyway, an actual hourly distribution or frequency distribution of irradiance in W/m2 would give a really good idea, not just of the daily or monthly quantity or irradiation received (kWh) but really of the number of hours our PV modules is really exposed under such or such irradiance (W/m2). Thank you in advance,