julmou
-
Posts
106 -
Joined
-
Last visited
Everything posted by julmou
-
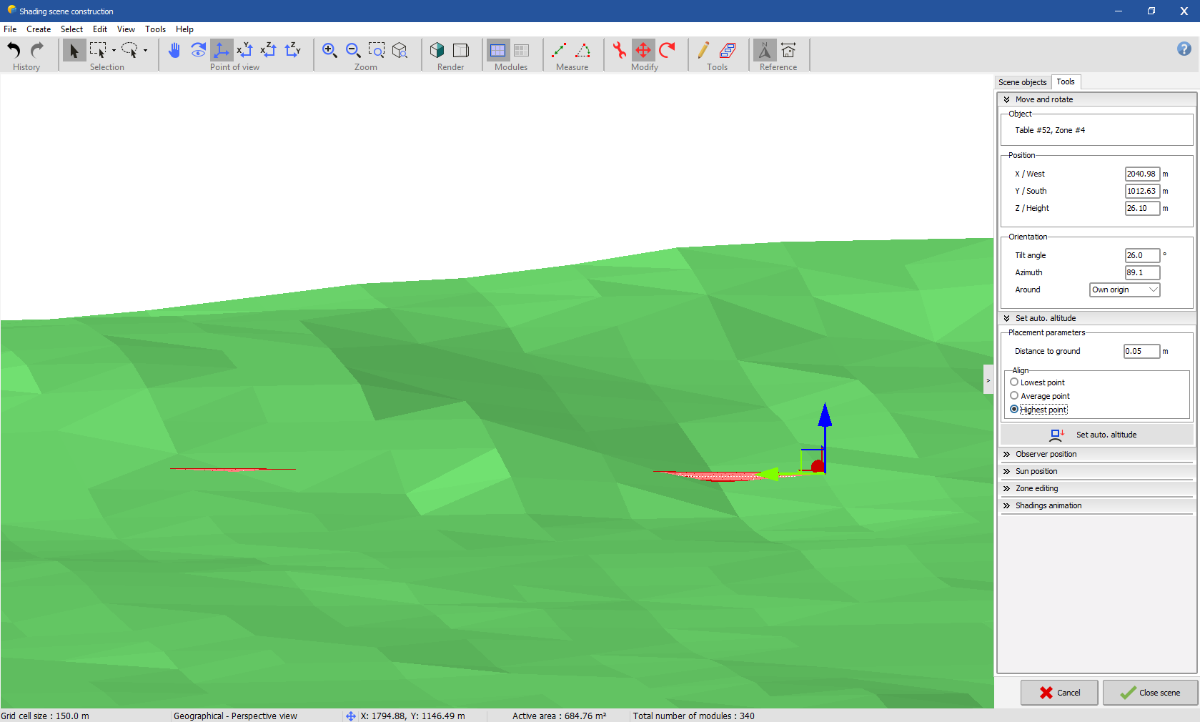
Good day, It's something I noticed already some time ago and am only posting about it now. When we have a PV table, and we want to position it on the z-axis on a slope such as an inclined roof, or a non-flat terrain, we can right-click the table and use the "Automatic altitude" tool. When using it on a roof (which is a "clean" straight slope), we usually get the result we expect, that is the PV table at the same level as the roof (+ our own "Distance to ground" setting). But really, the 3 different "Align" settings should produce different results though (Lowest point, Average point, Highest point)... This becomes more obvious when we use the tool on uneven ground, as I try to illustrate here: 1. One long PV table over a complex ground before using the Automatic altitude: 2. Using the Automatic altitude: The issue here is that, no matter the setting used (Lowest point, Average point, Highest point), I always get the same result. It seems they're all using the lowest point... So, bottom line is, no matter what the configuration (uneven ground, inclined roof), the three "Align" settings produce the same result, whereas they should output different results. Let me know what you think. Kind regards, Julien M

-
"Fill zone" tool really slow in 3D Near Shadings
julmou replied to julmou's topic in Problems / Bugs
Could I have feedback on this? See the % progression at 1:10 on the video. It takes a while to just progress of 1 %... ? I am using the version 7.2.21 -
Hello, So, I wanted to check the Comparison Tool again. So I go to Measured Data > Measured data analysis and I load the _DEMO_N13_Motorway project. Now, I try to Run the Simulation, and then it just crashes systematically... I thought I would let you know. Is it only on my system or are you witnessing the same problem? (PVsys v.7.2.20)
-
Good day, I just wanted to say thank you! I can see that's it has been implemented now ? We can go to Database, Import a Known Format, and now we can import data for Australia from PVGIS-ERA5 (v5.2) But you may want to update the data source description for ERA5, which is no longer "Europe only, 2010 to 2016". Regarding the description of the ERA5 database, according to PVGIS website: "The new default radiation database is a combination of PVGIS-SARAH2 and PVGIS-SARAH (Europe, Africa, Central Asia), PVGIS-NSRDB (Americas) and PVGIS-ERA5 (Nordic countries above 60 N and the rest of the world)." See link: https://joint-research-centre.ec.europa.eu/pvgis-photovoltaic-geographical-information-system/pvgis-releases/pvgis-52_en Data is from 2005 to 2020, see this link: https://joint-research-centre.ec.europa.eu/pvgis-photovoltaic-geographical-information-system/getting-started-pvgis/pvgis-user-manual_en#ref-3-choice-of-solar-radiation-database
-
Hello, When constructing a 3D scene, when creating a new zone, I noticed that the "Fill zone" tool is now really slow. I'm a big fan of this tool, because it helps filling big geometrical shapes quickly. I made 7 different zones last time I used this tool in a project, and I don't recall that the automatic filling was so slow. I made a recording to give you an idea. It's really slow. https://youtu.be/_h4R-elTpmM I also tried in an empty project, where I created a new zone and filled it up, it's still slow. (Note: I run Python codes and algorithms regularly on my computer and never experienced a lack of performance, so I don't believe the issue is the computer.) Let me know what you think. Regards, Julien
-
Good day, I came up with this idea from the Storage section of a project, where we define the Storage Strategy, in this particular case a Peak Shaving strategy. We have to give the Grid power limit for the peak shaving, see below: I think it would be very useful to be able to insert a Grid power limit profile instead of a single value. In the same manner we can give a profile of the grid unavailability with the Weak Grid strategy, or a yearly profile of the tariff in the Economic Eval. section. This would be great for the Storage Peak Shaving strategy, but it could also be applied to a non-storage system, where the grid limit fluctuates. To give a practical example: the grid (admittedly weak, old and very "linear" instead of star-shaped) in Australia is very congested, especially with all the private-household solar systems contributing during the sunny part of the days. So the grid authority can give order to a newly built solar farm to stay at a low injection point (Hold Point Test) for a long time (e.g. a 100MW SF limited at 20MW), but then agreements can be reached where the SF can produce, say up to 50MW during certain hours, but no more than 20MW during others, or be allowed to produce normally during most of the year, but be limited at 80MW only during summer time). -> for these reasons, I definitely think being able to incorporate a Grid Power limit profile in the simulations would be useful. More and more developers are seriously balancing the pros and cons of adding a storage to their project now, because the waiting time for being allowed to produce the max. power can be so long here, that it can be worth having a battery that can re-inject from 5pm for the whole evening, the extra energy it couldn't inject during the day. But then, the strategy would change from the time the max. power is allowed (albeit still using the battery to maximize best time of day to inject etc, but with more room for options). Anyway, in this example, the project would have a Grid Power Limit for like 6 months and then no power limit -> therefore being able to incorporate a yearly profile for the grid power limit would allow us to simulate how a first year of operation would actually look like, and get the financial perspective of that year. Then the next 19 years can be simulated separately without grid power limit. Let me know what you think, and if it's a feasible PVsyst improvement. Regards, Julien
-
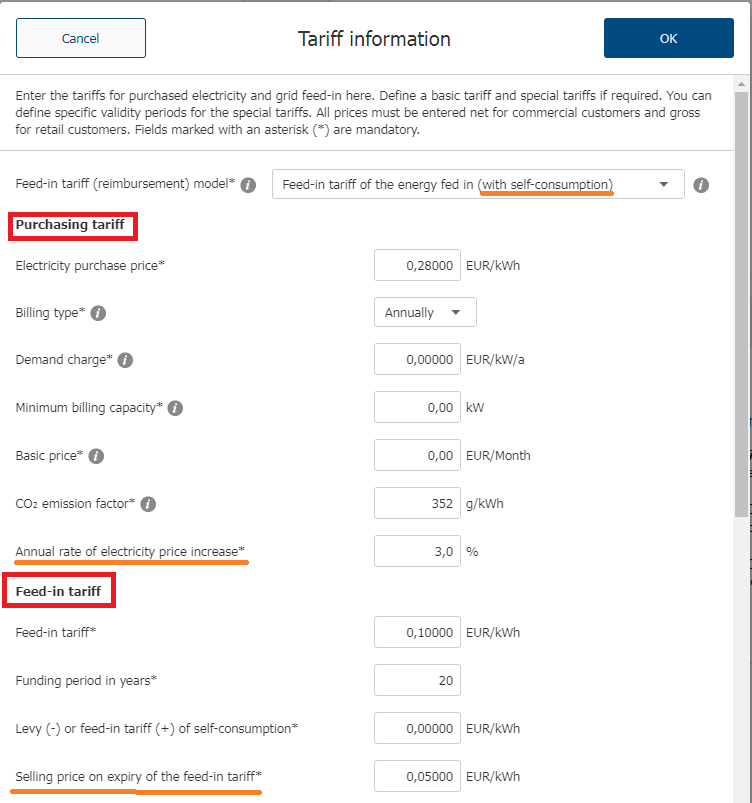
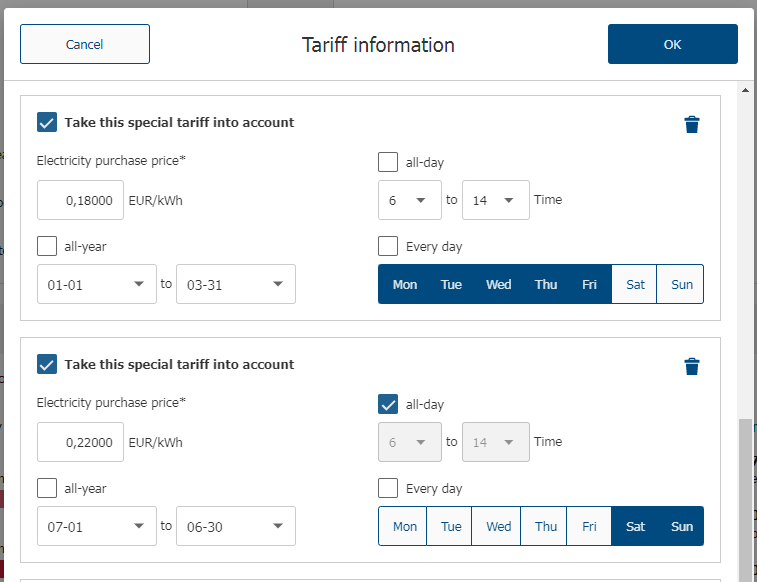
Good day, I would like to expand on this topic (https://forum.pvsyst.com/topic/2715-economic-evaluation-tariffs/) from May 2022. See, I have been using the Sunny Design Web Tool for comparison purposes for a bit of time (https://sunnydesignweb.com/sdweb). I really like how we can edit the Tariff section there and, because I think PVsyst is lacking in that area, there is definitely inspiration to be taken there. See example below, for a Self-Consumption project. On the first screenshot, we can see there's already quite a few options and parameters that can be entered for both the purchased electricity from grid (purchasing tariff) and the sold electricity (feed-in tariff). But then, what really shines is the next part (2nd screenshot), where we can add "Special tariff" with different values depending on the season/months, on the day of the week, and on the time of the day. Adding two Special Tariffs: one that applies only from 1st Jan to 31st March, only on weekdays, and from 6am to 2pm. one that applies only in July, at any time of the day, but only on weekends I find this Special Tariff interface quite simple but very powerful. Hoping this would give some inspiration to improve the Economic Evaluation part of PVsyst with more options for the Tariffs. Regards, Julien
-
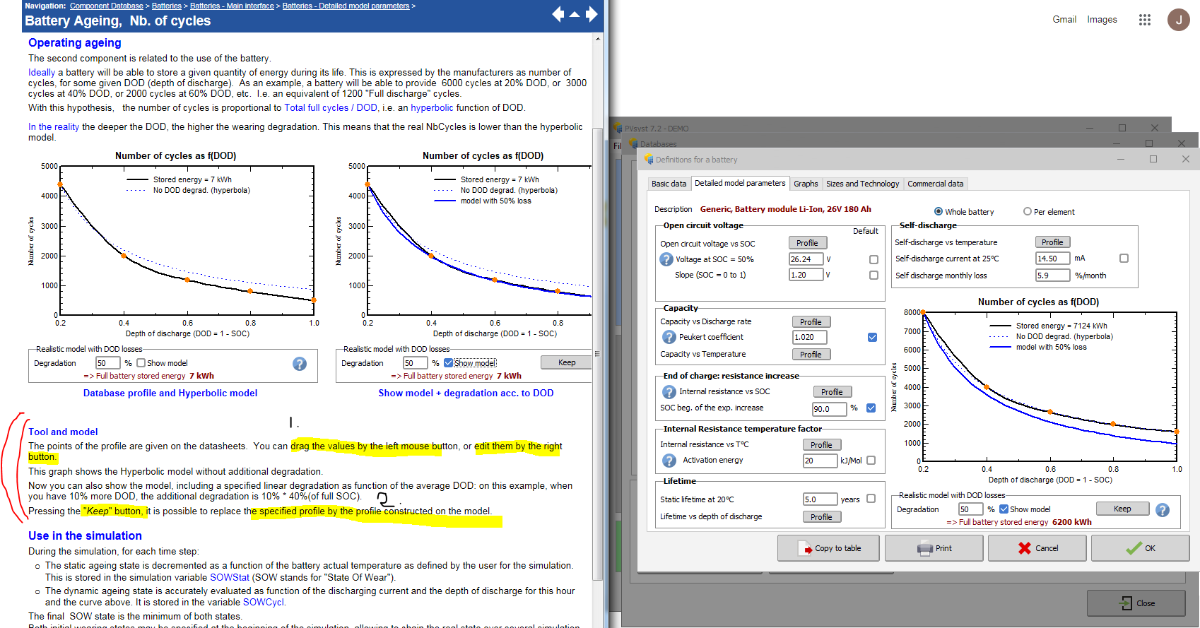
Good morning, This has to do with the dynamic lifetime, which is the total number of cycles as a function of the DOD. When you open a Battery Component (either from a Standalone project, or from the database), go to Detailed model parameters, then click "Profile" under Lifetime. In the Help (Component Database -> Batteries -> Batteries - Main interface -> Batteries - Detailed model parameters -> Battery Ageing. Nb. of cycles), under the section "Tool and model": There is mention that You can drag the values by the left mouse button, or edit them by the right button. However, I've tried and I can not edit the values (which I assume are the orange points). Is it a bug or am I not doing something properly? Then we can also display a blue plot with a model of our choice (e.g. 10% or 50% degradation at DOD=1). And then by Pressing the "Keep" button, it is possible to replace the specified profile by the profile constructed on the model. It seems to work at first, but if I open the same component again, the profile is back to what is was. So not sure if this function is doing anything. Let me know! Thank you in advance for your time :) Greetings from Down Under
-
This is probably my last attempt. ? Any thoughts on why we have efficiency > 100% in the above post?
-
Any thoughts on this ArrayON variable that keeps counting the hours even when the array is switched off?
-
Grid-storage with self-consumption -> charg. and disch. times
julmou replied to julmou's topic in Suggestions
Good idea, bad idea? Feasible, not feasible? -
Hoping this suggestion will make its way somehow :)
-
That's interesting, thanks for your answer! Out of curiosity, which data source(s) do you trust most? Also, what do you mean with careful tuning? Thank you!
-
Grid-storage with self-consumption -> charg. and disch. times
julmou replied to julmou's topic in Suggestions
Any thoughts on this suggestion? -
Any more feedback from people using Meteonorm in the Southern Hemisphere compare to other sources of data? So far, it would seem from my case and @cyoung 's case above that the Global Irradiation of Meteonorm in Australia tend to be quite higher than the other sources... (+ 12% as I detailed in my case above is quite significant!)
-
Good day, I found my way around and did a similar case by using public terrain data. But, to the PVsyst team, I still think it would be nice to have the terrain data of the above illustration available somewhere, especially because this "Use case : Complex PVsyst scene" is described in the help, and it would be good to have the data to follow along when one learns about this.
-
Has the ArrayON variable been corrected since then? This variable, in hours, indicate how long the array is on. However, with stand-alone projects, even when the array is switched off (because max load SOC trigger has been reached) and as the array is effectively off ("Array Current" and "Effective energy at the output of the array" both at zero), the ArrayON keeps counting the hours as if the array is still ON.
-
I will be happy to get an explanation on this efficiency being above 100%, thank you so much
-
PVsyst crashes when loading a "grid unavailability profile"
julmou replied to julmou's topic in Problems / Bugs
Hi, Thanks for the reply. I tried again and it seems it's not occurring anymore. Perhaps one of the new version, since June, fixed it. I will notify if it happens again, but for now it seems to be all good. -
Does this scene/terrain exist somewhere or could be imported from somewhere?
-
Do you think having a database for tracker systems could be relevant for PVsyst?
-
I still don't quite get this... Thanks in advance :)
-
Hello, Here is my thought process: I thought Meteonorm was the most accurate in terms of irradiation data (mixture of satellite and weather stations data, accumulated over many years, great algorithm etc), so I was mostly relying on it to do my simulations. Recently, I've been studying a site near Canberra (Australia), and these are the various annual Global Horizontal Irradiation I get depending on the source (always using same coordinates): Meteonorm 8.0 -> 1915 kWh/m2 PVGIS 5.2 (ERA5) -> 1670 kWh/m2 Global Solar Atlas / SolarGIS -> 1750 kWh/m2 NASA-SSE -> 1693 kWh/m2 SMA Meteo. data / Sunny Design -> 1753 kWh/m2 As you can see, they are ALL around 1700, EXCEPT Meteonorm... which bothers me as I thought it was the most trustworthy. Which is why I would be happy to share experience from fellow developers about your experience regarding accuracy of different weather sources. When importing this Meteonorm data in PVsyst, it shows "Sat=93%" which means 93% of the data are from satellite sources, and only 7% from weather stations. I'm guessing, the bigger the part with actual ground stations (so the lower the sat. part), the better? I'm also guessing this has to do with the site being in the Southern Hemisphere. I'm pretty sure Meteonorm is great with Europe, but if some of you guys have feedback on the accuracy of these various meteo data sources in the S. Hemisphere, I would be very interested. Because now, I'm really doubting if I should keep using Meteonorm at all here (I get 1716 kWh/m2 if I average the 4 other sources, so Meteonorm in that case has a deviation of 12% from that value!!).
-
OMG, yes, it's so simple it's almost embarrassing... I was convinced the options were not available in the menu anymore. But all I had to do was to keep the Orientations management tool open ? To my defence, when I wanted to do my selection on the scene, I would try to reduce the Orientations management dialog, which would in turn reduce the whole PVsyst program in the windows taskbar, so yeah, I ended up closing the dialog every time I wanted to interact with objects from the scene, but by doing so, the Orientation options would disappear from the right-click menu. Anyway, solved now! Thank you!
-
Good morning, So, I was able to create the terrain of my site of interest in PVsyst. This website EarthExplorer from USGS now provides Digital Elevation data (SRTM) at a resolution of 1 arc-second for the whole globe. Using a GIS, one can reduce the downloaded data to a smaller site of interest, and then convert them into XYZ data, which can then be imported into PVsyst. Screenshot below of the resulting ground object in PVsyst. Now, I wanted to practice the Orientations Management tool, in a similar manner to the "Use case : Complex PVsyst scene" in the Help. So I created an array of tables, which follows the ground slopes. Quite naturally, I get quite a number of different orientations detected. To homogenise of all this, I select the whole array and try to create a new orientation based on the selection. To my surprise, the option is not available anymore... (contrary to what is shown in the "Use case : Complex PVsyst scene). See the 2nd screenshot below. When right-clicking the selection, the "Create orientation from selection" or "Add to orientation" options are nowhere to be seen... I think the management of the orientations is an essential function of this program. I'm quite surprised we can't manage them anymore as shown in the Help. Have these options been removed by choice or is it a bug?