


julmou
-
Posts
106 -
Joined
-
Last visited
Posts posted by julmou
-
-
Just a quick question, I couldn't find the answer anywhere:
when we define the Pnom threshold for a Master/Slave configuration, is the value a percentage of the Pnom power of the inverter? Or is the kW value? (see screenshot below)

-
I'm not sure if I was clear with this suggestion.
I just think the ArrayON variable (Duration when the PV array is producing) would be a really good indicator to give us an idea of how much the PV array is disconnected during a year (when battery reaches full capacity).
By comparing different simulations, we would be able to compare in which configurations the PV array is the least disconnected (so more direct use).
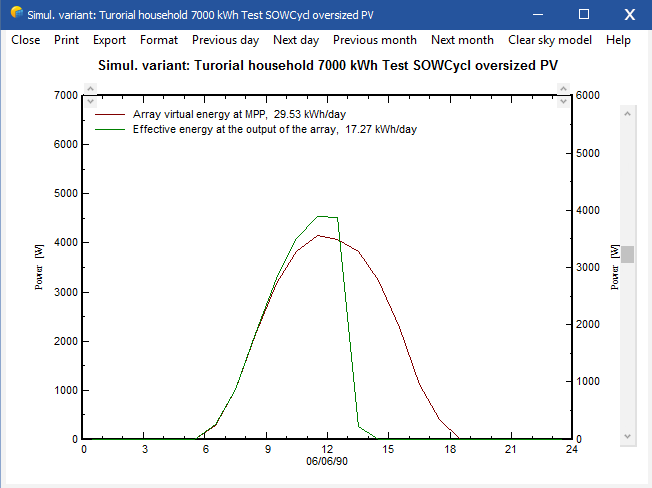
But at the moment, the ArrayON variable is still counting even when the "Array Current" and "Effective energy at the output of the array" drop to zero (in practice, PV array not producing anymore, so ArrayON should stop counting).
-
Good morning,
In every single project with Grid Storage and Peak Shaving strategy, one of the values displayed under "Peak shaving System Information" is always at 0 kWh... It's the "PV array daily production (summer clear day)". See snapshot below for illustration.
-
Good morning,
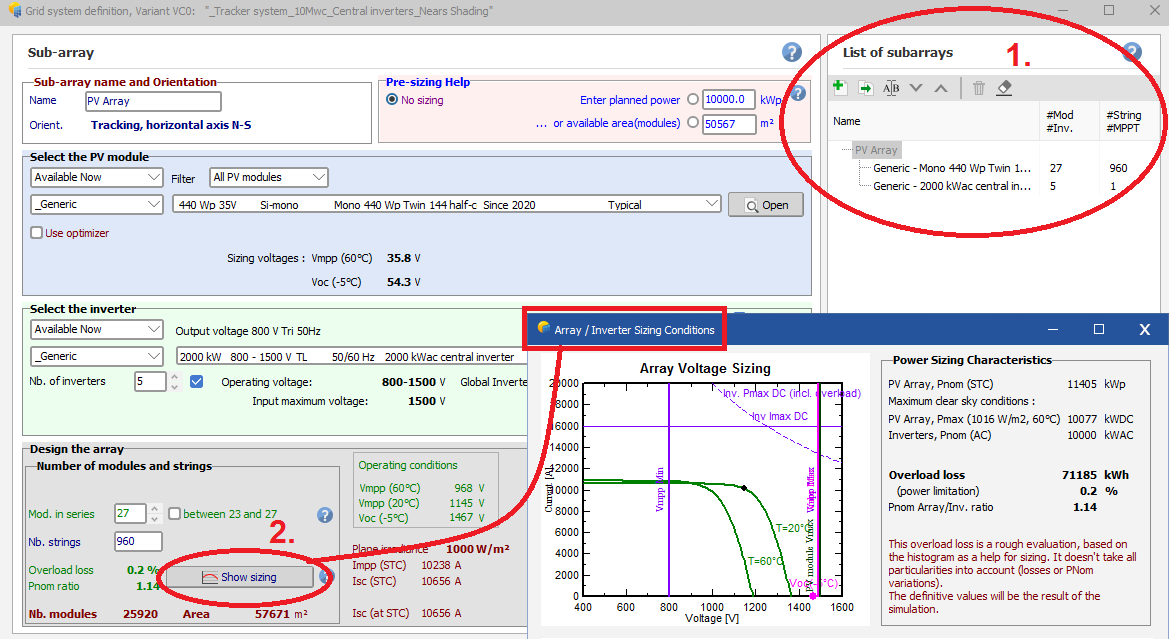
When sizing/creating new Stand-Alone Projects, and when the project is bit more complex, I find two tools missing when sizing the PV array which would be really useful. These tools are present in Grid-Connected version but not the stand-alone.
- Having several sub-arrays -> it seems we can only have one array with a Stand-Alone project. However, we can easily imagine several controllers, each in charge of a different section of the PV array, and they would have different SOC thresholds, for instance disconnecting only one sub-array when reaching full battery, instead of disconnecting the whole system. Similarly, if we have MPPT controllers, we can have several sub-arrays with different orientations (their input voltage is managed by separate controllers/converters, but the converter output voltage to the battery would be the same).
- The "Show sizing" graphic tool, which shows us the Vmpp min and max and the Voc etc -> really useful to see visually the limits of our system.
To illustrate, please see below a screenshot of the PV array sizing with Grid-Connected, and with Stand-Alone. The two mentioned tools are highlighted.
Grid-Connected:
Stand-Alone:
-
Good morning,
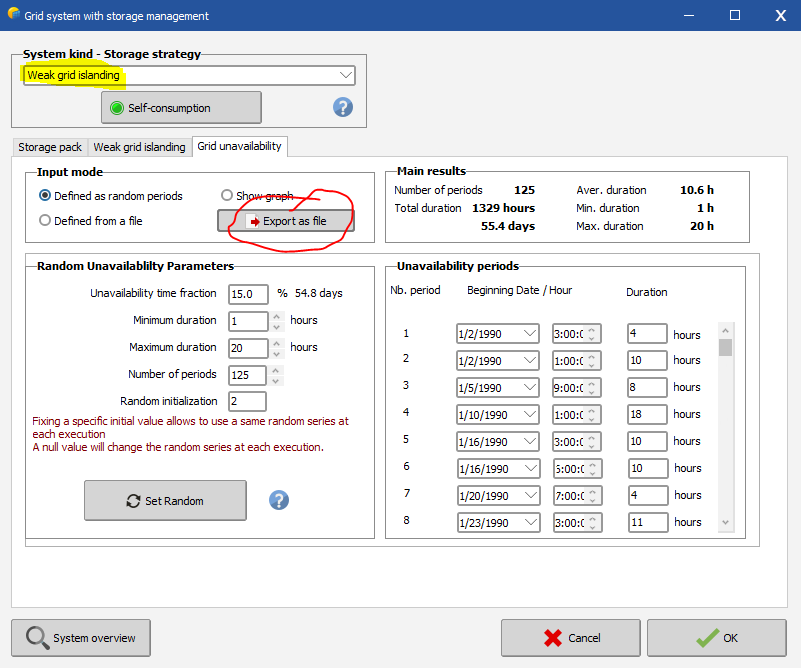
In a grid-connected system, when using storage with a "Weak grid islanding" strategy, we have the define a grid unavailability profile. We can generate it randomly and export it as file, which is great, or create a file of our own. For the test, let's us export a file and try to reload it. A CSV file is created/exported, as seen on the picture below.
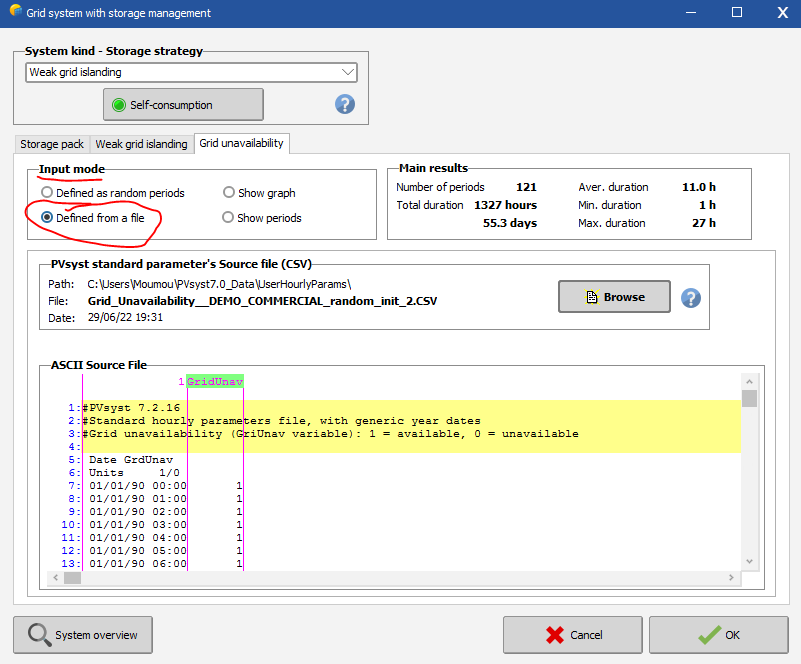
So, we can try to load the file by selecting "Input mode" -> "Defined from a file", as seen below, then click OK, everything normal until here.
But then, if I go back to Storage (to change a SOC threshold value, or the sizing of the battery pack for instance), then the software crashes... systematically.
Hope this can help to identify and solve the problem.
Regards,
Julien
-
Good morning,
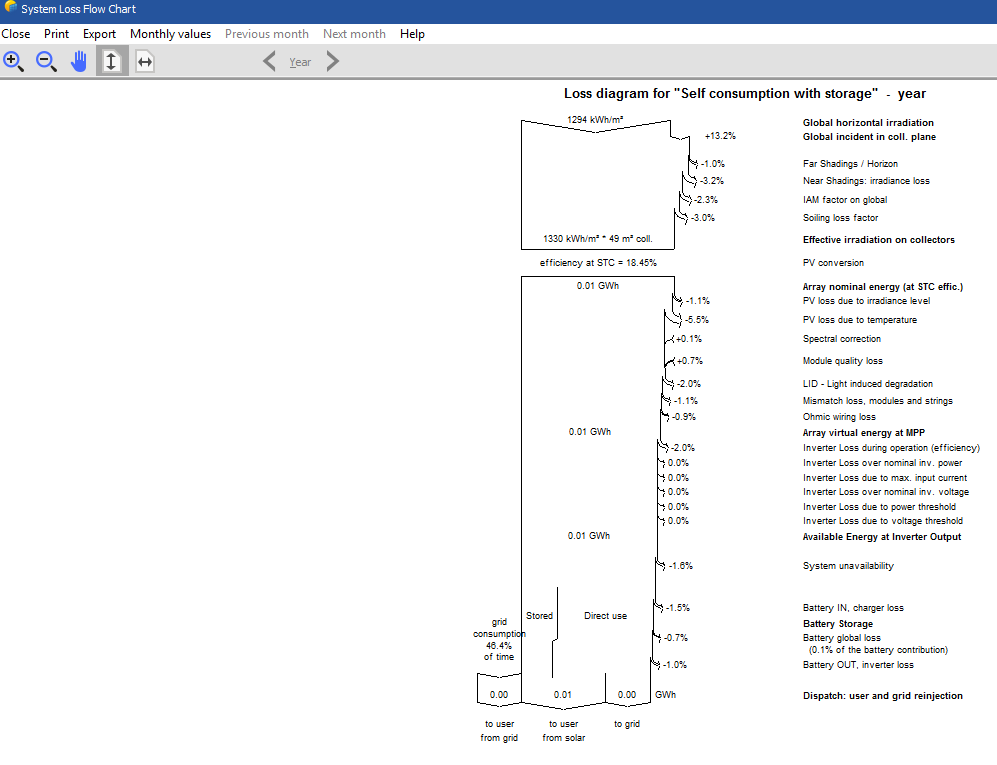
I've noticed in some instances the big arrow from the Loss Diagram is not displayed properly.
Here are two cases:
- With a Grid Storage with "Weak grid, islanding" strategy (here, DEMO residential with storage, adapted for weak grid islanding). As you can see the resulting Diagram Loss is quite different from how it's supposed to look like in the Help. Obviously one side of the main arrow is missing, but also the kWh value for the "Energy from the grid" is brought down next to "Missing" which makes it really confusing. And we don't have the % for the "Energy from the grid"
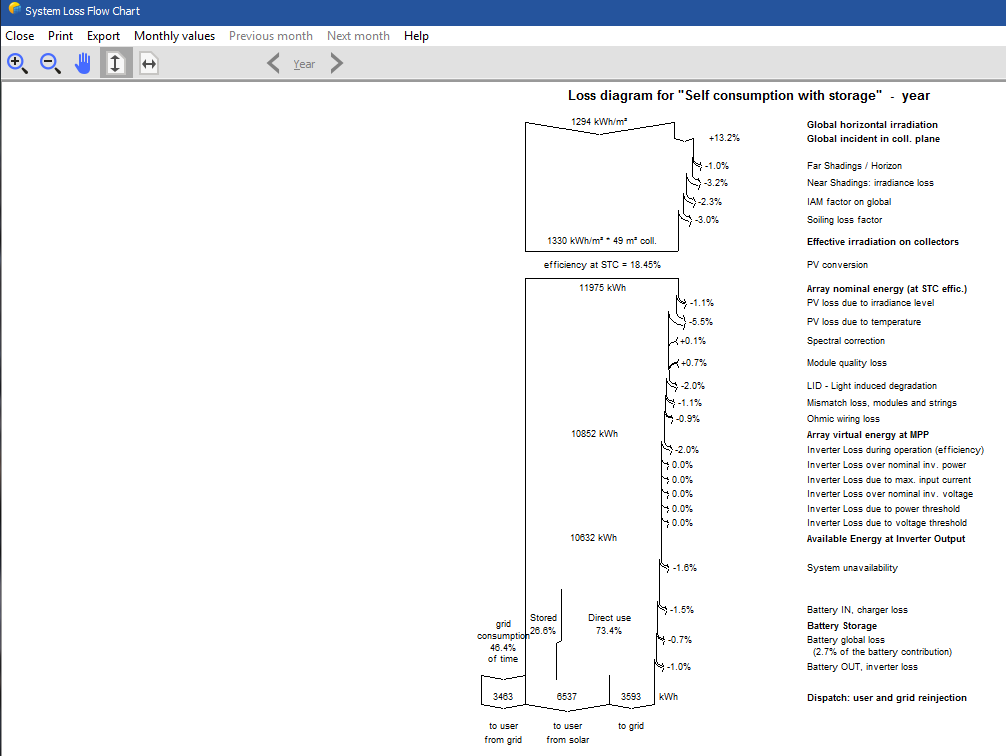
- Grid storage with "self-consumption" strategy, but where the option "Allows solar injection into the grid" was deactivated (DEMO Residential, self-consumption with storage, NOT allowing injection into grid). Here also, one of the side of the main arrow is missing. This is also visible in the Report.
-
Good morning,
From PVsyst Help:
QuotePV array new charging strategies: modern controllers are now able to regulate the charging current using PWM techniques. When attaining the maximum charging voltage, they will limit the current for keeping a constant voltage (floating mode). In a solar system, this is very useful for compensating the load current if any: the PV array will provide the required load current, ensuring a null current in the battery.
From André Mermoud in a previous post:
QuoteYou are right: it is not very logical that the battery is used when there is sufficien PV power for feeding the user needs.
However if you think about the real system in operation: when the battery is full, it has to be disconnected.
This means that the PV array is directly connected to the user's circuit, through the Power converter. If the user's needs are lower than the PV production, how does the MPPT-DC converter behave ?
In a Grid-connected system, the Power limitation (which is a fixed value) is achieved by a displacement of the operating point on the I/V curve. A MPPT-DC converter should be able to detect the output needs level; probably an overpower (with respect to user) will increase the output voltage. The device should be able to detect this voltage increase and displace its operating point on the I/V curve accordingly, Which MPPT converters are equipped with such a control system ? I don't know !
When I wrote this simulation behaviour (25 years ago! ) I was pretty sure that such a control doesn't exist. This is now perhaps possible (this should be mentioned on the datasheets), and perhaps the simulation should be able to treat this case.
All solar chargers sold on the market now are either PWM or MPPT.
We know that, with PWM controllers, when the battery reached the defined maximum SOC or voltage, instead of disconnecting the array, the controller will modulate the width of the pulses in order to maintain a constant voltage on the battery that is not too high and stay below the Gassing region. This modulation will also limit the charging current into the battery. In the end, this "floating mode" prevents the PV array to be disconnected, and this one will be able to provide just the current needed for the load => we maximise the use of the PV array (direct use) and limit the use of the stored energy (thus increasing battery lifetime).
Similarly, we know that on normal solar inverters, if we have a grid limitation, the inverter is able to displace the operating point on the I/V curve, so that the power delivered stay below the grid limitation. MPPT solar chargers (DC converter) are now also able to adjust I/V operating point when the battery is full, so that the PV array can keep running and supply just the right amount to meet the load: search Google for "mppt float voltage" or "mppt float charge" to see that it is now a well-known and common feature.
So my question is just: is there a planned update/upgrade to incorporate PWM floating mode and/or MPPT floating mode into Stand-Alone systems?
Julien
-
Hello,
I've noticed a small bug. If I go to a big project like 25 MWp (own project), where the results in the loss diagram are displayed in GWh, and then I go back to a smaller project (9 kWp, DEMO Residential Geneva, Self consumption with storage), and go to Detailed results and Loss diagram, the results values stay in GWh and they indicate 0.00 or 0.01 GWh...
The only option to bring it back to normal is close the software and reopen the small project again first.
Here you can see the screenshot where all values are around 0.00 GWh:
And here you can see the same project with values normally displayed in kWh:
-
Good morning,
In this section of the Help "Self consumption with storage", we find some valuable information regarding the sizing:
QuoteNow there are some additional constraints to this sizing:
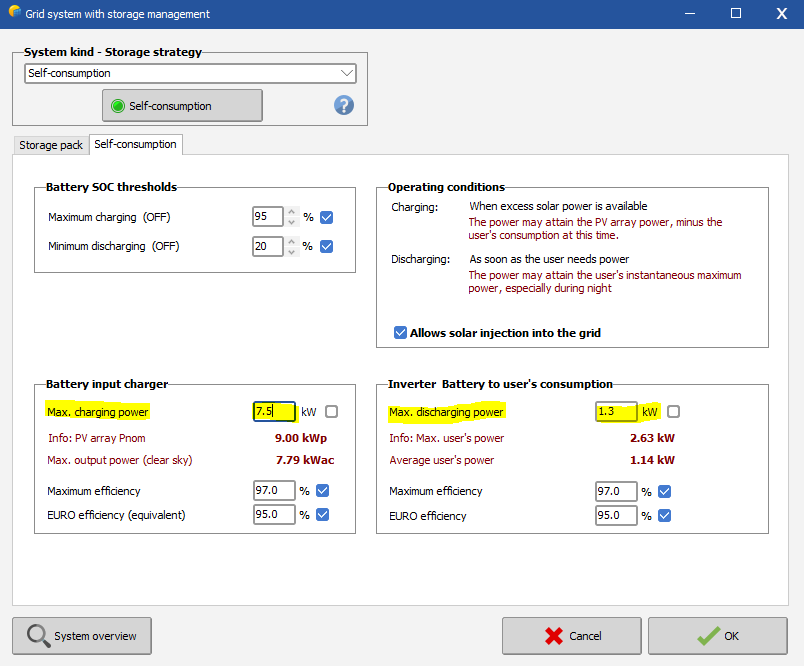
- The battery charging should not be too quick: for Lead-acid batteries, a charge in 3 hours is the minimum reasonable for the lifetime of the battery. Li-Ion batteries support higher currents (up to 1 hour). This should be limited by the charger maximum power. The eventual excess power energy will be injected into the grid. If this is not desired, the maximum PV power [kWp] should be able to charge the battery in 3-5 hours minimum. - The inverter maximum power should be sufficient for feeding the maximum power required by the user. Again, the maximum discharge current should not be excessive (C3, i.e. discharge in 3 hours, for lead-acid, around C1 for Li-ion). If these powers are exceeded, the battery capacity should be increased. This may be the case when the full consumption of the day is concentrated on a short time. Therefore, we want to be able to adjust to "Max. charging power" and the "Max. discharging power" values, in the "Storage" dialog box of the system, in the "Self-consumption" tab, so that we get appropriate charging and discharging times. However, I find very tricky that, as we change these values, we have no indication of how the charging time is changing.
I mean, I know we have some charging and discharging time information in the previous tab "Storage pack", but they are fixed values and don't change as we adapt/play with the "Max. charging power" and "Max. discharging power" values. I think it would be very useful to have an indicator in each boxes ("Battery input charger" and "Inverter Battery to user's consumption") that gives the charging and discharging times and updates the value as we play with the before-mentioned parameters.
I don't think it should be too hard, since we already get the information as a warning message when we enter too high values (e.g. "The Charging max. power (10.0 kW) is too high. It corresponds to a battery charging rate of C1.2 (1.2 hours)" or "The discharging max. power (15.0 kW) is too high. It correspond to a battery discharging rate of C0.8 (0.8 hours)"). I just think it would be really helpful to have the information constantly.
-
Thanks for the clarification :)
-
Good morning,
I am using the DEMO Residential Geneva Project, with the variant VC5 "Self consumption with storage".
I have a question about some of the information when we open the "Storage" dialog box.
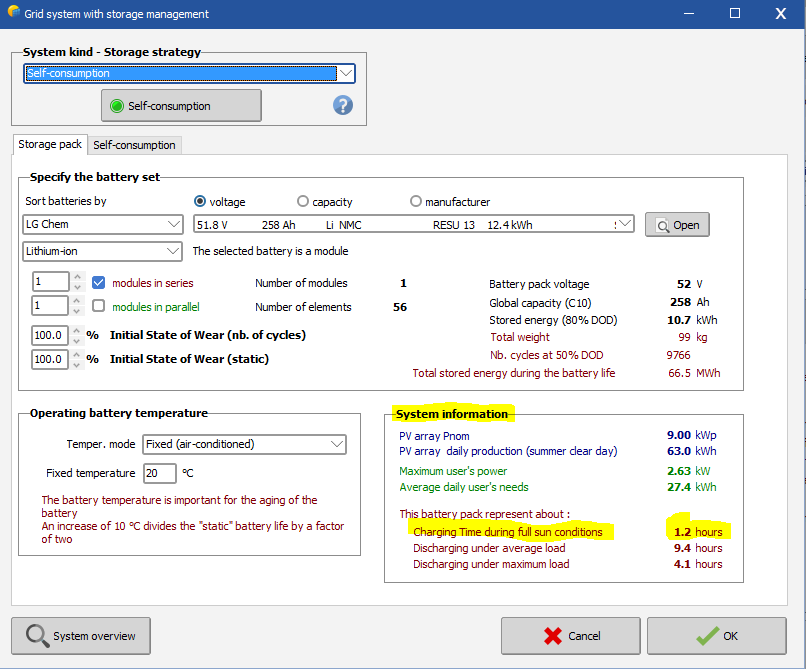
Under the "System information" part, there is "Charging Time during full sun conditions". Now what are these "full sun conditions" exactly? The STC conditions (1000 W/m2, 25°C) or the summer clear sky conditions? Because, on the next tab "Self-consumption", we have the PV array max. output power (clear sky) at 7.79 kW, which would take the 10.7 kWh potential stored energy 1.4 hours to recharge, not 1.2 hours. But under STC conditions, the 9.0 kWp of the array would produce 9 kW which would indeed charge the 10.7 kWh in 1.2 hours.
So I just want to clarify, because the "during full sun conditions" confuses me... Specially because in the same tool, we also see the "(summer clear day)" and "(clear sky)" terms.
What does "full sun conditions" mean in this case?
-
Thanks so much for the explanation :)
-
Hello,
I noticed a few times, in the Simulation Report with Stand-Alone project, the PV module and Battery manufacturers always show "Generic", even when it's not.
For example, I have here a system with SunPower PV modules and Sonnenschein Batteries, but they are displayed as Generic in the report:
-
Quote
However if you think about the real system in operation: when the battery is full, it has to be disconnected.
I don't argue that at all. I just think that, when this is the case (array disconnected because battery full), then the variable ArrayON (Duration of the PV production of the array) should also reflect that.
At the moment ArrayON just counts the hours as long as the sun is out. I think ArrayON should not count the hours when the array is disconnected and not producing any current and energy (as I tried to illustrate above -> i.e. when the array current or when the effective production of the array is zero).
Also, I haven't tested with MPPT or DC-DC converter yet. This is just with Direct Coupling.
-
Good morning,
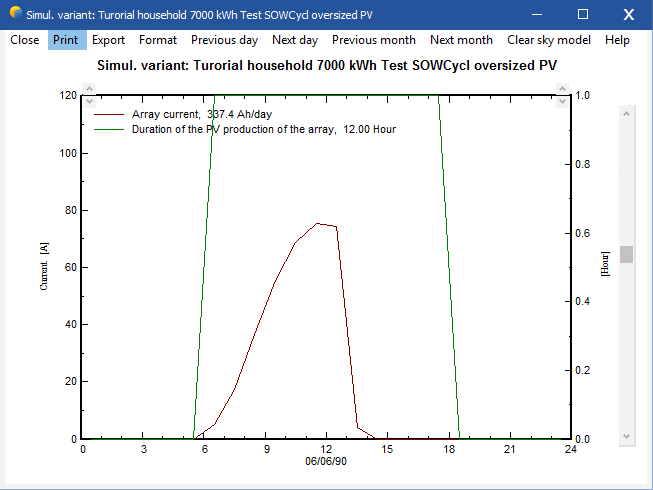
There is something that I find tricky to evaluate with stand alone projects, and that is highly influential on the entirety of the system. I noticed that with "oversized" PV array (PV modules cheaper so most systems tend to decrease cost on battery by having more kWp which would provide current even under cloudy conditions), there's more wear on the battery because it is actually used more. The reason being that it reaches the max. SOC more often -> and we have the charging thresholds at 90% (triggered OFF -> array disconnected from battery) and at 75% (triggering back ON -> array reconnected) -> so what ends up happening is that the PV array is disconnected often, thus the load is often working on battery only, without direct use from the PV array -> therefore, even though we have plenty of energy available, the battery wears down more quickly. See below snapshot of the Charging Thresholds and Hourly Graphs showing the PV array disconnecting:
NB: this is with direct coupling
Anyway, where I am getting with this, is that it would be great to have a variable helping us estimate the importance of this phenomenon, such as how many hours the PV array is actually ON every day -> the ArrayON variable (Duration of the PV production of the array) should be perfect!
Unfortunately, ArrayON always have the same value as long as the sun is out -> which is where I think it's wrong and I can only suggest to re-assess this variable for stand-alone systems -> when the Array Current is 0 (not delivering any current to the system, PV array disconnected at the charge controller level), then ArrayON should also be 0
ArrayON in "normal behaviour" (charges battery and provides direct energy to the load):
ArrayON when the PVarray is disconnected -> still ON, even when the array is not producing anything
Thanks so much for reading this (a bit longer that I intended it to be sorry). Let me know what you think.
Julien
-
Hi,
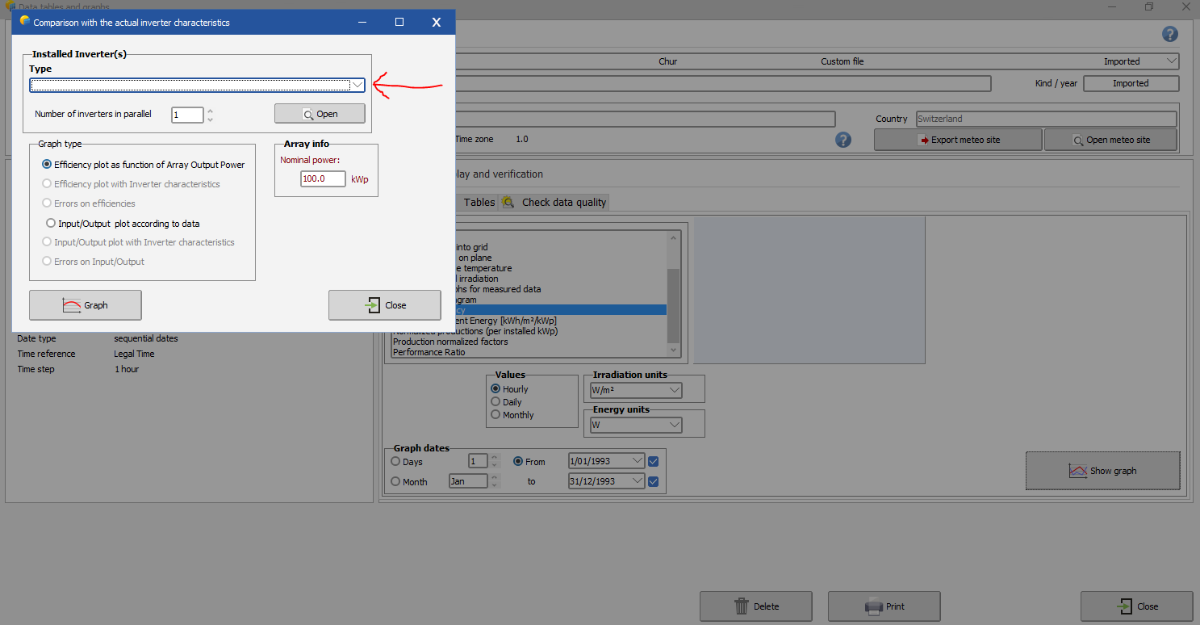
I was just randomly checking this tool again when reading my notes, and it seems that with the new version of PVsyst (7.2.15), now I can't even select a type of inverter anymore within the Inverter Modelisation Analyzer (see above post).
-
Quote
The main source of wearing is the number of cycles, i.e. the total Charging/Discharging energy.
Hmm, I didn't realize we could "count" the number of cycles through the energy used by the battery.
When you say the "battery use" energy in the loss diagram, do you mean this one (circled in red) ?
In that case, we have:
8.0 kWp -> SOWCycl 88.2%, SOCmean 82.4%, Battery Charging/Discharging energy 5540 kWh (7611 kWh eff. array energy, 72.8% stored, 27.2% direct use), SF = 1
6.4 kWp -> SOWCycl 89.1%, SOCmean 82.3%, Battery Charging/Discharging energy 5088 kWh (7527 kWh eff. array energy, 67.6% stored, 32.4% direct use), SF = 1
4.0 kWp -> SOWCycl 92.6%, SOCmean 43.3%, Battery Charging/Discharging energy 3733 kWh (6799 kWh eff. array energy, 54.9% stored, 45.1% direct use), SF = 0.915
3.2 kWp -> SOWCycl 93.9%, SOCmean 33.9%, Battery Charging/Discharging energy 3070 kWh (7611 kWh eff. array energy, 56.4% stored, 43.6% direct use), SF = 0.728
=> for the same given yearly load, and with the same battery size, the bigger the PVarray the higher the part of the energy transiting through the battery (not sure I understand why that is btw, especially between the 8 and 6.4 kWp, the part of direct use decreasing as we increase the Pnom...) and thus the more wear in the battery.
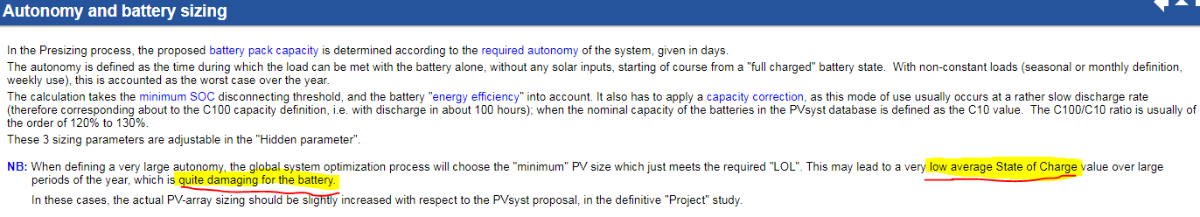
I guess where I'm coming from is this part of the Help telling us that a low average State of Charge could be damaging for the battery (snapshot below). So in my mind, it was better to have a SOCmean of around 60% than one of 30%. Which is why I was totally surprised to see the opposite in the simulations, the lower the SOCmean, the less wear/damage I have on the battery... (SOCmean circa 30% -> SOWCycl 94% !)
It definitely feels quite contradictory.
-
@André MermoudSorry to raise this again, would you mind helping me regarding my post from the 12 May (where I compare different tracker PV plants at different latitudes) ?
-
Good morning,
As I was designing a stand-alone system, I noticed a trend that I can't quite explain... regarding the dynamic ageing of the battery (wear-and-tear due to number of cycles).
I understand that, the deeper the DOD (Depth-Of-Discharge), the more degradation, as is explained in this section of the Help : https://www.pvsyst.com/help/battery_ageing.htm
However, I noticed in my simulations, that I was getting the opposite. The more I had a system with a high SOCmean (battery around 60-100% most of the time) the more I had dynamic wear (SOWCycl around 89%), and the opposite is true: in a system with deep DOD (SOC around 20-30-40% most of the time), my dynamic wear is much better (SOWCycl around 94%). I can't really explain it... Please find details about the said simulations below:
Site: Dakar, Orientation: 35° tilt (optimized for winter), User's Needs: Load a CSV file, Household_BDEW template, re-scaled to 7000 kWh/year
Battery set: Sonnenschein 12V 190Ah Pb Sealed Gel Solar S12/230A, PV module: SunPower 400W 55V SPR-MAX-400, Universal Controller Direct Coupling
Case 01 -> Autonomy 3.4 days: 4x10=40 batteries, 1900Ah ; PV array oversized on purpose to illustrate the issue: 16 modules 6.4kWp
Case 02 -> same system but with much smaller array of 8 modules, 3.2 kWp (and deeper DOD as a result)
Case 03: without going to the extreme, a medium-sized 4kWp array, gives us SOWCycl 92.6% and SOCmean 43.3%
6.4 kWp -> SOWCycl 89.1%, SOCmean 82.3%
4.0 kWp -> SOWCycl 92.6%, SOCmean 43.3%
3.2 kWp -> SOWCycl 93.9%, SOCmean 33.9%
As you can see, we have less wear on the battery when the DOD is deeper... I don't understand this. Would you mind helping me figure out what's going on?
Thanks so much,
Julien
-
Good morning,
I was checking the DEMO stand alone project (Dakar, 2.2 kWh/day, 600 Wp variant), and I can't quite understand why we get an EffBatI and EffBatE greater than 100% on some months... Would you mind explaining this to me? See snapshot below
-
Hello,
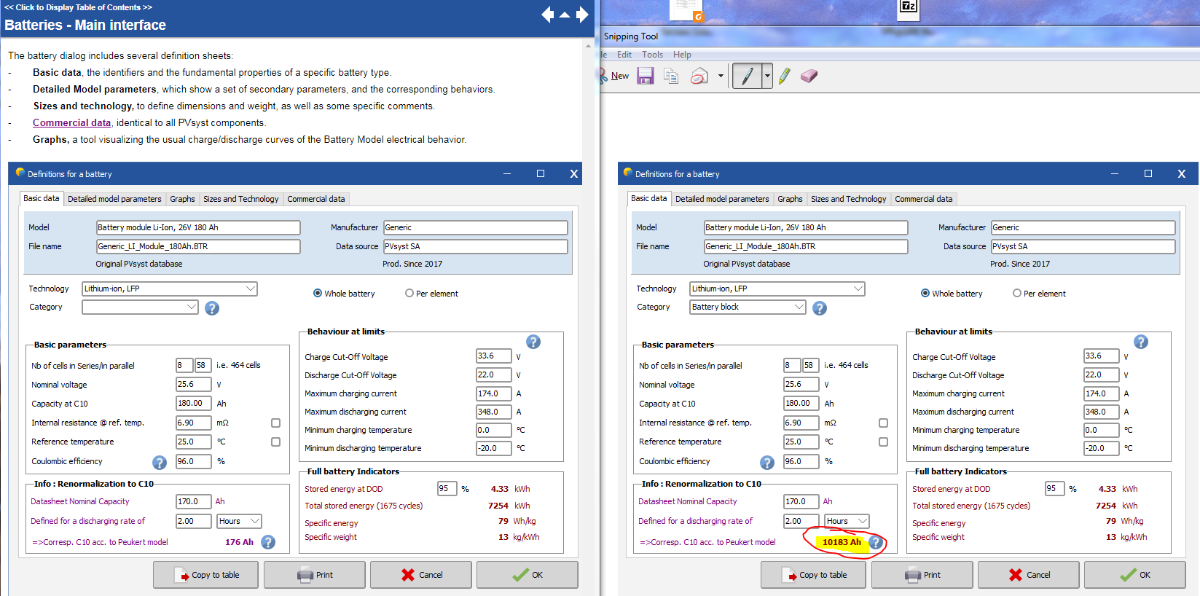
I am currently studying storage systems and the battery component in PVsyst.
Based on the example in the Help, I opened the same battery component, and I'm surprised to see that the calculated C10 according to Peukert model is completely off (10183 Ah, instead of 176 Ah). I checked other battery components, and they're all the same, their "C10 acc. to Peukert" is way higher than it should be.
-
Thanks, yes, that's I did :)
I was just surprised that such a popular manufacturer, if not the most popular, hadn't had any update for almost 12 years, in the most popular PV design software.
It's surprising they (SMA) haven't requested it. Thanks anyway! :)
-
Good day,
It seems that the SMA string inverters under 10kW haven't been updated for a long time (Sunny Boys TL-21, from 2010, etc)
All the new models (Sunny Boy 1.5, 2.0, 2.5 -VL-40, and Sunny Boy 3.0 ... 6.0 -AV-41, and Sunny Tripower 3.0 ... 6.0 -AV-40) have very different MPP tension ranges and efficiency curves, and dimensions than the older versions.
Any reason for this? or any estimate when these models will be incorporated in the database?
Thanks so much in advance
-
Good morning,
I have a system with 6x modules, each with an Enphase micro-inverter. I am aware of the fact that micro-inverters tend to increase the AC losses (mentioned in this post: https://forum.pvsyst.com/topic/1929-what-can-i-gain-with-micro-inverters/)
- First, maybe a suggestion, it would be nice to have the Mismatch Losses automatically down to 0% when selecting micro-inverters (or to zero when ticking the Default option), just like it does when selecting power optimizers, and perhaps also the DC losses down to zero or close to zero.
- But mainly, I want to know how I can estimate my AC losses with micro-inverters. It doesn't seem the tool in Detailed Losses is correct in that case. Example below:
I have 6x modules 500Wc. Now, obviously with micro-inverters, each module is in parallel with the other (each module being a individual string) and a single AC cable (with 230Vac) goes along all modules, and each module adds up its current to it -> at the end the AC losses should consider the total current in that AC cable. What it does instead is consider each inverter with its own cable separately. See the screenshot below. You can see that the estimated power in each "inverter to injection" cable is 0.48 kW, the power of a single module. Where in reality, all inverters/modules connect to a single AC cable, which thus carries more current and suffers from higher losses than if it was 6 cables with a smaller current => how can we estimate correctly the AC losses in that situation ?
Thanks a lot for the help.
Julien


Use case : Complex PVsyst scene
in Shadings and tracking
Posted
Good day,
While learning more about the "Near shadings: Orientations", I would very much like to get some practice on complex terrain cases. In the Help, we see a very interesting example titled "Use case : Complex PVsyst scene"
-> is there a way to get hold of the modelled scene in there? So we can do the case ourselves too. I couldn't find it in the templates, neither in Sketchup 3D Warehouse. That would be amazing to have this scene.
Or perhaps even just the XYZ .csv file, for the terrain ?
Thank you so much to anyone in advance :)