All Activity
- Today
-

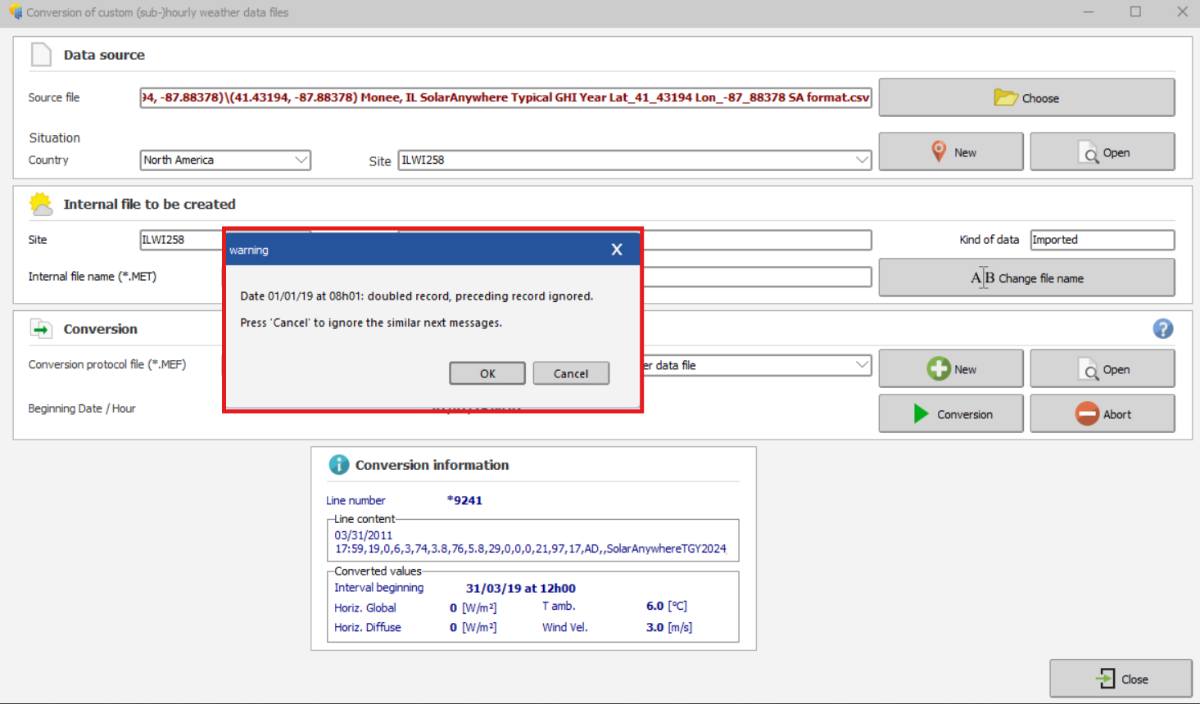
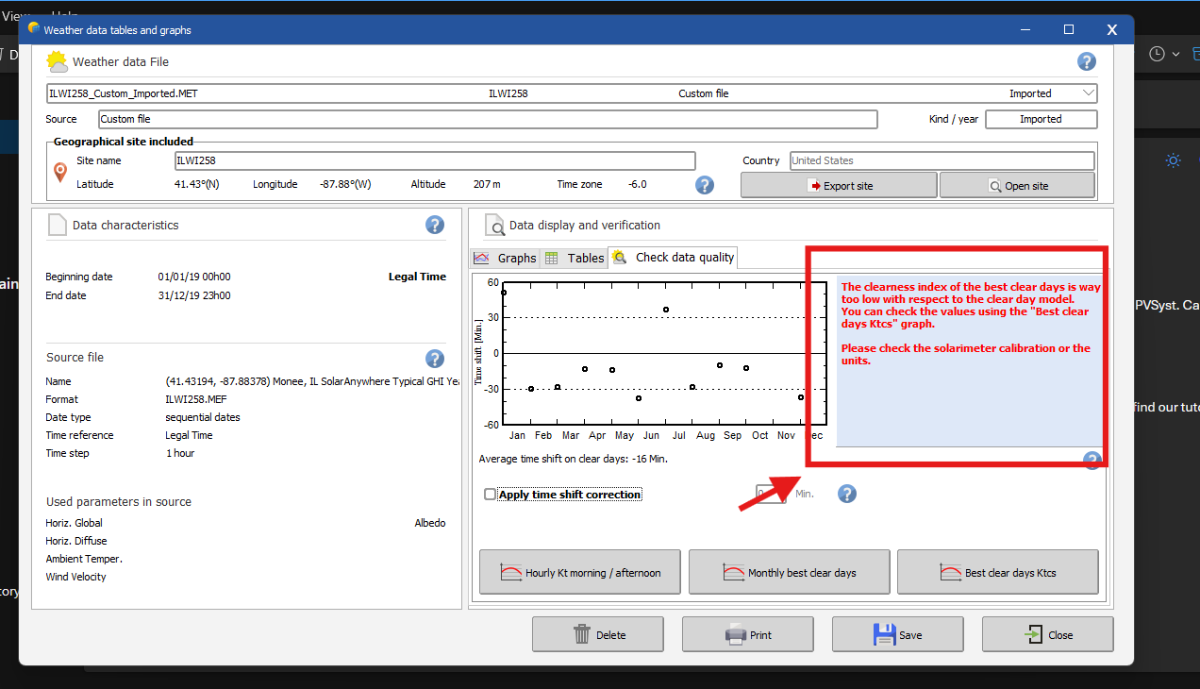
How can I import a quarter-hourly meteo file into PVsyst?
Linda Thoren replied to Nihal Meena's topic in How-to
Hi, Indeed the custom import process can be a bit tricky. In the upcoming release of version 8.1, we will introduce a new assistant to help guide users more easily through the construction of the .MEF file. When importing sub-hourly data, please ensure that the time step is correctly set to 1 minute rather than the default 60 minutes. The warning message you received indicates that the imported irradiance values are very low compared to the site’s clear-sky model. Is the site correctly defined? If you are importing measured data, it may also be worth checking whether the solarimeter requires calibration or whether the units have been properly specified. Feel free to send us your site and CSV file at support@pvsyst.com so we can take a closer look. Kind regards, -

What does the white part of the Iso Shading Diagram representing?
Muhammed Sarikaya replied to PVsystUser's topic in How-to
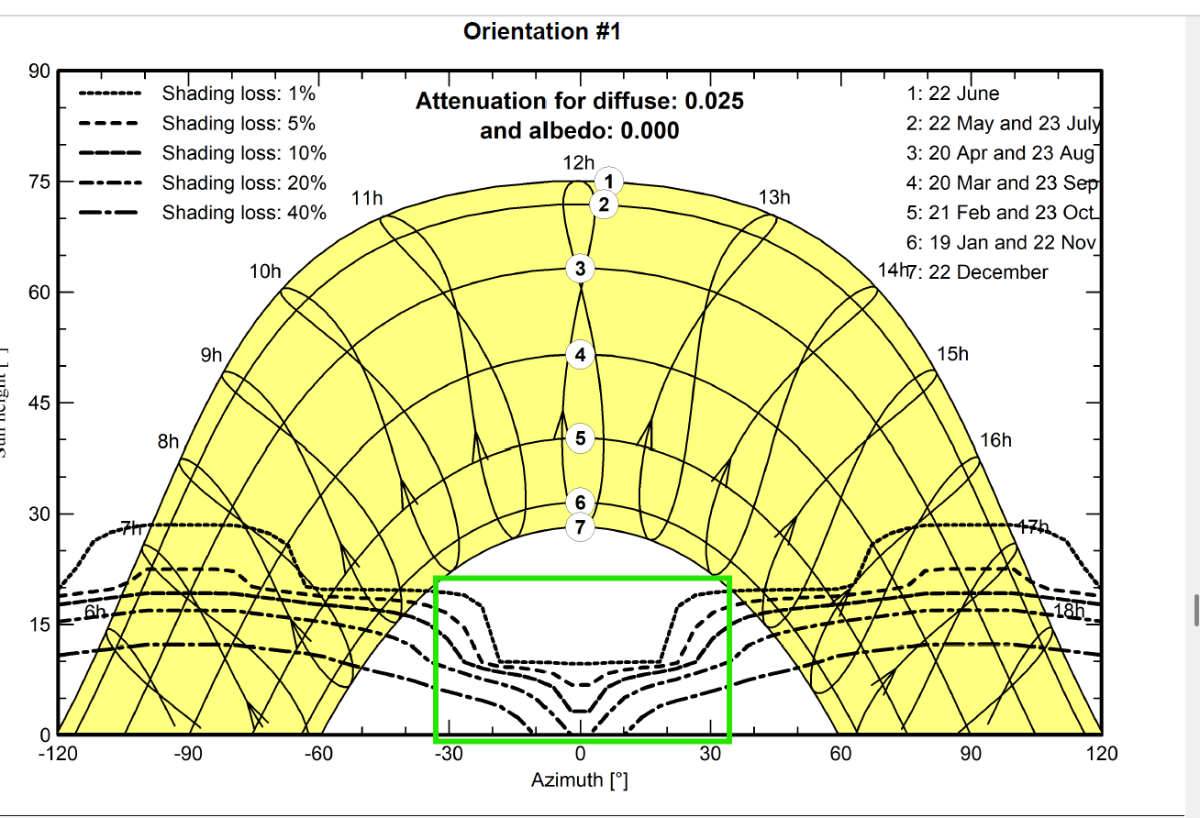
Dear, The multiple curves visible comes directly from the shading factor table. See the help related: https://www.pvsyst.com/help/project-design/shadings/calculation-and-model/iso-shading-diagram.html This table is computed on a fixed grid (20° azimuth / 10° height),when fast calculation is choosed, see the help: https://www.pvsyst.com/help/glossary/shadings/shading-factor-table.html?h=table+fa And PVsyst always displays the isolines resulting from this calculation. However, the solar path never enters this region of the diagram that your show in green rectangle. Therefore, even though the iso-shading curves appear there, they do not correspond to any real shading situation. They are simply the graphical projection of the table-factor values in an area of the sun-position diagram that is never reached by the actual sun path. Only where the iso-shading lines intersect the solar trajectories can real beam shading occur. Regards, -
For loading the 1-minute data into PVSyst Version 8, a specific .MEF file format is needed. Can you help me in doing this because I am getting the different errors? Please do not recommend the help page i already go through the page. Can you also gave me the email so that I can share the CSV file with you?

- Yesterday
-
 Please see the green rectangle in the screenshot below. What do the shading lines that fall inside the green square represent? That area is outside of sun path for the project's location; why they have a specific shape if they don't have any meaning?
-
 Farzam Shakiba joined the community
 -
In the 3D editor, please follow these steps: 1. 'Create -> Building/Composed Object' 2. Go to 'Add Object' and create the Handrail 3. After closing the 'Elementary shading object' window with the handrail, but still in the 'Building / Composed object' window, apply an azimuth of 90° to the handrail. 4. Now close the 'Building / Composed object' window, coming back to the main window of the 3D editor 5. If you now apply a tilt to the handrail, it will rotate like in the screen shot above.
- Last week
-
 Vijayaraj joined the community
 -
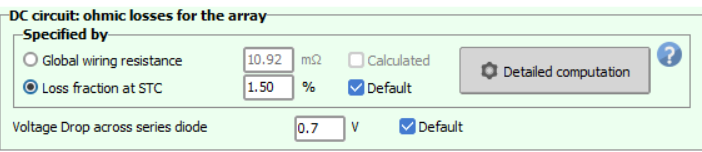
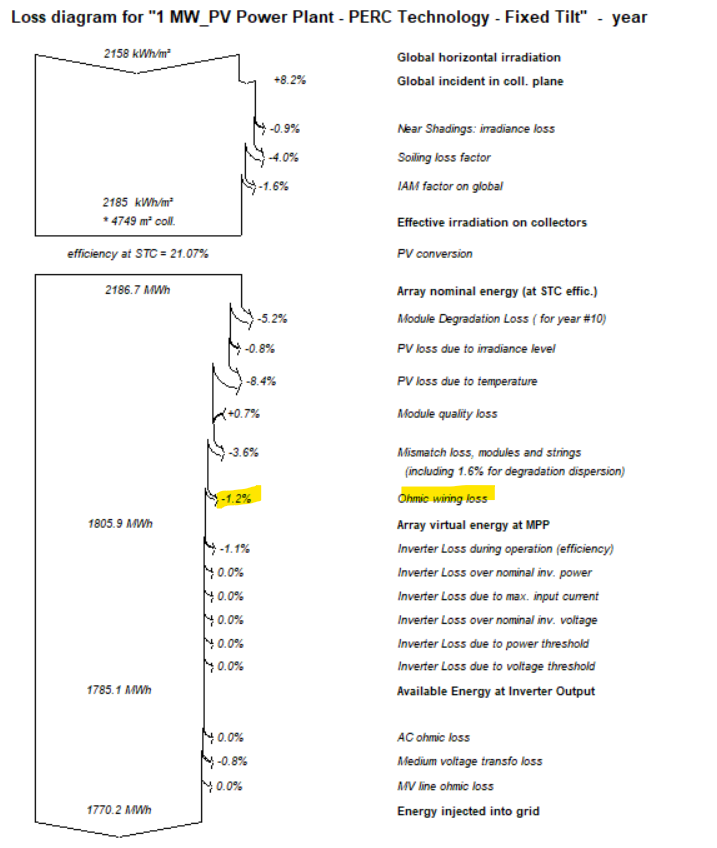
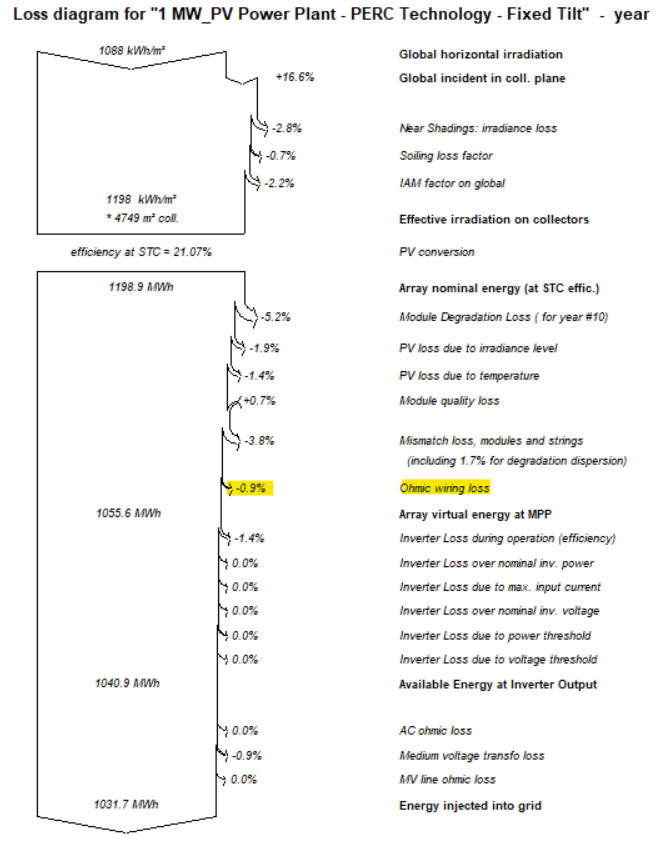
I have adjusted the DC ohmic losses as 1.5% as shown below for a typical PV power plant simulation in 2 different locations (Abu Dhabi & Berlin). However, the loss diagrams for both simulations shows 2 different values as below. Please clarify why the dc ohmic losses% in the loss diagram are different despite assuming the same losses (1.5%) considering identical setup. and provide details of the DC ohmic losses calculations method that leads to the percentages shown in the loss diagram.
-
 Deep patel joined the community
 -
 SAYA joined the community
 -
 l.bjarnason joined the community
 -
Dear Carlos, Today, with PVsyst version 8, you can mix any orientations you want. Regards,
-
 Toni Kent joined the community
 -
 woohyeon joined the community
 -
 ESM Bülent YAKUT joined the community
 -
Hello, In the current version you cannot do these manipulations directly in the single line diagram. In the following youtube tutorial you find more information about the single line diagram and the DC and AC cables : The losses in the DC and AC cables can be defined in the detailed losses window as discussed in the following forum posts:
-
 Vjc Trading joined the community
 -
Dear PVsyst team! Please tell me how to calculate losses in DC and AC cables ?
-
Is there a way to use mixed orientations with numbers different than #1 ad #2?
-
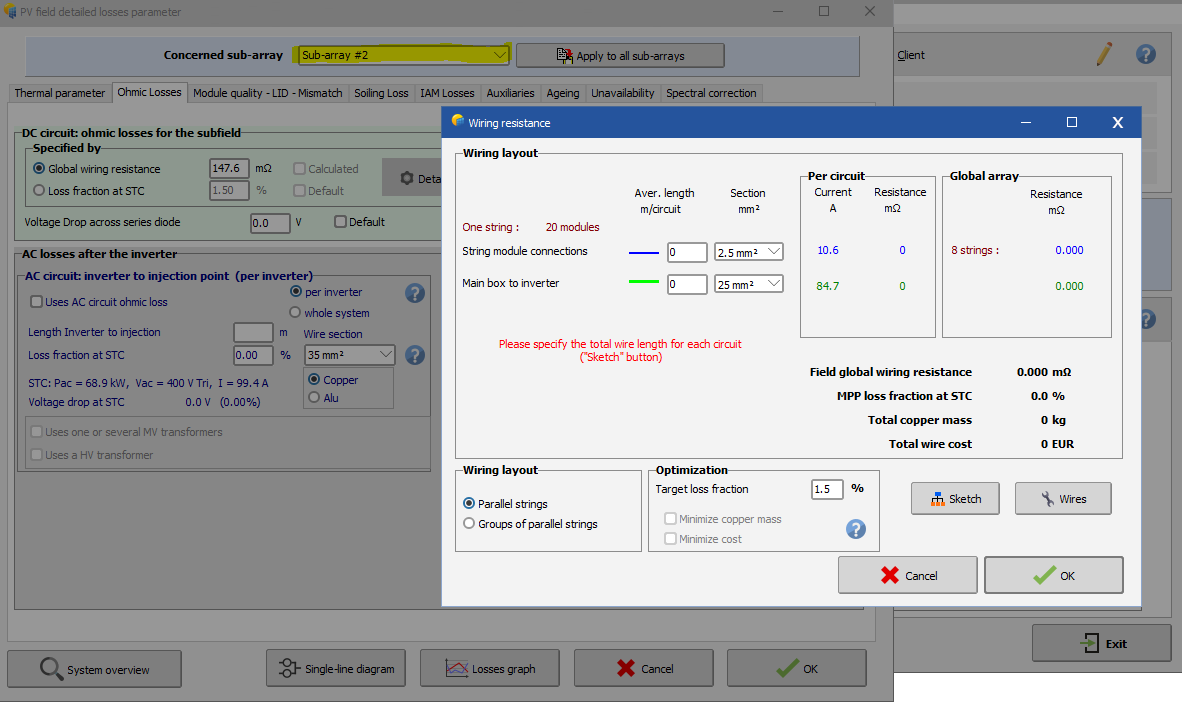
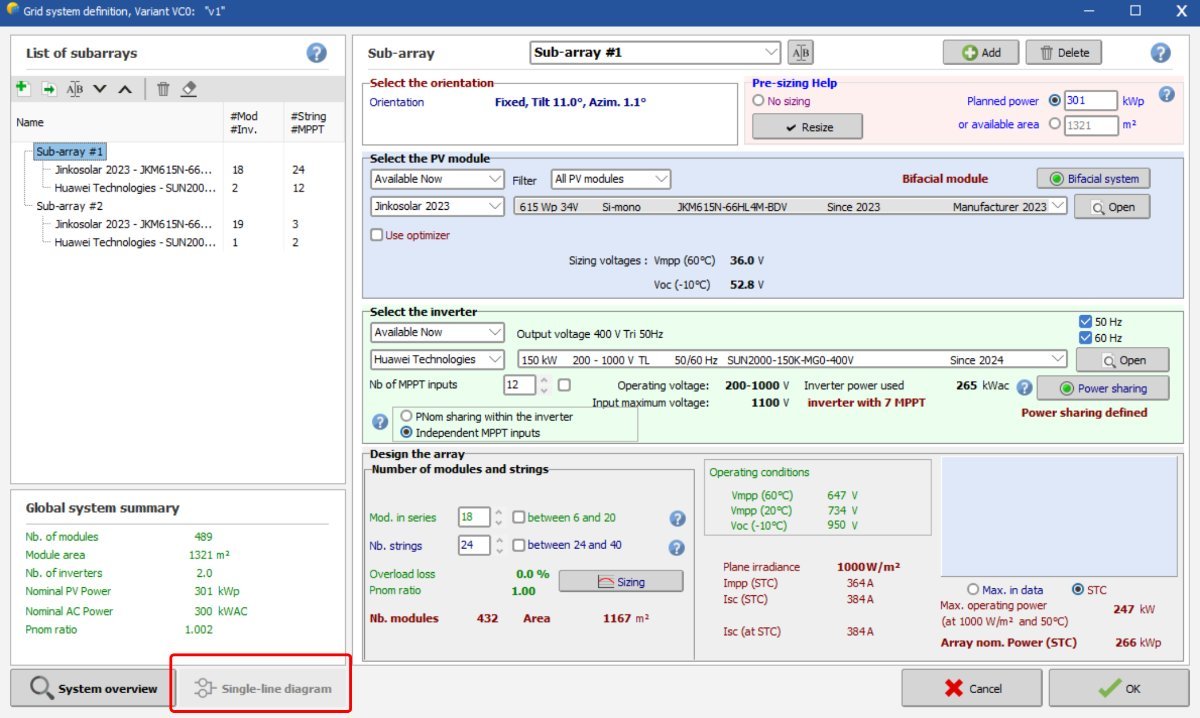
If you have multiple sub-arrays, you can define individual parameters for each sub-array by using the drop down list in the top of the window
-
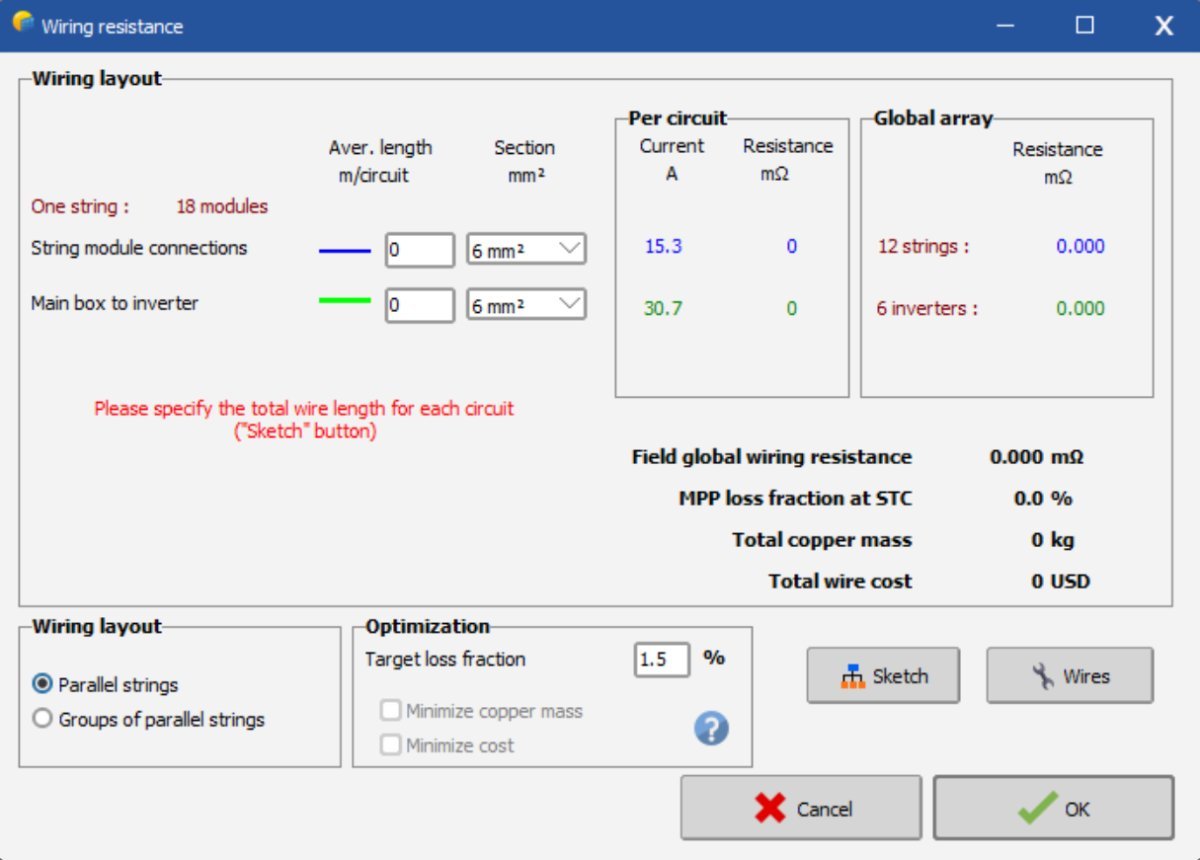
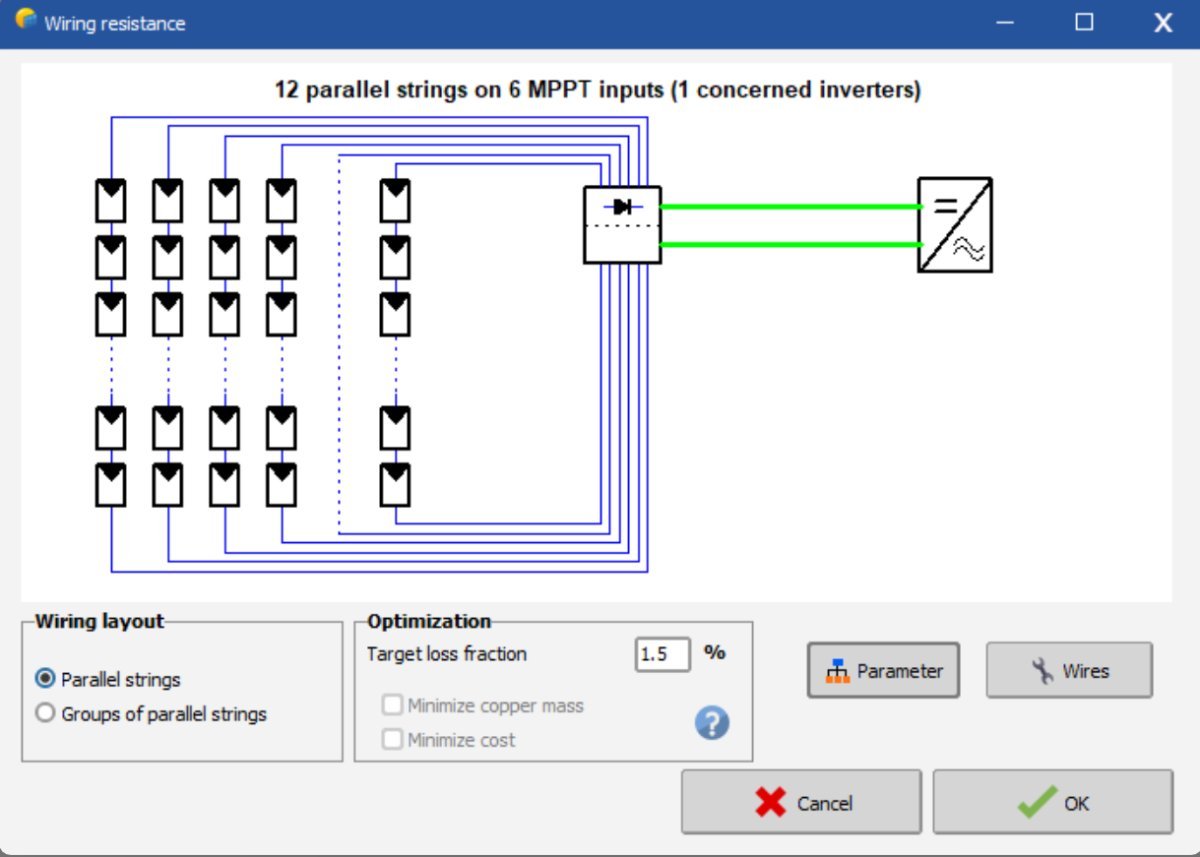
How can I enter the cable length for each line separately? My calculations show 12 lines for panel 18 and 2 lines for panel 19, but it doesn't show up here?
-
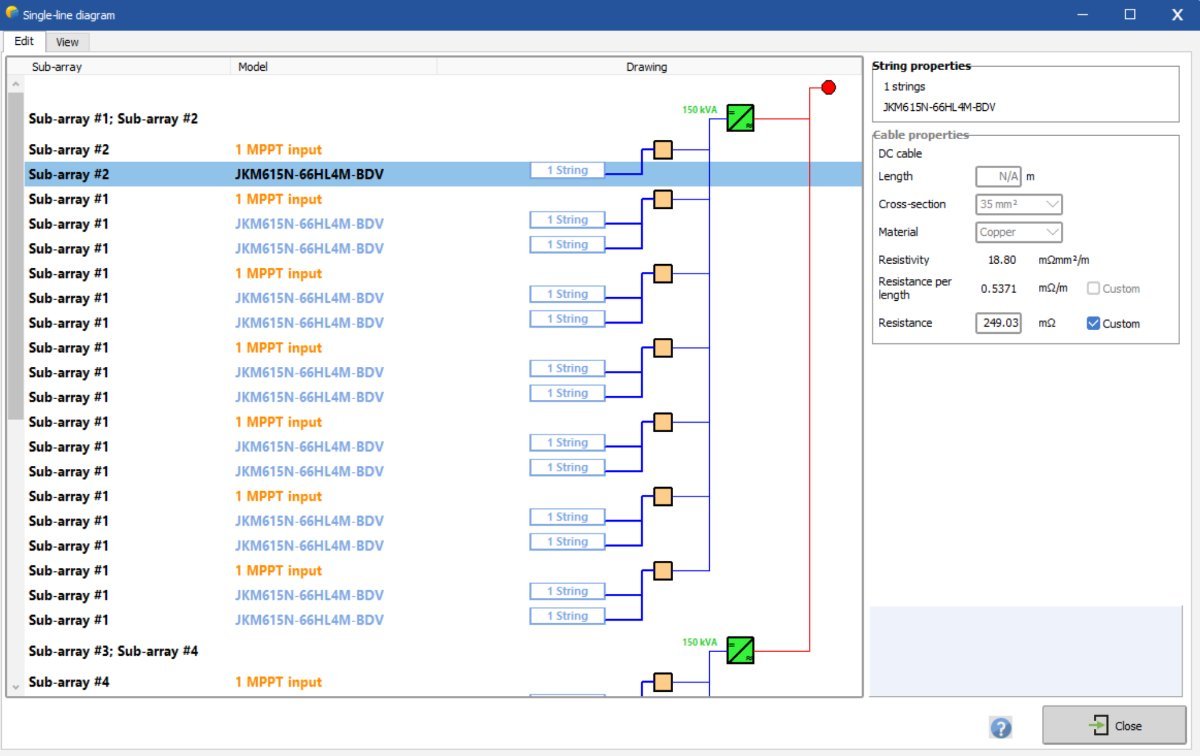
Now how can I enter the length and cross-section of the cable for each string? I can't enter values here, the cell is not lit.
-
For certain scenarios it is not yet implemented, such as for multi orientation daily sharing. In the case in your print screen it is probably because you do not have a multiple between the number of strings and MPPTs in the second sub-array. You should have an orange warning in that sub-array indicating this. You should here create an additional sub-array for the strings of 19 modules, one sub-array with 2 strings and 1 MPPT and a second with 1 string and 1 MPPT. This is further explained in the following youtube video:
-
Hello, This can be done in the detailed losses window, Ohmic losses tab.
-
Why sometimes my SLD doesn't light up even though there are no errors in the system?
-
Good day everyone! How can I enter data to calculate cable losses?
-
 Getting high quality irradiance measurements in the field can be difficult and the two main sources of errors we see from our users are: Shaded sensors, especially for trackers. This can be identified by comparing your data to clearsky expectation on good weather day, and looking for unexpected decreases. The pattern should repeat from one day to the next. Sensor misalignments, either in azimuth or tilt (or both). Even small discrepancies have an impact. If you can easily download POA irradiance from solargis, chose a clear day and download data for several azimuth and tilt values around your expected geometry. Then check if one of the alternative geometries fits your measured data better. If your sensor is misaligned, you can still use the data in PVsyst as we first decompose POA irradiance into GHI and DHI. You just have to use the real tilt and azimut when importing data.
 - Earlier
-
 Dear all, I am reaching out whoever can help me with this topic. For several projects for which I am assessing the meteo data, there has been a potential misalignment between the on-site plane of array irradiation data registered by sensors (such as pyranometers or solarimeters) and Solargis satellite data. For this reason, I am questioning whether such occurrence has ever been encountered by someone else and if so, what has been the take-away. I am open to discussion on this topic. Thank you and best regards, Vinh
 -

Decomposition and transposition models
James Barry replied to dina.christensen.martinsen's topic in Meteo data
I would like to emphasize the point that in fact Erbs can lead to bias even on hourly time scales! I recently came across this again using diffuse data from DIRINDEX and comparing it to Erbs, i.e. standard PVsyst decomposition. In the winter months in this particular location the Erbs model led to a bias in the monthly sum of diffuse irradiance of between 10% and 18%, i.e. Erbs massively overestimated the diffuse fraction. So it is not only applicable to sub-hourly data. -

Real near shadings based in drone import
Stéphane replied to Carlos Arredondo's topic in Shadings and tracking
Dear Carlos, We don't have any specific procedures or instructions regarding existing plants. If PVC format is not available, DAE or 3DS can be used. Then on the import screen you can select the "material" that is used for your trackers and you can define the tracking parameters there. Also for the terrain, you can select its material and PVsyst will import it as a ground object. Here is the link of our help page for importing 3D file, where you will find more details: https://www.pvsyst.com/help/project-design/shadings/near-shadings-import/sketchup-and-other-cad-software.html#scene-details -
Dear Pattarporn, don't hesitate to email us your project at support@pvsyst.com so that we can replicate the issues and try to help you.
-
This looks like an AI bot or something...
-
Hi, I usually build the 3D scene for new ground mounted projects using a commercially available tool that exports the layout as PVC file and direct imports into PVsyst 3Dscene. this is very fast and useful for trackers. but now I want to evaluate the near shadings of an existing plant (with trackers) with the drone scan and Metashape postprocessing. How do I "assign" the tracker characteristic's to the imported object? is there a preferred file format for pv objects, shading objects and terrain? is there a recommended procedure for this real 3d Scene mounting on PVsyst? is there a recommended software or tool?
-
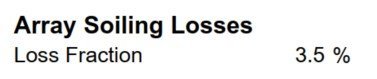
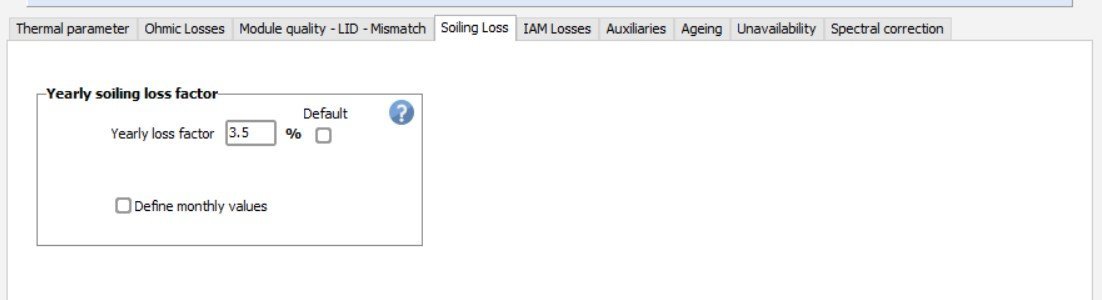
Hello, I have run PVsyst 8.0.15 for one project, a Solar Rooftop, and encountered the following issues: Running PVsyst with 3D or Near Shading enabled takes approximately 1 hour and 30 minutes, even though the 3D model does not contain any complex structures. I have therefore set it to run in Fast mode. How can this issue be resolved? In the Detail Loss section, I set the Soiling Loss to 3.5%, and the report correctly shows 3.5%. However, in the Loss Diagram, it displays as 3.25%. How can this discrepancy be corrected? Since I ran the 3D simulation, and the site is expected to have significant shading based on the site survey, I was surprised to find that the Near Shading loss is displayed as a positive value in PVsyst. How can this occur, and is there a way to adjust the settings so that the value appears as negative?