All Activity
- Today
-
 AngyBG joined the community
 -
 When testing a few items for an internal standard about bifaciality I noticed the following item. Example project has a 3 portrait table with a 1m gap at the bottom and a 20 cm gap at the top. Basically when you have an east west system and you follow the pitch from the design it showcases the following: https://i.gyazo.com/4194337c998195b65b7d92bf96de2adb.png It looks like it keeps the entire space free instead of showcasing the other modules which will block the light from reaching the ground. This becomes apparent when you see the kWh/m² that gets produced extra. https://i.gyazo.com/70699f6dd7df697417825ba81073e433.pnghttps://i.gyazo.com/35ea7a63767ddf32e9e28ebc773525ca.png I solved it for now by giving it an interrow spacing of 1m to more accurately showcase the ground yield, even in this case it seems to be higher than that of a normal ground project.
 -
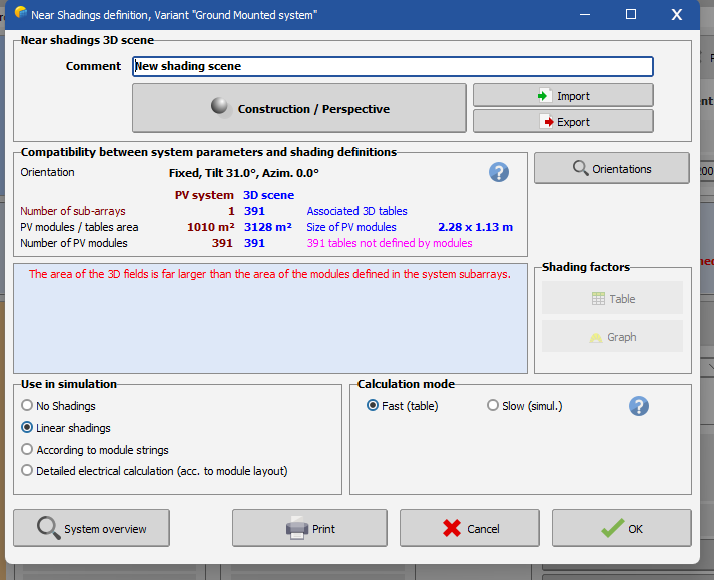
 Dear RahSolar, Can you please send us your project along with the 3D scene you are using to support@pvsyst.com so we can better understand the issue? I suspect that you are using a 3D file with a larger PV area than what you declared in the system window of the software. Regards,
 -
 Hi, For hourly estimation of both the production and the specific losses, you can export an Output File with any relevant parameters through the Advanced simulation window. From the hourly/daily values generated, you can do any analysis in an external tool such as excel.
-
 Fatima6 joined the community
 -
 @Pete if you can send the zipped project (Export button in the project window) as well as your result tables (including the batch results file if you used the batch) to the email address support@pvsyst.com As usual with these investigations, comparing intermediate variables and not just the final energy gives good results in pinpointing the main effect. If ShdDLss is not the issue, then we should look at other variables before and after this point, to see if the energy increase is due to a specific loss or gain along the loss tree.
 - Last week
-
 Hi again and thank you for your answer. I am still trying to figure out if there is a way to analyze the impact through the year of the shadow casting of the wind turbines. Like in my mind this are the steps I would follow: get the exported data on hourly basis for a year from the loss diagram, taking into account the %loss of near shading loss and electrical shading loss -> is it right? or should I take into account other losses for the shadings of the wind turbines? try to find a way to correlate the losses from the loss diagram through the year. Is there a study/methodology? For example, during Winter solstice I would have a bigger impact of shadows, so what fraction of the yearly near shading and electrical shading should I apply? and so through the year, on a monthly basis, how can I find the fraction of those year losses to be applied each month?
 -
Cannot get custom tracker to save in v8.0.12. Once shade scene is exited, it remains all trackers.
-
 Change this under advanced settings. I suspect there might be something else going on, but here is how to override the error.
 -
If by inputs you mean inputs which are supported by PVsystCLI, then it will be technically possible. And if it is an internal tool only, then it would respect the legal frame. Please have a look at the PVsystCLI documentation to check what can be done with the tool.
-
Our team is developing a tool for solar plant feasibility study which requires an automated interface with PVsyst by which means like, if i feed the required inputs through my API, PVsyst should automatically consider those inputs and run to provide the result.
-
Hi, There is no specific tool to estimate the tracker tracking error. By conducting a P50-P90 evaluation you can possibly add an additional uncertainty to take into account such errors.
-
 Yes of course. If you don't check this option, there will not be any losses due to the HV transformer, nor the line after this transformer.
 -
 vallary joined the community
 -
 KKYOON joined the community
 -
Hello, Can you tell me what version of PVsyst you are using ? As a workaround for site creation you can still use OpenStreetMap, option is available in Options> Preferences > Running. Regards, Laurent
-
 Samar joined the community
 -
 Rebero Fabius joined the community
 -
 Mary123 joined the community
 -
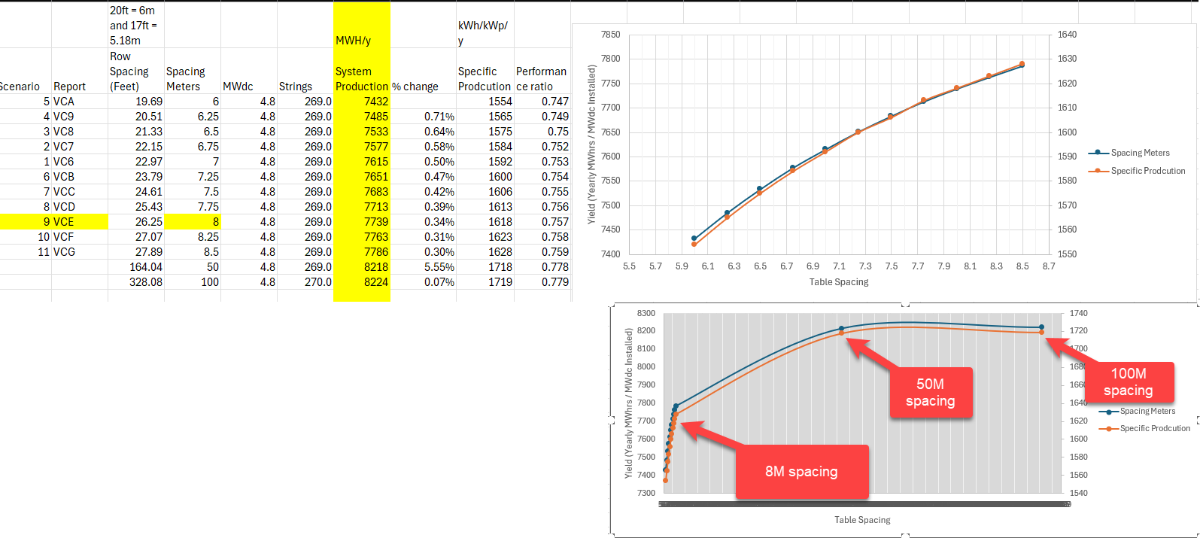
 I fully expected energy to plateau as you mention dtarin. Perhaps my variant comparison above was confusing- so I have added some annotations below to help better explain my concern. At 50M, there should be very minimal row-row shading with of course the exception in the early / late parts of the day. To your point, we should not see an appreciable yearly energy increase. This "plateau does not occur until roughly 50m. @Michele Oliosi I did add the suggested shading loss to the 8760 data and plotted in excel. I do not see a significant change here. I can share my model - can you suggest a method for file sharing?
-
 dkxzzz joined the community
 -
 We are witnessing error in tracker angular movement. For example, at a specific time, tracker is supposed to be at an angle θ, tracker is actually at an angle of θ+/- 5Deg. Is it possible to do PVSyst simulation with tracker rotating angle error of +/-5deg to check generation loss due to tracker tracking angle error
 -
 Backiyaraj joined the community
 -
 I'm unable to solve this error even though I have the same number of PV modules both in my system as well as in my 3D scene. Please advice.
-
Inverter output power by .OND file
André Mermoud replied to Andrés Fernández's topic in PV Components
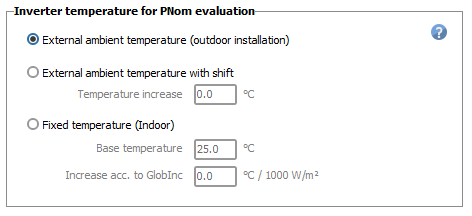
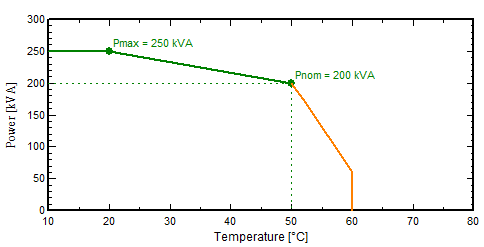
When you have a nominal power, defined up to a given temperature, say 50°C, and an enhancced maximum power up to lower specified temperature, say 20°C, the simulation will use the curve shown in the inverter's definition dialog, page "Output parameters": The inverter temperature to be used during the simulation is defined in the "Energy management" dialog: Now the efficiency curve is specified by points at different powers, and interpolated between these points at each time step. If the actual power is over these points, the efficiency curve is simply extended linearly.
-
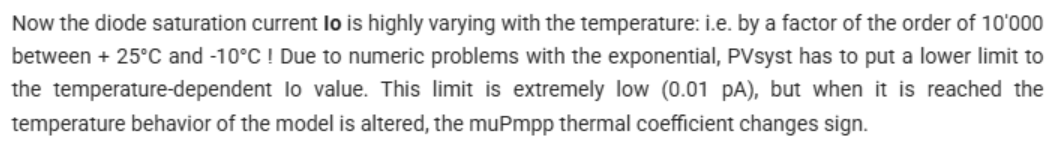
After posting this, I realized the documentation may be referring to the saturation current evaluated at the actual cell temp, rather than the reference value. Is that the case?
-
In PVsyst's documentation, it's stated that due to computational problems, PVsyst requires that the saturation current of a module at STC (I0_ref) be at least 0.01 pA, or 1e-14 A. However, after playing around with the single-diode parameters of modules in PVsyst, it seems like in reality the minimum saturation current of a module is 0.01 nA, or 1e-11 A. This is 1000 times greater than what is stated in the documentation. Is the value quoted in the documentation an error? Or is there something else going on here? Attached is a screenshot of the documentation text for reference.
-
If February 29th is missing from a leap year weather dataset, does it affect only that specific day, or does it impact the rest of the year as well? For example, when importing NSRDB weather data for 2020 (a leap year) into PVsyst, but excluding February 29th from the dataset: Does the PVsyst output for March 1st still correspond to the actual March 1st? Or does PVsyst treat the March 1st data from the file as February 29th, thereby shifting all subsequent days? Additionally, when running PVsyst for a specific year, does the software calculate the sun position based on that exact year (e.g., accounting for leap years), or is the sun position fixed for each calendar day regardless of the year?
-

PVSyst report with HV transformer and HV transmission line losses excluded
Aidenn replied to Aidenn's topic in Simulations
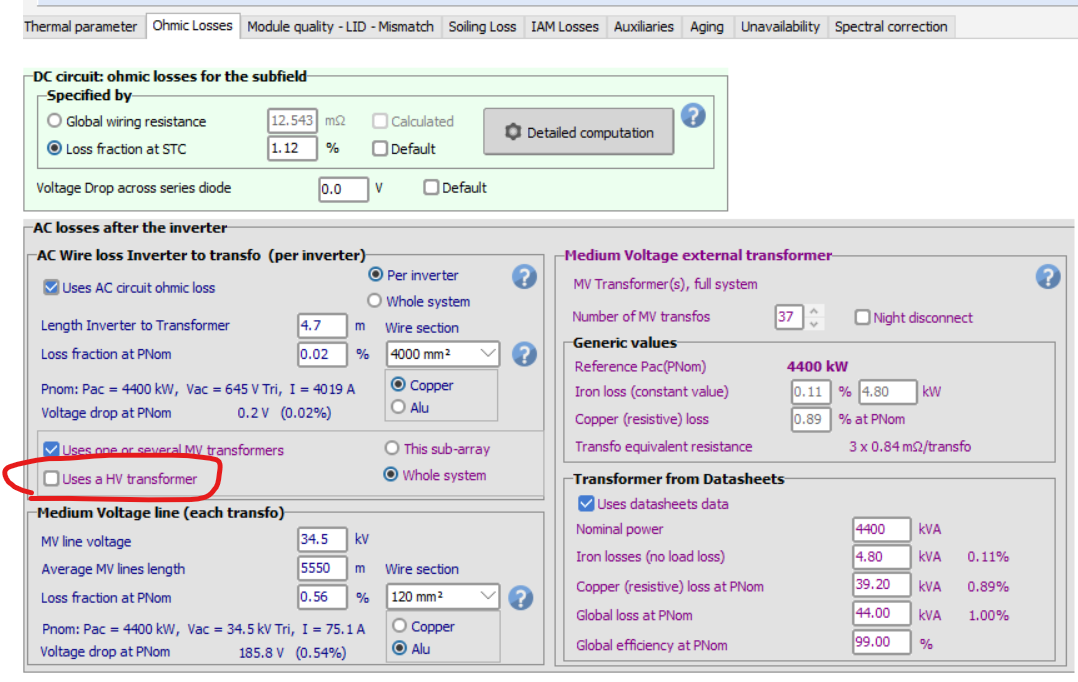
Hi Linda, There's already a PVSyst file with all inputs are present. The request is to generate another report to have HV losses excluded. Is unticking this box the correct way to exclude the HV losses? (see image below)
-
Hello, Per default there are no HV transformer or transmission losses included. You can define transformers in the detailed losses window, ohmic losses tab.
-
Hi, PVSyst report with HV transformer and HV transmission line losses excluded. How to do this?
-
the idea is the same for the limitation of maximum current per MPPT. The graphics in the system window is an approximation, not considering the backside production, though the simulation will.
-
Thank you. Now we have to wait for the answer of the inverter company 🙂
-
@Linda Thoren I clearly understand in terms of overload loss. However Inverter has limitation in terms of maximum current per MPPT and since the string sizing is only based on the front side Imp ,I guess the string distribution along MPPT has to be evaluated separately?