All Activity
- Past hour
-
Sorry, I really don't understand your strategy. It is not the battery (or the Ecoflow) which decides when it starts charging or discharging, but the external conditions (user's needs or PV availability). Starting discharging at a given SOC doesn't make sense without a clear definition of the energy demand. PVsyst controls the the charging or discharging "autorizations" as a function of the SOC evolution. If you are discharging (drawing energy), the battery will stop delivering power when the SOC reaches the specified threshold "Minimum discharging". When you are charging, PVsyst will disconnect the PV production when the SOC attains the specified "Maximum charging". This may arise within hours, You have a part of the hour in one state, and another part in the other state.
-
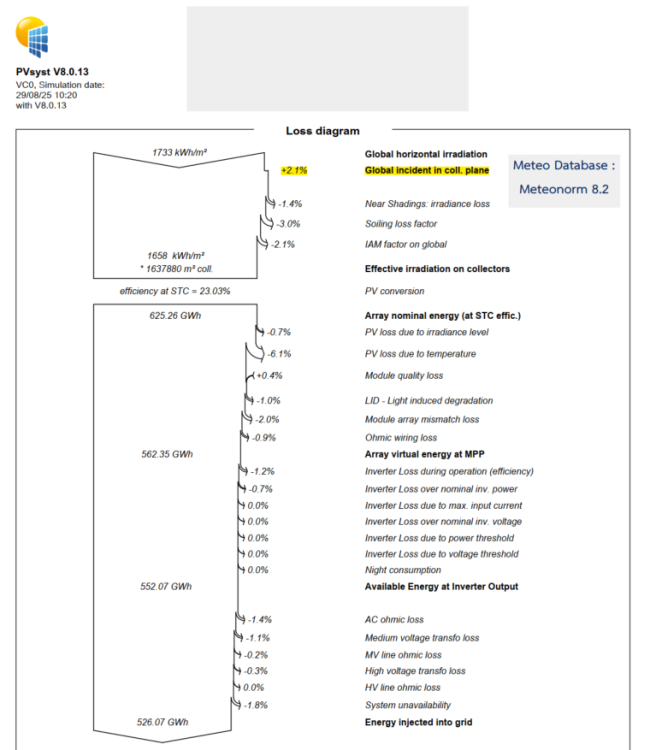
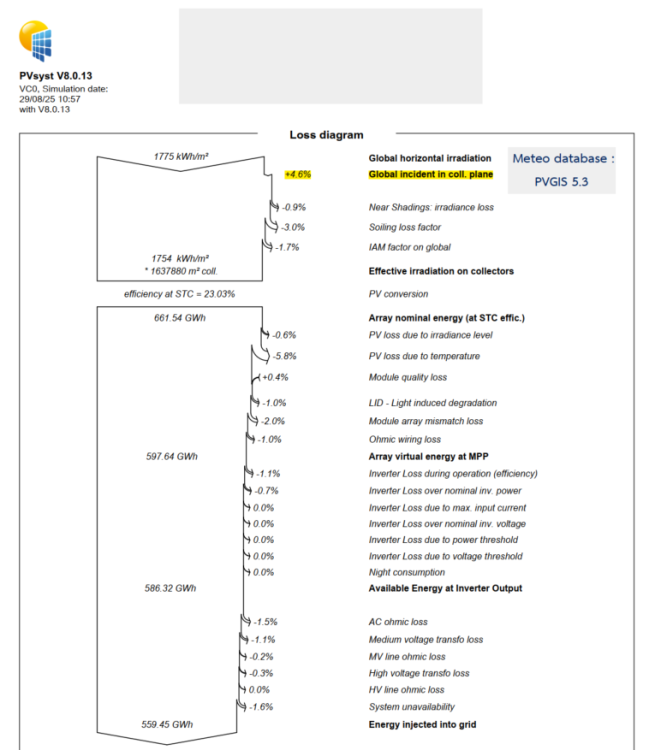
Hello, I have a question regarding the global incident in the collector plane loss diagram, where I noticed approximately a 2% difference between Meteonorm and PVGIS (due to the different meteorological databases). The same assumptions were applied in this project. Could you please clarify the possible causes of this difference? Additionally, I would appreciate your recommendation on which meteorological database is most commonly used in practice. Thank you for your support.
- Today
-
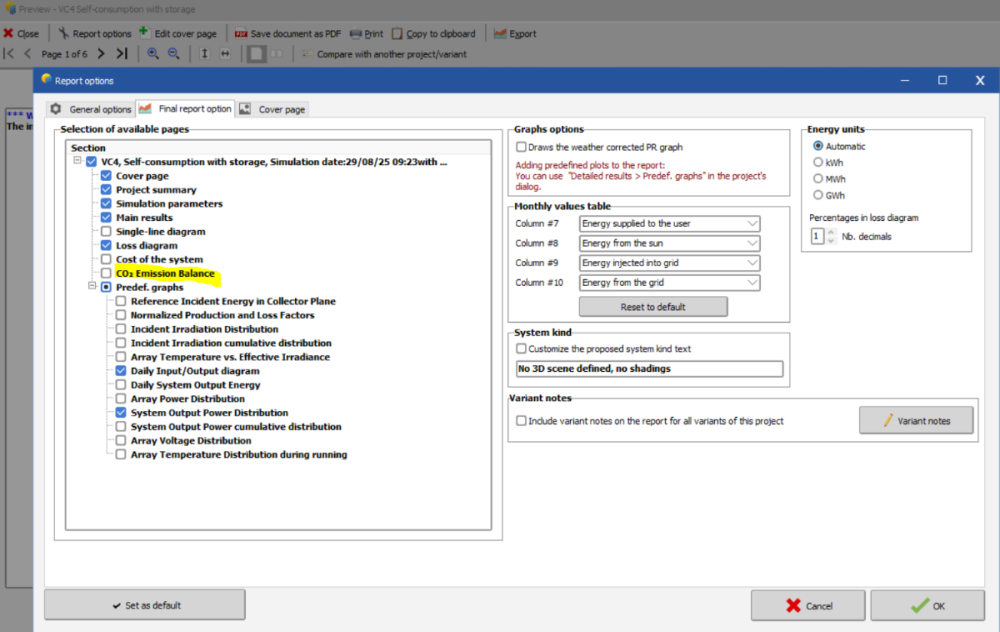
You find the carbon balance tool in the end of the economic evaluation window and you can choose to print the results in the report. In the report option, make sure the Co2 Emission Balance is enabled for the results to appear in the report.
-
Pakamas Teerasuwannajak joined the community
-

Sudden Load Profile Spikes After Importing File
Linda Thoren replied to Ady's topic in Problems / Bugs
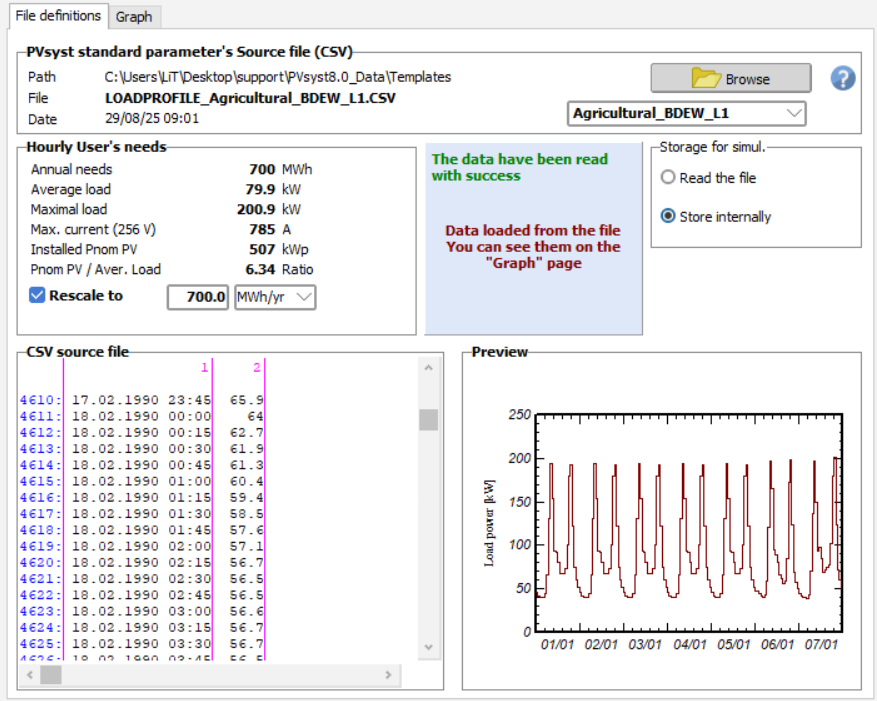
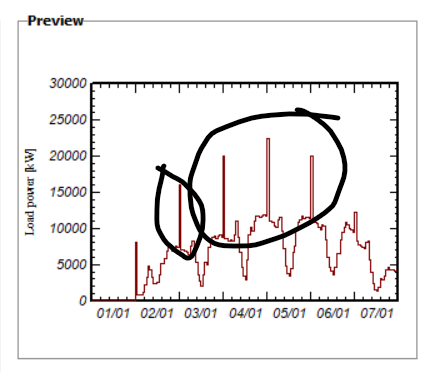
Hello, Does the peaks only appears in the preview graphics or is there in issue with the actual values in the input? Does the Annual need and the CSV source file to the left of the graphic correspond to the original file? You can possibly try to run a simulation and export the results to verify that the simulation is made with the correct values -
Where can I find out the carbon emission reduction value after modelling?
-
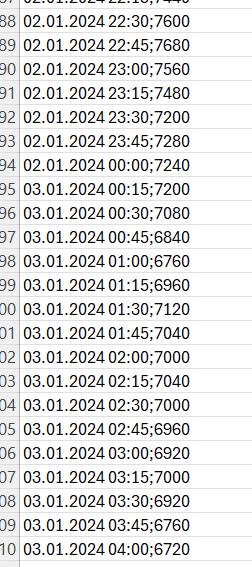
Hello, I defined a custom load profile as per the PVsyst template and imported it into PVsyst. However, after importing, I noticed some unexpected sudden spikes in the preview graph (screenshot attached, seem happen at 00 hour). The spikes do not exist in my original input file. They only appear after the file is loaded into PVsyst The rest of the profile seems to follow the expected trend. Could you kindly advise what might be causing this? Is it related to file formatting, delimiter issues, or data resolution mismatches? Are there any best practices to avoid such spikes during import? Any guidance would be greatly appreciated.
-
Steve Dean joined the community
- Yesterday
-
LauraH started following Options for variables in monthly values report table
-
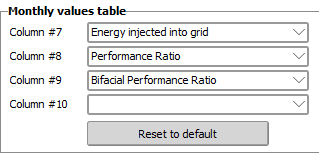
Hi, I noticed that the defaults for the variables shown in the monthly values table of PVsyst reports are now (v 8.0.15) as shown below. I would like to change these to our team's standard variables, but there's no option to show fewer variables. That is, a blank entry doesn't appear in the drop downs. Could we add that back? Thanks, Laura
-
Or one could use the standard "colorblind" color tables. Microsoft has implemented this in the Excel color defaults.
-
Representation of gaps along tracker when using PVcase scenes
LauraH replied to LauraH's topic in Shadings and tracking
Sure, that's how we handled the generic mismatch problem in the past, but it would be nice if it just worked, taking advantage of the CAD system including specific details. -
Hello André, Thanks for your response. I have a question regarding user consumption. The EcoFlow has an option to set thresholds for the battery to start charging and discharging (e.g., discharge when the battery reaches 80% of its capacity and recharge at 20%). Is it possible to model this behavior in PVsyst? I understand that consumption can be modeled on an hourly basis, but is there a way to represent it based on these charging thresholds instead? Also, please correct me if I am wrong, but I thought that if I don’t want to calculate battery sizing, it might be more appropriate to model my setup as grid-connected rather than standalone (since I am working with a fixed EcoFlow unit). Best regards, Zahra
-
Assuming that the statistics of the yield of a PVsyst are only influenced by the climate, as a first approximation, the PR will not change. This is because as a first approximation, the yield is proportional to the average irradiance (from which the climate variability is taken). However, at second order there will be other effects, that are too complicated to track down. Indeed, there is no definite definition of a P90 year useable for a simulation, only the statistical meaning that the yield should be better 90% of the times. I.e. you cannot exactly pinpoint whether this or that combination of entries in the time series has led to the reduction of the yield. However, since the very definition of P90 production also assumes a linear relation between irradiance and yield, it should be okay to consider the PR as constant.
- Last week
-
What is the method (formula) used in PVSyst to convert diffuse radiation in the horizontal plane (DiffHor) to diffuse radiation in the inclined plane(DifSInc)? When analyzing the simulation output files, I noticed that the DifSInc/DiffHor ratio varies between hours, which seems to be inconsistent with Liu & Jordan's isotropic sky model Best regards SunnyJohnny
-
How should the PR P90 be determined in PV energy yield assessments? Specifically, what considerations should be taken into account regarding climate variability? Should the variability of the solar resource affect both the numerator (delivered energy) and the denominator (theoretical energy), as it would in real measured PR calculations, or should it only affect the numerator, as some simulation methodologies assume?
-
Fabian.HOQ joined the community
-
Thank you for sending your project. However it doesn't show the same output as you have shown here: The message tells you that the maximum discharging power is highly undersized. Your load definition has many hours with a load demand of around 21.3 MW, including during night, and you limit the discharging power to 10 MW. When I specify 22 MW as a discharging power, as you did in your previous message, I don't see any error nor warning anymore.
-
André Mermoud started following ohmic losses - loss fraction at STC
-
The voltage drop of a PV array doesn't make much sense, as when the R*I² loss increases, the Pmpp will move on the I/V curve, and therefore the current will also be modified. PVsyst doesn't provide any guidelines for this difference between Power loss and Voltage drop, which depends on the I/V curve. We consider that the voltage drop is not defined, and of no interest in the case of I/V curves.
-
The EcoFlow is a grid-tied inverter, which can only be used (in PVsyst) in a grid-connected system. Now if you want to use it in a stand-alone system - which is probably more suited for your very special use - you should define it as a "Controller for Stand-alone" in the database. But the problem of the user's needs definition remains the same: you have to define it, whatever the way you are using the produced energy. The battery needs to "know" when it has to be charged or discharged.
-
jeremy.ligibell joined the community
-
dtarin started following Representation of gaps along tracker when using PVcase scenes and Electrical Mismatch Losses
-
Electrical shading loss has been around for a long time. It is likely the 7.2 report was run on linear shading, or the site was modeled perfectly flat with backtracking enabled and no shading objects present to cause electrical shading loss.
-

Representation of gaps along tracker when using PVcase scenes
dtarin replied to LauraH's topic in Shadings and tracking
You can change the settings for both types of messages. The shade scene module count has no impact on simulation results. -
OK,thanks
-
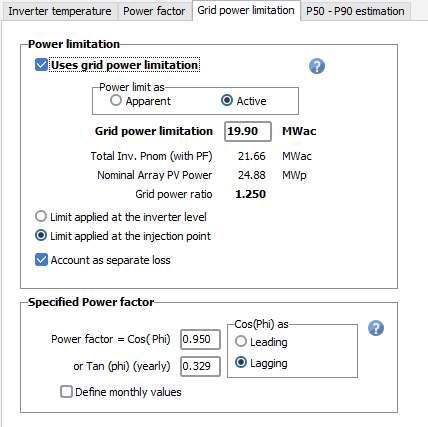
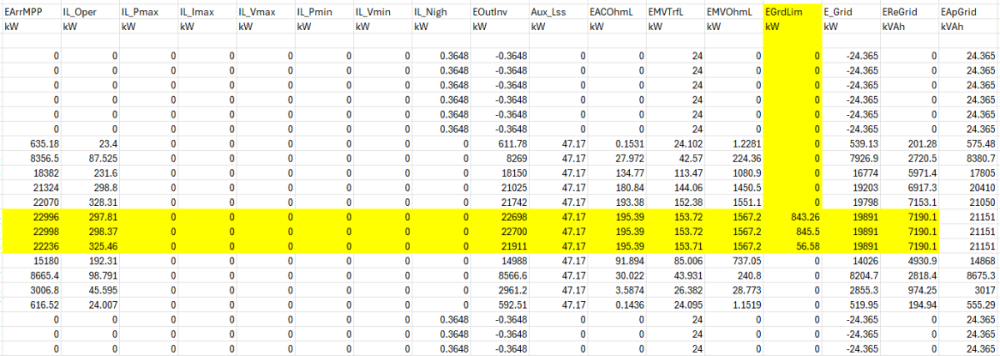
Hello, I have noticed a behavior when simulating a PV plant with an active power injection limit at POI. In the output CSV file, the power seems to start being limited slightly before reaching the configured threshold in the simulation settings. I am attaching a screenshot of both the CSV output and the configuration parameters for reference. Could you please clarify why this limitation is applied earlier than the set value? Is this an intended behavior in the model or is there a specific setting that I should adjust? Thank you for your support. Best regards,
-
LauraH started following Representation of gaps along tracker when using PVcase scenes
-
Hi, Whenever I read in a PVC file for a shading scene, the array area and number of modules shown by PVsyst don't match the array design. After some thought, it seems that the array size is being inflated by the size of various gaps along the tracker: gaps between modules, motor gaps, and potentially joint gaps. Is there any way to correct this? It causes error messages. Optimally, PVsyst would get this information from the PVC file.
-
Hello, I calculated the voltage drop of a string, and the resulting power loss was only 0.03% lower than the voltage drop. As you mentioned, the percentage of power loss tends to be slightly lower than the voltage drop. Is there a recommended guideline or acceptable range for this difference (for example, should it typically fall between 0.5% and 1% lower)? In my case, I obtained 1.49% voltage drop and 1.46% power loss. Kind regards,
-
DUARTE Jean-Marc joined the community
-
Hello André, Thank you for your response. As I mentioned, I used an EcoFlow unit in my setup, which includes both an inverter and a battery. I am planning to add a heater as the load. For clarification, do you think it is appropriate to model this system as grid-connected, even though it is not physically connected to the grid? Also, since the EcoFlow integrates the inverter and battery, what would be the recommended approach for modeling it? If it is OK to represent them as separate components, I would appreciate your guidance on the key technical parameters needed for an accurate simulation. Best regards, Zahra
-
N.Y. joined the community
-
kasemsin joined the community
-
Ana Sofía Lanza joined the community
-
Hello, Indeed there can be big discrepancies between databases. It is very difficult to estimate which one is the best suited for a given project or location, and what the probable error is. The following Help page provides comparisons of several databases across different sites: https://www.pvsyst.com/help/meteo-database/import-meteo-data/data-source-comparison.html?h=meteo+comparison#comparison-between-several-data-sources-for-different-continents
-
Hello, Does anyone know whether Meteonorm or SARAH3 is the most accurate database for France? Do you know of any scientific papers on this topic? Thank you in advance.


