All Activity
- Past hour
-
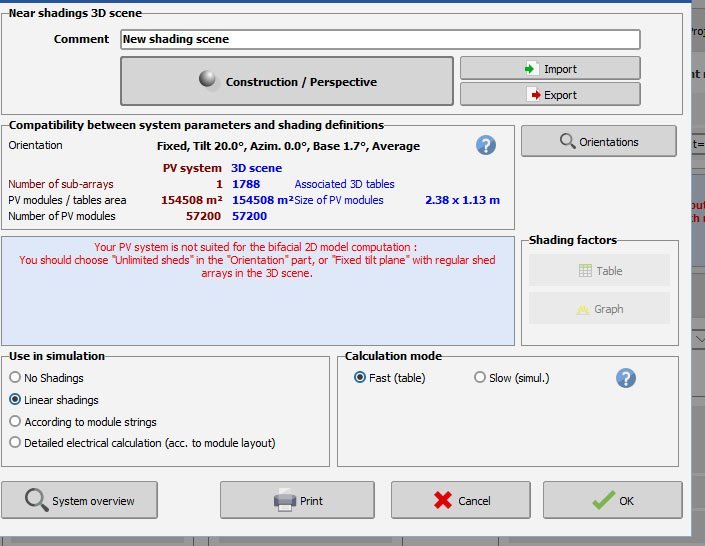
Hello, In version 8 you can create multiple field types in the orientations window and assign different bifacial parameters to different sub-systems. Thus, even if the tilt and azimuth are identical, create 2 orientations and assign each orientation to a sub-array in the system window, corresponding to the two sub-systems with different pitch in the 3D scene. You find a similar example in the DEMO tracking system Annecy, variant VC5: 2 fields of Trackers with different pitch Kind regards
-
Dear Nikoloz, In PVsyst Stand-alone, there’s no inverter component by design: the load (“User’s needs”) is defined as an energy demand (kWh), independent of whether the end-use is DC or AC. If you do have AC loads through a battery inverter, PVsyst’s recommended approach is to model it as an efficiency penalty. They also state the rationale: stand-alone (battery) inverters are fundamentally different from grid-tied PV inverters, so they’re not handled via the usual inverter database and are planned for a future implementation. Regards,
- Today
-
 NEILPD joined the community
 -
thanx alot but there is still one question. where to add an inverter >???? unversal controller is not inverter. there is n otion to choose ?..
-
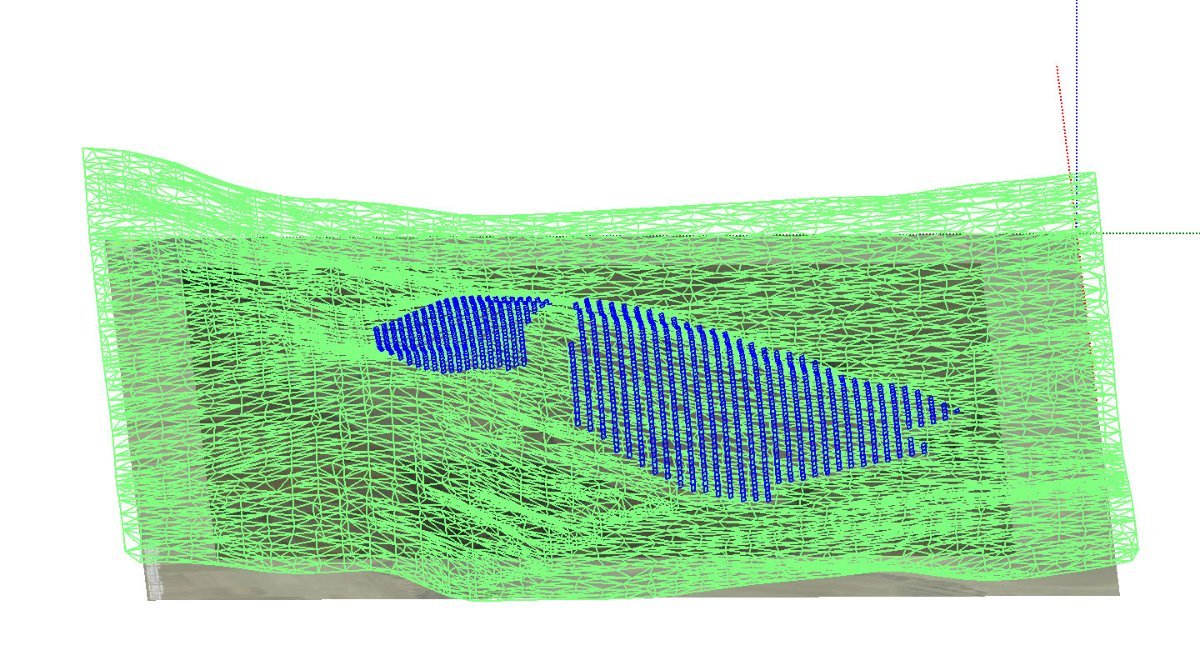
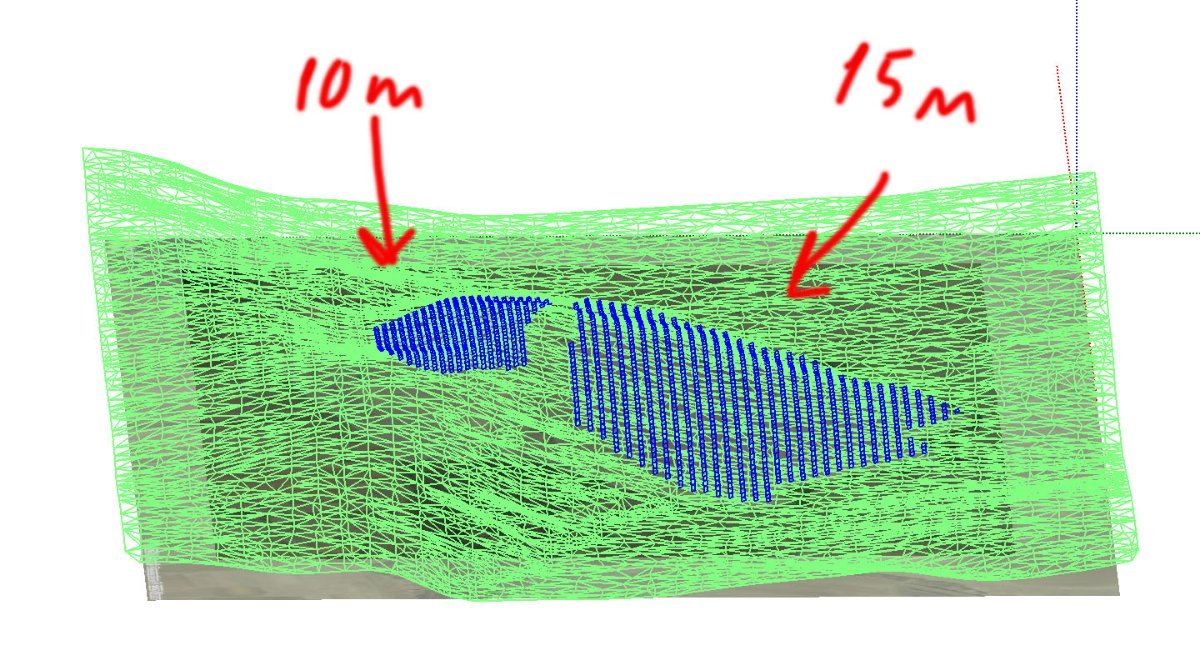
Hello there. I have serious problems with bifacial computation when I have different pitches in one procets ... is this bug or I am making something wrong ?????? I have project where part of panes are located on slope which needs to have 10 m pich and other part which needs to have 15m pitch... the question is how to make it as 1 project ???? or how to seperate it to get 1 simulation figures. Pvsyst gets it as 1 orientation . PS " unlimited sheds " is not a solution. it does not work in this situation

-
 Meklit joined the community
 - Yesterday
-
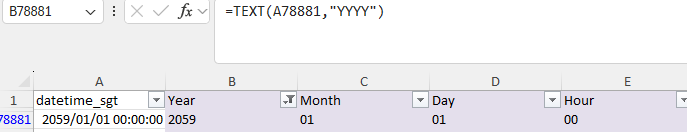
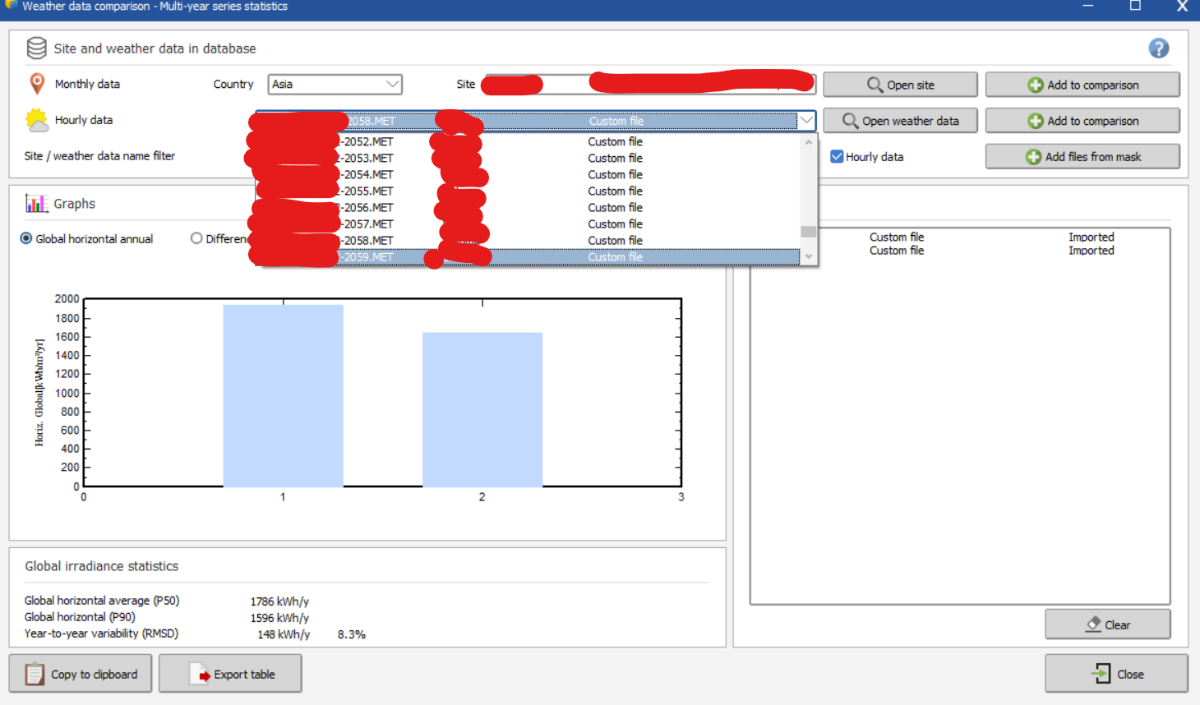
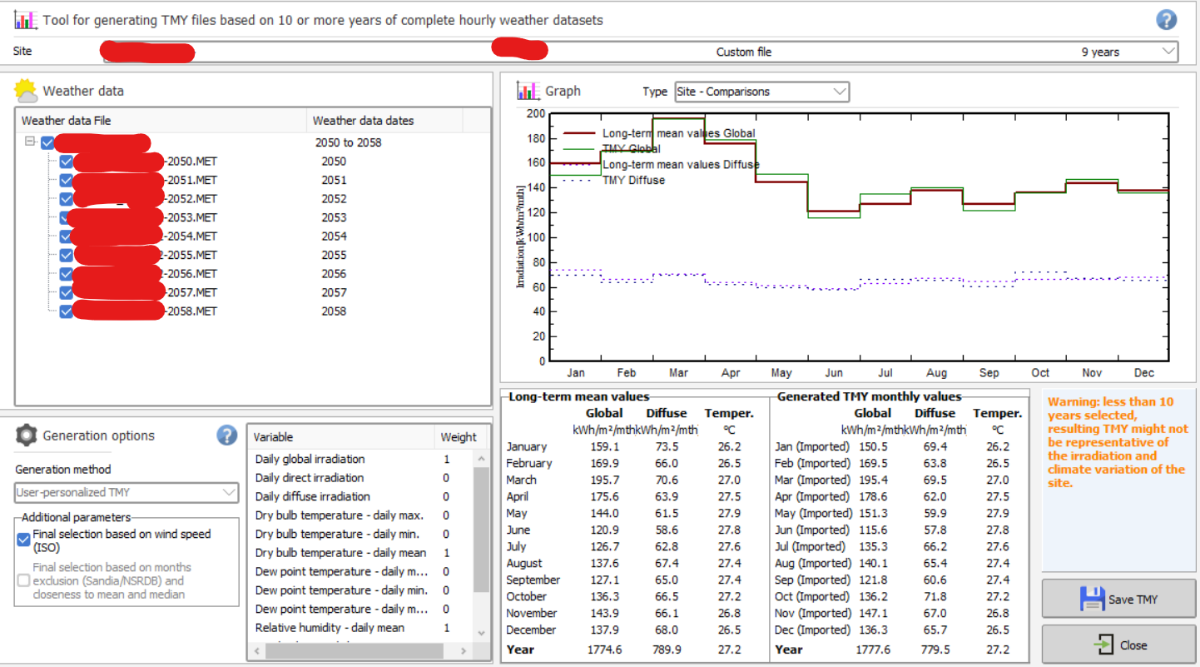
Unfortunately, this is a known bug and I'll ping the developer team about it. In the meantime you should change the year from 2059 to 2049 when generating your .MET file for that year. It won't change anything when generating the TMY from your 10 files that they are labeled 2049-2058 instead of 2050-2059
-
 SONA joined the community
 -

PVsyst v6: Inconsistent Date Format in Hourly Output .CSV File
aspf replied to kjs55's topic in Problems / Bugs
Sorry for the late reply. I ended up using TEXT function.
-
Hi, i have created 10 years worth of MET files for TMY generation from 2050-2059 but when i go to TMY generation tab, it only shows MET files up to 2058. This is a bug? thank you.
- Last week
-

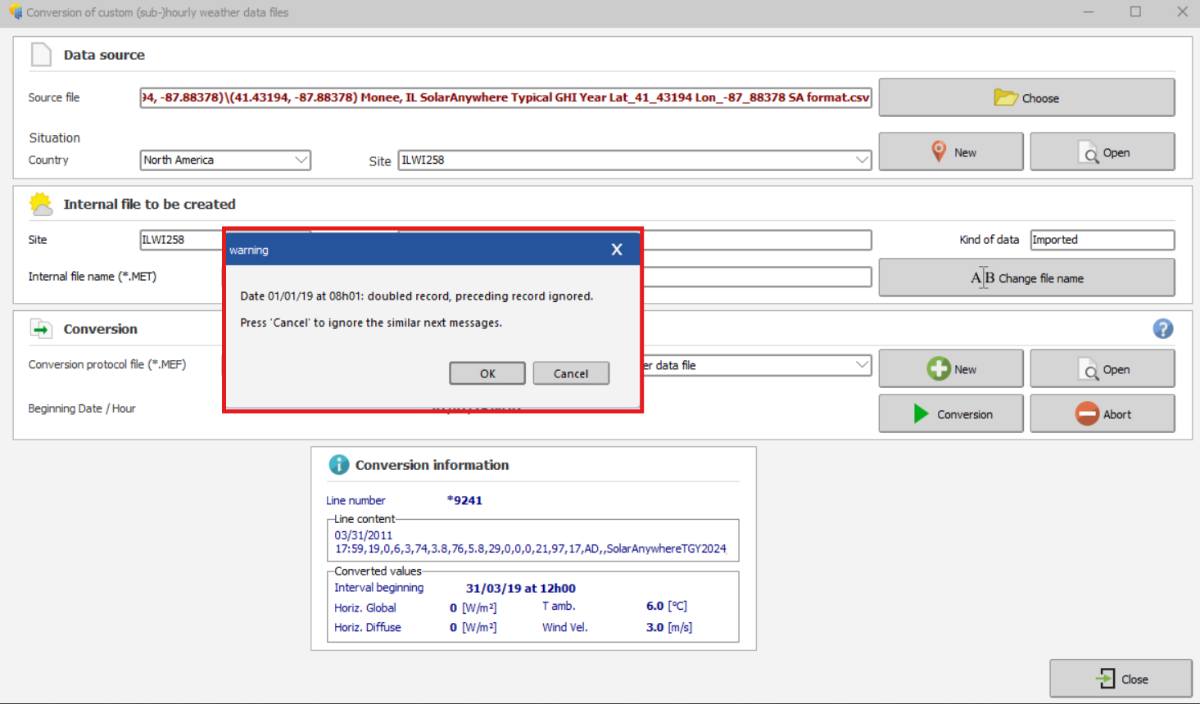
How can I import a quarter-hourly meteo file into PVsyst?
Linda Thoren replied to Nihal Meena's topic in How-to
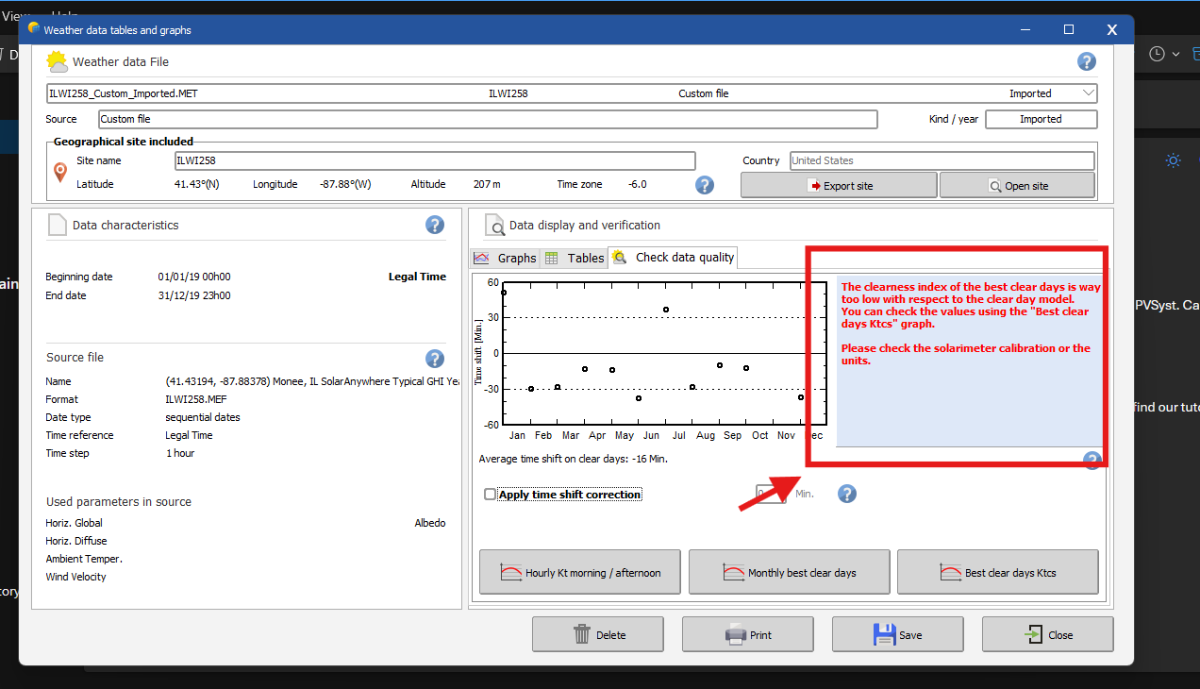
Hi, Indeed the custom import process can be a bit tricky. In the upcoming release of version 8.1, we will introduce a new assistant to help guide users more easily through the construction of the .MEF file. When importing sub-hourly data, please ensure that the time step is correctly set to 1 minute rather than the default 60 minutes. The warning message you received indicates that the imported irradiance values are very low compared to the site’s clear-sky model. Is the site correctly defined? If you are importing measured data, it may also be worth checking whether the solarimeter requires calibration or whether the units have been properly specified. Feel free to send us your site and CSV file at support@pvsyst.com so we can take a closer look. Kind regards, -

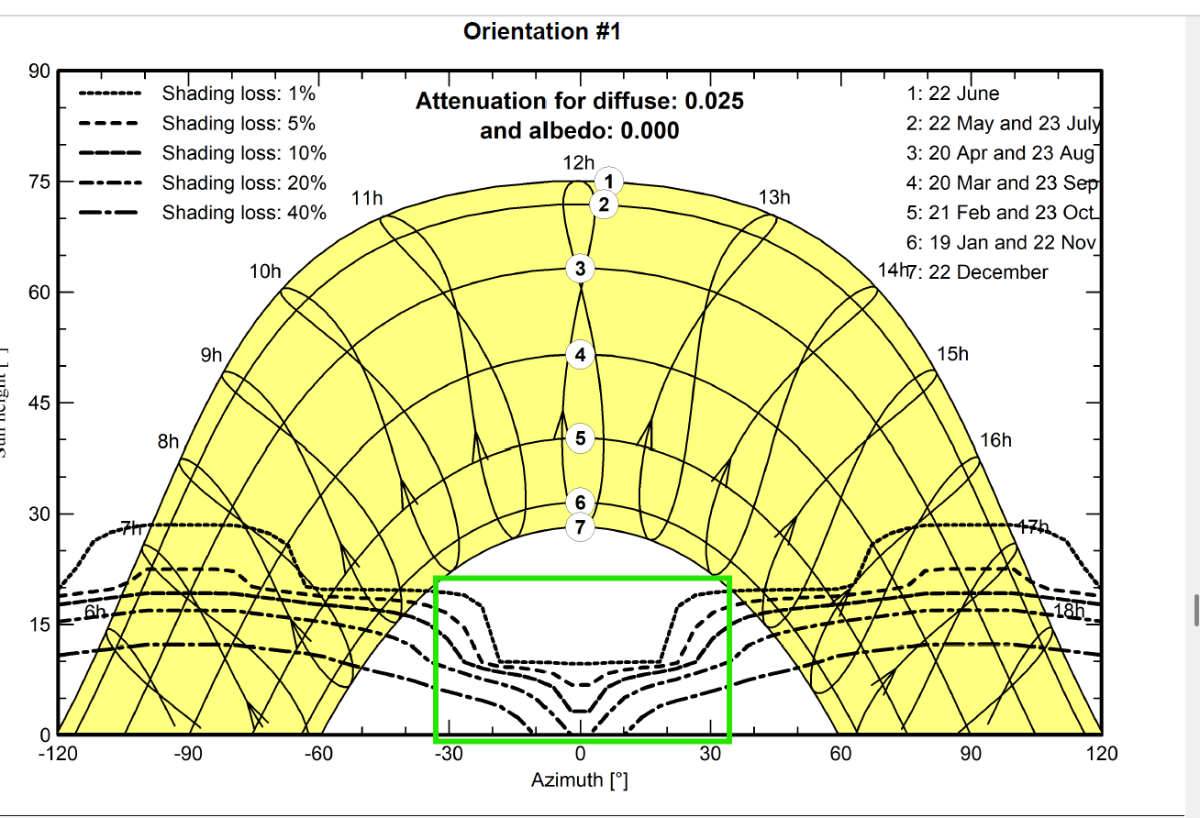
What does the white part of the Iso Shading Diagram representing?
Muhammed Sarikaya replied to PVsystUser's topic in How-to
Dear, The multiple curves visible comes directly from the shading factor table. See the help related: https://www.pvsyst.com/help/project-design/shadings/calculation-and-model/iso-shading-diagram.html This table is computed on a fixed grid (20° azimuth / 10° height),when fast calculation is choosed, see the help: https://www.pvsyst.com/help/glossary/shadings/shading-factor-table.html?h=table+fa And PVsyst always displays the isolines resulting from this calculation. However, the solar path never enters this region of the diagram that your show in green rectangle. Therefore, even though the iso-shading curves appear there, they do not correspond to any real shading situation. They are simply the graphical projection of the table-factor values in an area of the sun-position diagram that is never reached by the actual sun path. Only where the iso-shading lines intersect the solar trajectories can real beam shading occur. Regards, -
For loading the 1-minute data into PVSyst Version 8, a specific .MEF file format is needed. Can you help me in doing this because I am getting the different errors? Please do not recommend the help page i already go through the page. Can you also gave me the email so that I can share the CSV file with you?
-
 Please see the green rectangle in the screenshot below. What do the shading lines that fall inside the green square represent? That area is outside of sun path for the project's location; why they have a specific shape if they don't have any meaning?
-
 Farzam Shakiba joined the community
 -
In the 3D editor, please follow these steps: 1. 'Create -> Building/Composed Object' 2. Go to 'Add Object' and create the Handrail 3. After closing the 'Elementary shading object' window with the handrail, but still in the 'Building / Composed object' window, apply an azimuth of 90° to the handrail. 4. Now close the 'Building / Composed object' window, coming back to the main window of the 3D editor 5. If you now apply a tilt to the handrail, it will rotate like in the screen shot above.
-
 Vijayaraj joined the community
 -
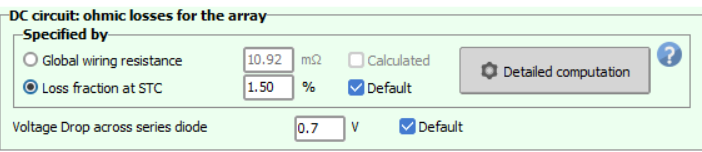
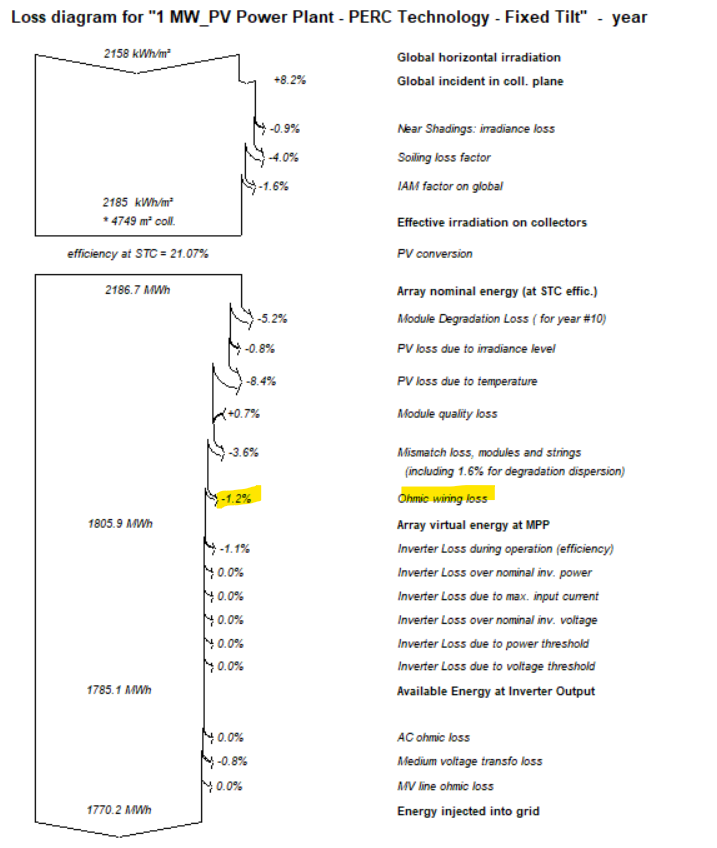
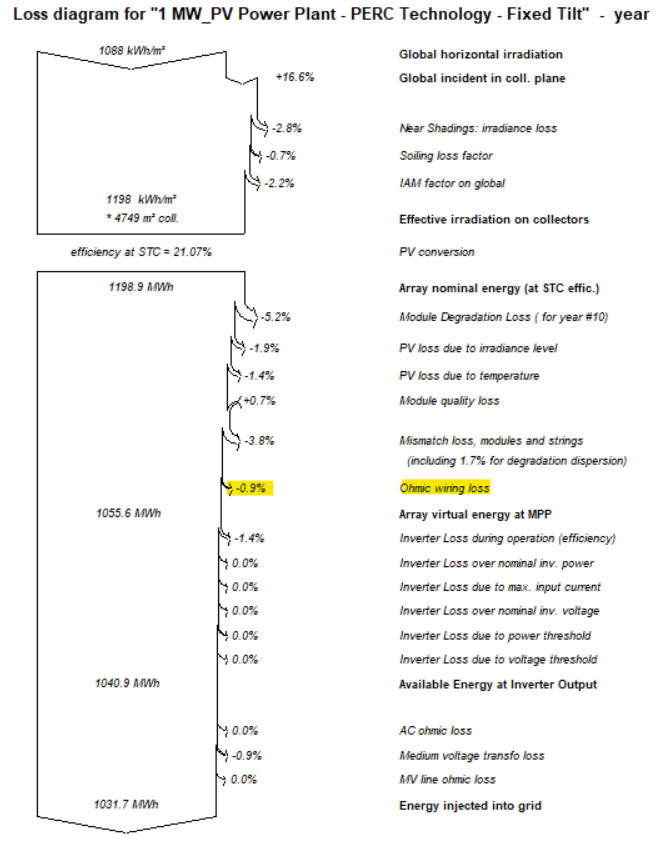
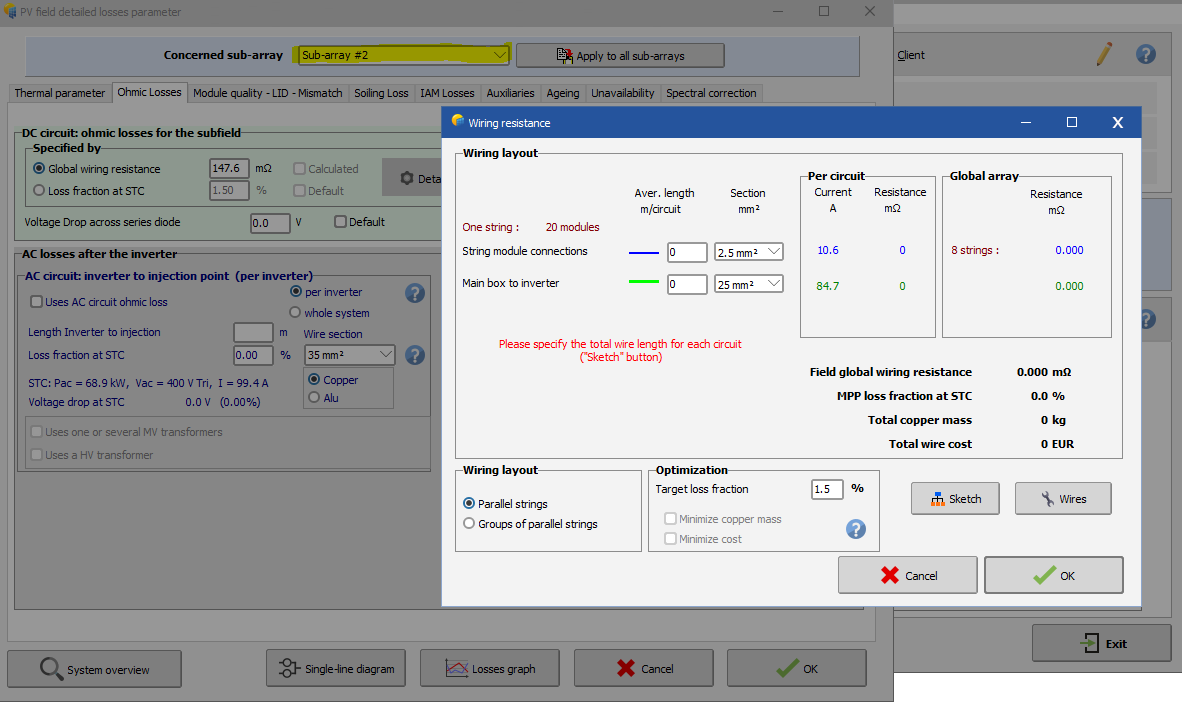
I have adjusted the DC ohmic losses as 1.5% as shown below for a typical PV power plant simulation in 2 different locations (Abu Dhabi & Berlin). However, the loss diagrams for both simulations shows 2 different values as below. Please clarify why the dc ohmic losses% in the loss diagram are different despite assuming the same losses (1.5%) considering identical setup. and provide details of the DC ohmic losses calculations method that leads to the percentages shown in the loss diagram.
-
 Deep patel joined the community
 -
 SAYA joined the community
 -
 l.bjarnason joined the community
 -
Dear Carlos, Today, with PVsyst version 8, you can mix any orientations you want. Regards,
- Earlier
-
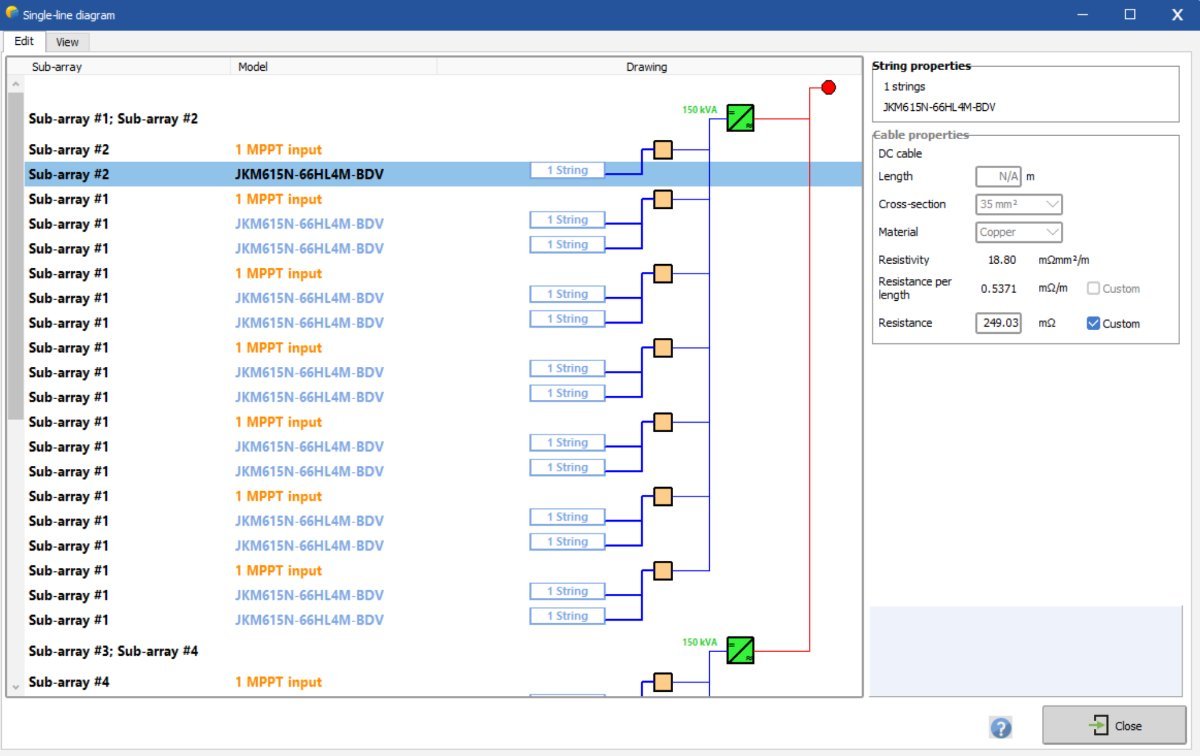
Hello, In the current version you cannot do these manipulations directly in the single line diagram. In the following youtube tutorial you find more information about the single line diagram and the DC and AC cables : The losses in the DC and AC cables can be defined in the detailed losses window as discussed in the following forum posts:
-
Dear PVsyst team! Please tell me how to calculate losses in DC and AC cables ?
-
Is there a way to use mixed orientations with numbers different than #1 ad #2?
-
If you have multiple sub-arrays, you can define individual parameters for each sub-array by using the drop down list in the top of the window
-
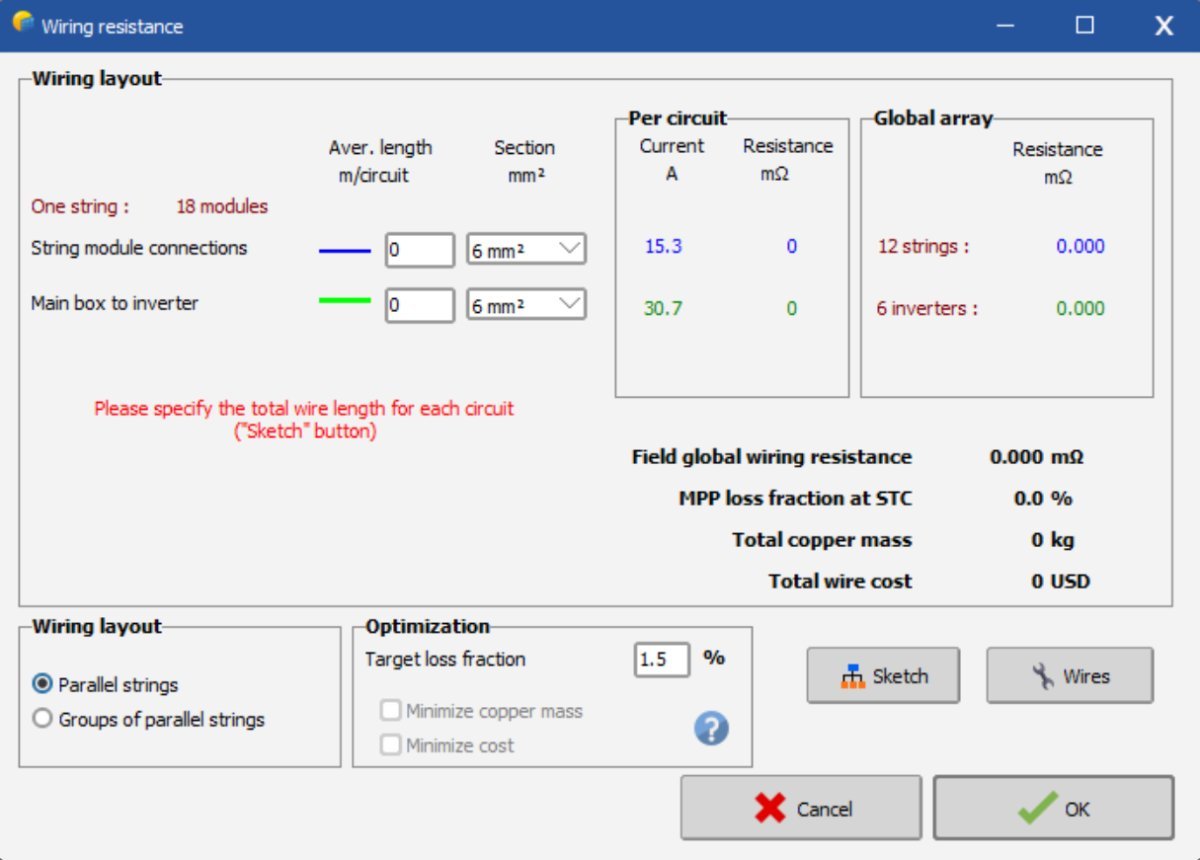
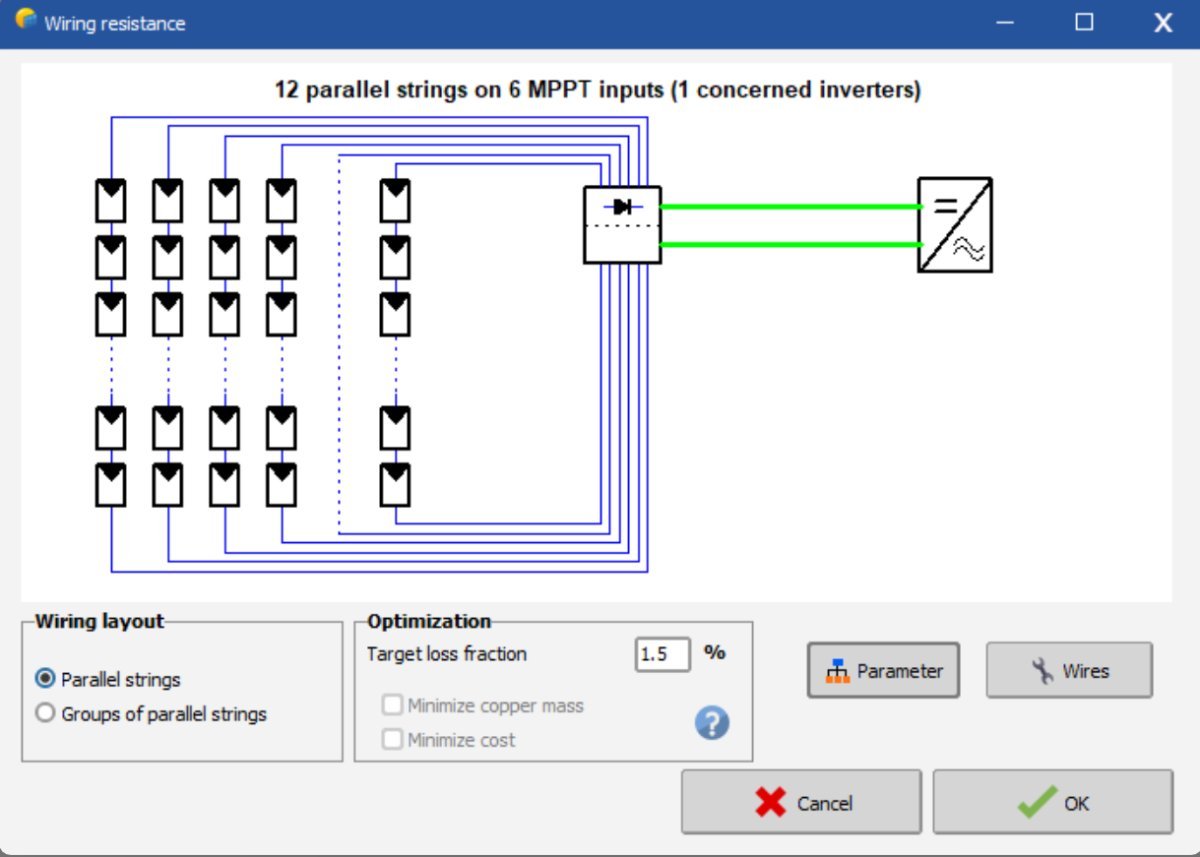
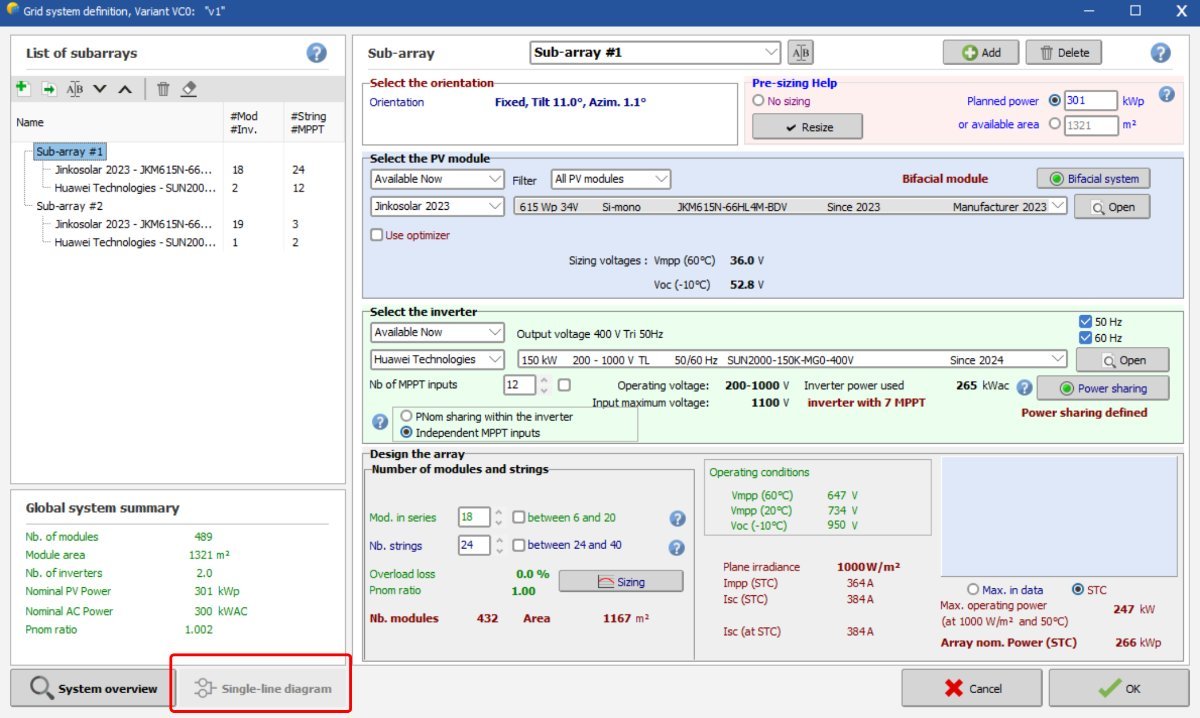
How can I enter the cable length for each line separately? My calculations show 12 lines for panel 18 and 2 lines for panel 19, but it doesn't show up here?
-
Now how can I enter the length and cross-section of the cable for each string? I can't enter values here, the cell is not lit.
-
For certain scenarios it is not yet implemented, such as for multi orientation daily sharing. In the case in your print screen it is probably because you do not have a multiple between the number of strings and MPPTs in the second sub-array. You should have an orange warning in that sub-array indicating this. You should here create an additional sub-array for the strings of 19 modules, one sub-array with 2 strings and 1 MPPT and a second with 1 string and 1 MPPT. This is further explained in the following youtube video:
-
Hello, This can be done in the detailed losses window, Ohmic losses tab.
-
Why sometimes my SLD doesn't light up even though there are no errors in the system?
-
Good day everyone! How can I enter data to calculate cable losses?
-
 Getting high quality irradiance measurements in the field can be difficult and the two main sources of errors we see from our users are: Shaded sensors, especially for trackers. This can be identified by comparing your data to clearsky expectation on good weather day, and looking for unexpected decreases. The pattern should repeat from one day to the next. Sensor misalignments, either in azimuth or tilt (or both). Even small discrepancies have an impact. If you can easily download POA irradiance from solargis, chose a clear day and download data for several azimuth and tilt values around your expected geometry. Then check if one of the alternative geometries fits your measured data better. If your sensor is misaligned, you can still use the data in PVsyst as we first decompose POA irradiance into GHI and DHI. You just have to use the real tilt and azimut when importing data.