All Activity
- Past hour
-
Optimizers won't necessarily increase the system production. Optimizers are especially useful when a part of the string is partially shaded, and has a different Impp (current at max power point) from the rest. Without optimizers, the whole string have to use the current of the worst module, leading to a lower overall production. With optimizers, the shaded and unshaded modules can operate at their own optimum current, the optimizers ensuring the output current to be the same. But when you don't have partial shadings, optimizers cannot improve anything. And since optimizers have their own efficiency, they end up increasing the system losses, leading to a lower PR.
-
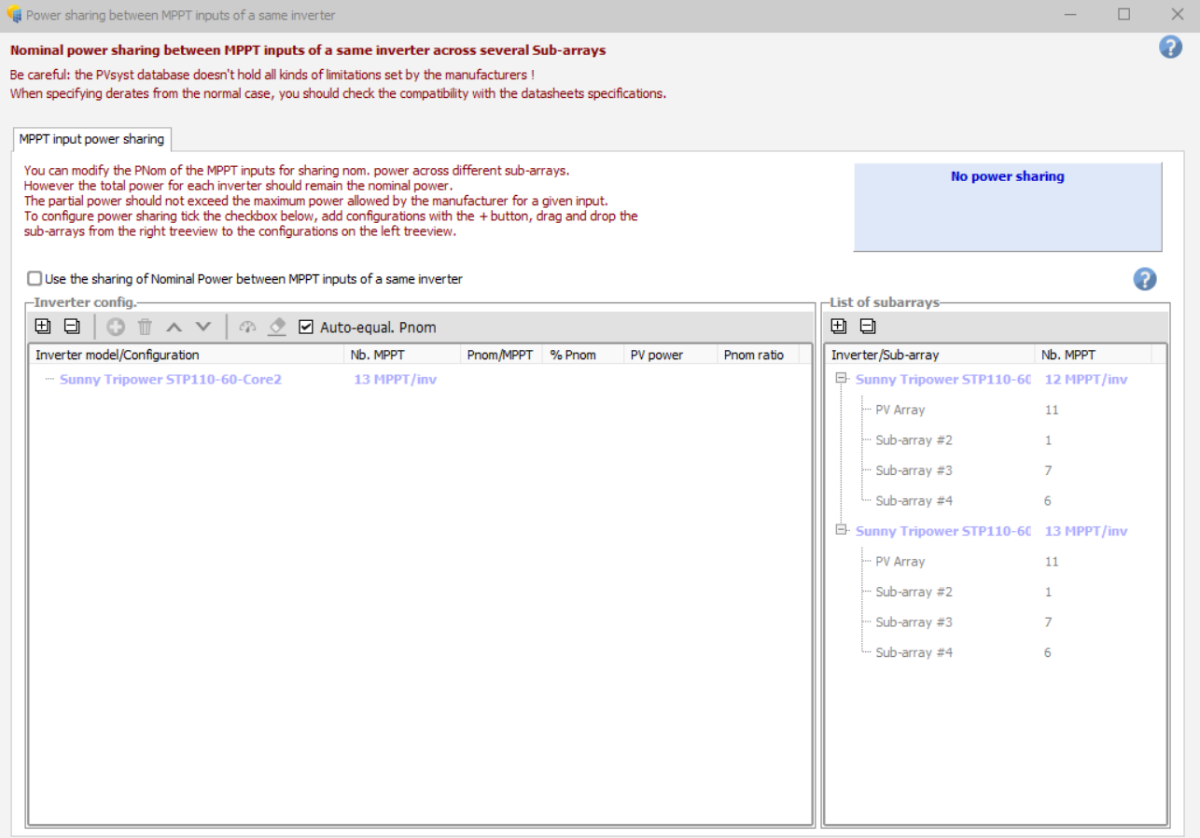
Hello, In the second print-screen, you must activate the option "Use the sharing of Nominal Power between MPPT inputs of a same inverter". You find a full tutorial of how to use this tool (version 7) in the following youtube video: Kind regards
- Today
-

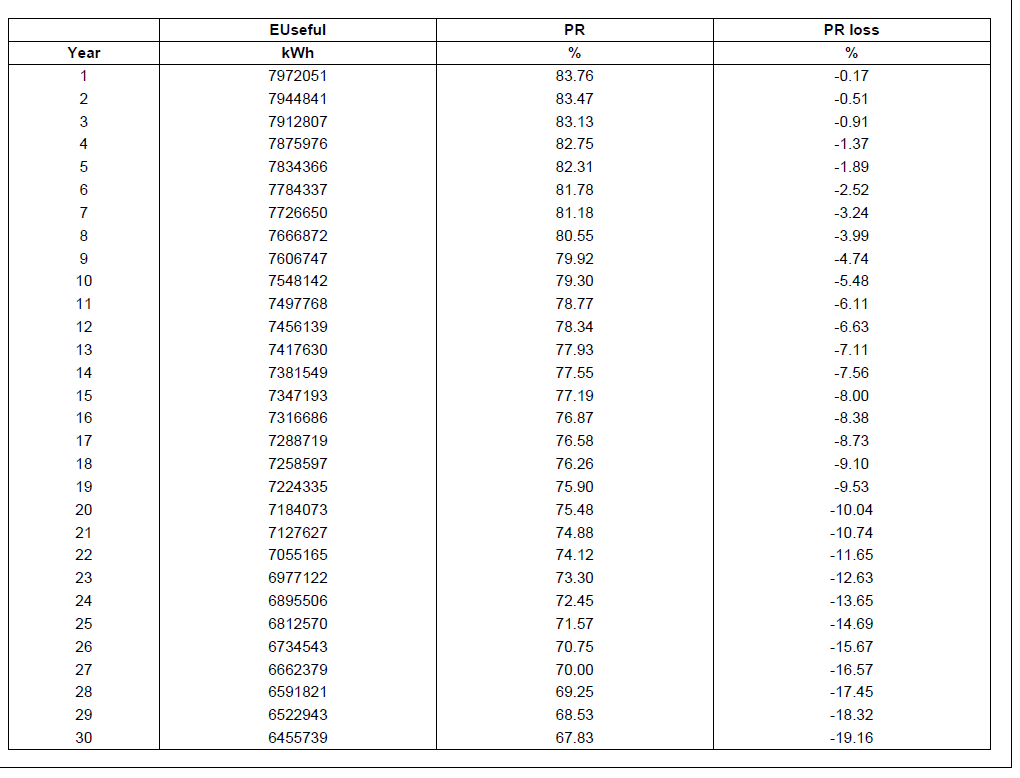
Difference in Produced Energy while comparing with the ageing
Linda Thoren replied to hritik's topic in PV Components
Hello, Thank you for reaching out. Please first verify that you are indeed simulating the first year (that in the aging tab in the detailed losses window, year 1 is defined). What PVsyst version are you using ? Some discrepancies and rounding errors can appear Kind regards, - Yesterday
-
 "I want to know whether such calculation results are normal and what the reasons for such differences are?
 -
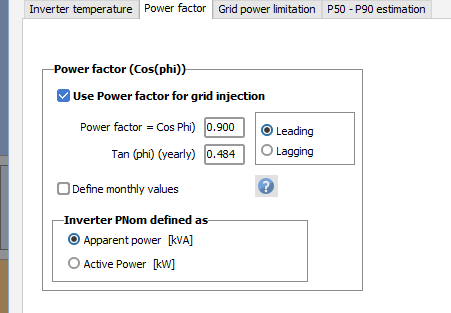
I have a question regarding the power factor. I set the power factor(cos phi) to 0.9 in PVsyst Version 7.4, but the energy flow diagram in the calculation result report shows it as 0.894. I would like to know the reason for this discrepancy.

-
jack chen joined the community
-
 FBPL joined the community
 - Last week
-
 HALİL joined the community
 -
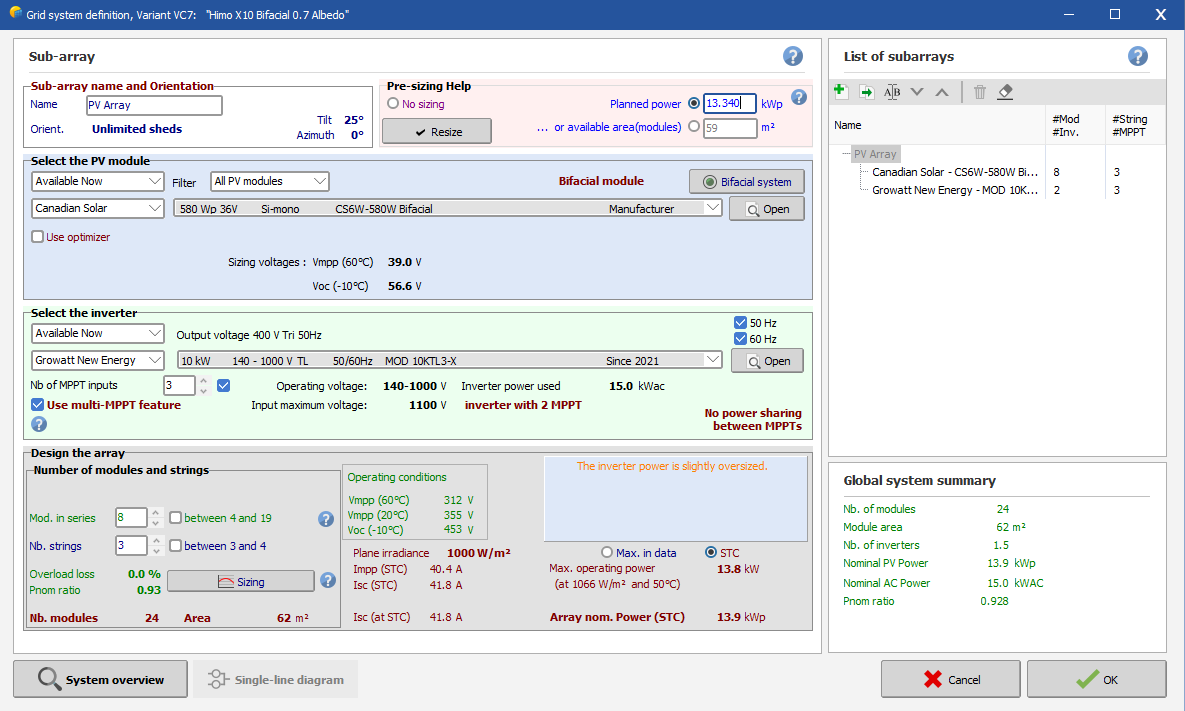
one thing more to clear that in real in my house a 13.340KW system installed with 15KW inverter, and also 23 Panels installed of 580W capacity/panel install, then why I can't modeled in PVsyst exact 23 panels but in reality I installed, in real I install a 15kw inverter but in pvsyst i use 10kw but pvsyst telling that inverter is oversized so what is this plz clarify thanks
-
-
 RIYAH Aden joined the community
 -
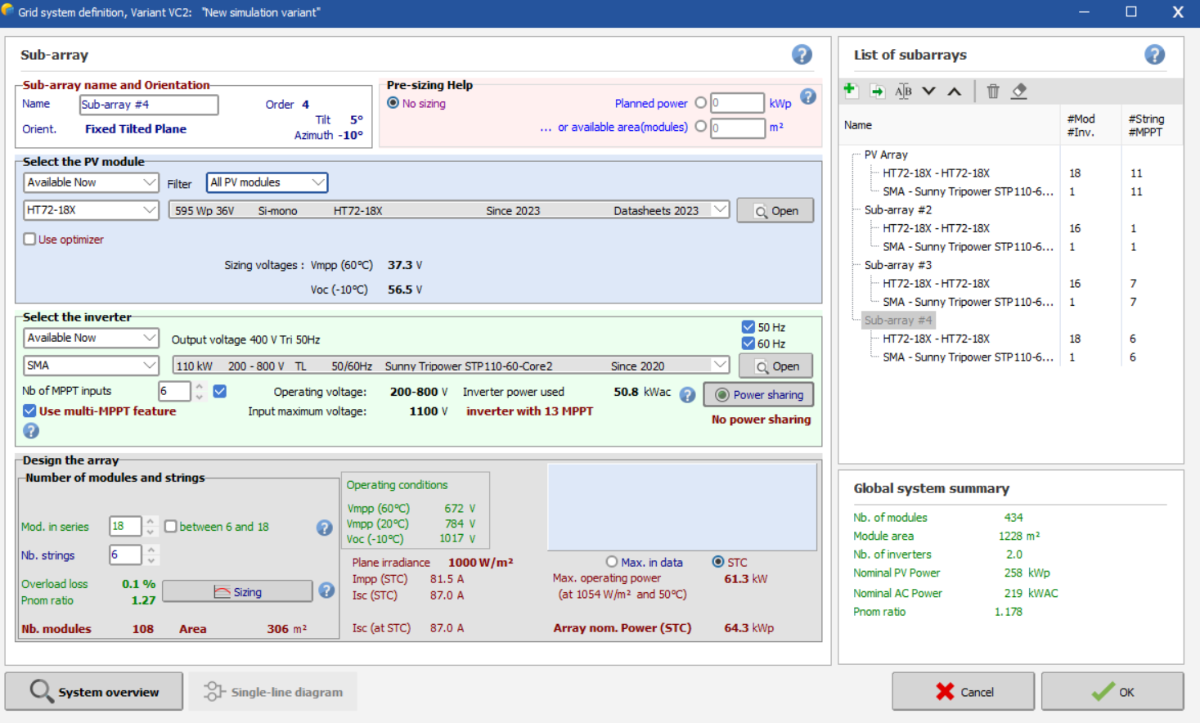
There is a existing project that I need to make a simulation using pvsyst. The inverter is sma sunytripower 110. i understand that I need to make subarrays to make simulate different no of strings in 2 different inverters. but in power sharing tab, there is plus sign to add a different configuration is not green and inactive. How to I fix it? Or am I doing it wrong?
-
 Carlo joined the community
 - Earlier
-
 Hi, Where the Tracker Power Supply demand can be added in the simulation, even though its negligible to consider? Thanks, Job
 -

Difference in Produced Energy while comparing with the ageing
hritik posted a topic in PV Components
There is a discrepancy in the first-year energy generation values. The produced energy is reported as 7972.051 MWh, whereas the result summary shows 7988.7 MWh. Kindly clarify the reason for this difference. A similar mismatch is also observed in the specific yield when compared with theoretical calculations. Please explain in detail the reasons for these variations.
-
 mojtaba aram joined the community
 -
 Abdulmuheez joined the community
 -
 Rach joined the community
 -
The PVsyst version 8 program does not go full screen on Windows 11 and there is a problem. How should I solve it?
-
I'd like to suggest improvements to PVSyst's financial documentation in three areas: 1. Discount Rate: Real vs Nominal The discount rate is nominal (applied to inflated cash flows), but this isn't stated in the documentation. A client recently asked whether this figure was real or nominal - I had to reverse-engineer the model to answer them. Suggestion: Explicitly state that PVSyst requires a nominal discount rate. 2. LCOE Calculation PVSyst's LCOE differs from the standard definition - it calculates from the equity perspective rather than using WACC and total investment. It also assumes a fixed price tariff rather than one that rises with inflation. This answers a different question (minimum fixed tariff for equity break-even vs. levelized cost per kWh) and could confuse users familiar with standard LCOE. The documentation should clarify this distinction. Suggestion: Either rename this metric (e.g., "Minimum Required Tariff" or "Equity Levelized Cost") or document clearly that it differs from other approaches to LCOE and that care should be taken when comparing the result to other sources. 3. Payback Period (% Amortisation) The formula combines debt principal (undiscounted) with profits (discounted) - this isn't documented and is highly unusual in financial analysis. More problematically, this incentivizes overleveraging: increasing debt improves the apparent payback even though it increases project risk. The metric also changes character abruptly when debt is repaid, making the metric inconsistent across the project lifecycle. Suggestion: Document the current formula clearly, but consider switching to a standard discounted payback calculation where all cash flows are treated consistently.
-
 Hello PVsyst team and community, I would like to clarify a conceptual point regarding the Solar Fraction (SF) in stand-alone (off-grid) or PV + battery simulations. From the documentation and forum discussions, I understand that: E_Load represents the energy demand of the user (defined load). E_User represents the energy supplied to that user. Unused energy accounts for PV energy that cannot be used when the battery is full and the load is already covered. SF = E_User / E_Load. However, in several simulations of PV + battery systems with no loss of load (LOL ≈ 0), I observe Solar Fraction values slightly above 100% (e.g. 101–103%), even though E_Load is fully covered and all excess PV production is already accounted for as “Unused energy”. Conceptually, this raises a question: If E_User represents the energy supplied to the defined user load, should it not be limited to E_Load, such that SF ≤ 100%, with all additional PV energy going strictly to “Unused energy”? I understand that this may be related to the internal calculation sequence (i.e. E_User being evaluated before curtailment due to battery full), but I would appreciate clarification from the PVsyst team on: Why E_User can exceed E_Load in the annual balance, leading to SF > 100%. Whether SF > 100% is intended as a design diagnostic indicator of PV overcapacity, rather than a physically bounded performance metric. If there is any recommended way to interpret or report SF in such cases, especially for non-technical audiences. Thank you in advance for any clarification. Best regards, Rafael V
-
Why do performance ratio and production decrease in PVsyst when using optimizers?
-

Temperatures when simulating DC cable losses
André Mermoud replied to AhmadMick's topic in Simulations
In PVsyst, the cables temperature is fixed to 50°C at any time, supposed to be an "average" during all conditions of the simulation In the reality, the wire temperature is obviously not well defined: it depends on the wire mounting mode, the possible exposition to the sun, the current, etc... The sensitivity of the resistivity to the temperature is 0.39%/°C, for the copper as well as for the aluminium. See the help https://www.pvsyst.com/help/project-design/array-and-system-losses/ohmic-losses/metal-resistivity.html?h=resistivity NB1: in a next version, it will be possible to choose the temperature for any part of the wiring. In the present time, you can modify it in the advanced parameters. NB2: the wires temperature has nothing to do with the cell's temperature in the module. -
This parameter "Maximum current per MPPT" is indeed quite correlated to the "Minimum voltage for attaining PNom". See the help https://www.pvsyst.com/help/component-database/grid-inverters/grid-inverters-main-interface/grid-inverters-main-parameters/index.html#input-side-dc-pv-array Now if this is specified, PVsyst will apply this cutrremt limit during the simulation. But this rarely produces "Inverter losses due to current overload", as this limit is most of the time preceded (masked) by the Power overload limit. See the Help https://www.pvsyst.com/help/physical-models-used/grid-inverter/inverter-operating-limits.html If the limit is not specified, it is obviously not applied. Now this limit is not always well "understood" by the manufacturers who submit their data, nor well defined in the datasheets. Sometimes we have to add this information afterwards in the database.
-
Hi and Wish you a pleasant day. I would like to ask about DC cable calculations: +) How does PVSyst determine the temperature when calculating DC cable loss +) What formula is used when calculating DC cable loss. +) Is the temperature for DC cable loss and Temperature of the cell equals at all times during simulations. Pardon my bad english, if my question is unclear please let me know. Thak you for your time.
-
The 2022 file in your database having an incorrect current is likely due to how PVsyst interprets unspecified parameters.If a manufacturer provides a datasheet but leaves the Maximum Input Current blank or ambiguous, PVsyst might calculate it using a default formula: I_{max} = Pnom,DC / Vmin,Pnom If the manufacturer's datasheet and the PVsyst-calculated value don't align, you get the weird capping losses clipping you are seeing.
-

Command for saving a PDF files using the CLI
Hizir Apaydin replied to Gustavo Pianovski's topic in How-to
Dear Gustavo, You can manage the report generation by using these options: -rpf option will let you choose the ouput path for the generated PDF. Regarding the simulation time, we have not observed a difference between PVsyst and PVsystCLI for the batch mode. For a more detailed analysis, you can export and send your project (PVsyst main menu File>Export project) and your batch configuration files (CSV, RVT, and SFI) to support@pvsyst.com Regards.
-
Hello, What is the command for saving a PDF files using the PVsyst CLI? I'm doing some testing on two projects. In project A, the PDF is saved correctly. I'm executing the following command: PVsystCLI.exe run-simulation -w:"C:\Users\PC-03\PVsyst8.0_Data" -p:"F 2025 999 TesteCLI_Project" -v:"VC2" -bpf:"C:\Users\PC-03\PVsyst8.0_Data\UserBatch\F_2025_999_TesteCLI_Project_BatchParams_0.CSV" -brf:"C:\Users\PC-03\PVsyst8.0_Data\Models\Simulacao_Plurianual.rvt" -isf:"C:\Users\PC-03\PVsyst8.0_Data\Models\Saidas.SFI" In project B, it saves CSV files but not the PDF: PVsystCLI.exe run-simulation -w:"C:\Users\PC-03\PVsyst8.0_Data" -p:"F 2025_Project" -v:"VC1" -bpf:"C:Users\PC-03\PVsyst8.0_Data\UserBatch\F_2025_Project_BatchParams_3.CSV" -brf:"C:\Users\PC-03\PVsyst8.0_Data\Models\Simulacao_Plurianual.rvt" -isf:"C:\Users\PC-03\PVsyst8.0_Data\Models\Saidas_Certificacao.SFI" Additionally, why is simulating a batch using the PVsyst CLI slower than simulating the same batch directly in PVsyst? In my analysis, using the CLI is 1.5 times slower.
-
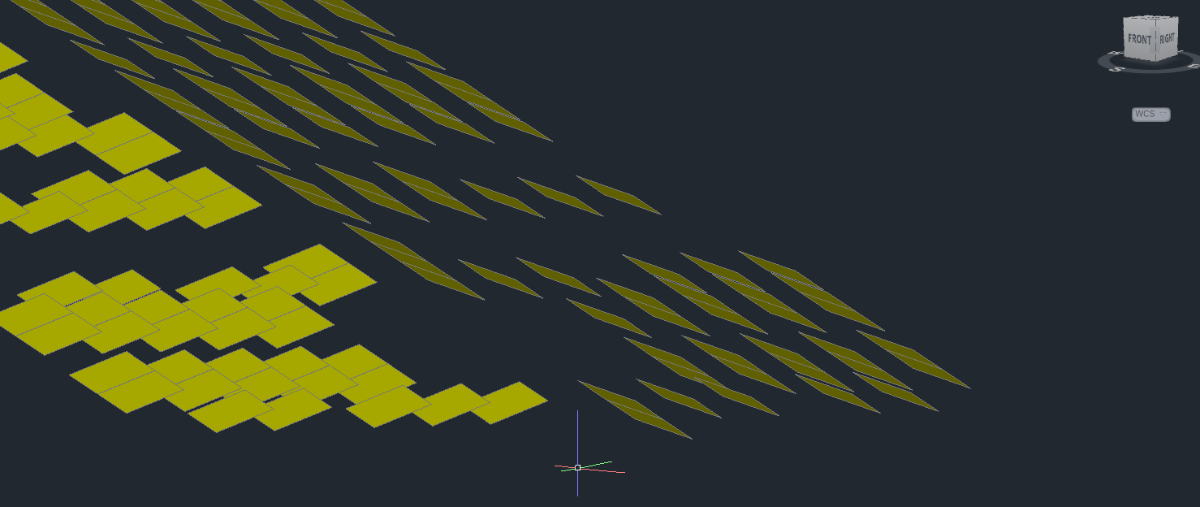
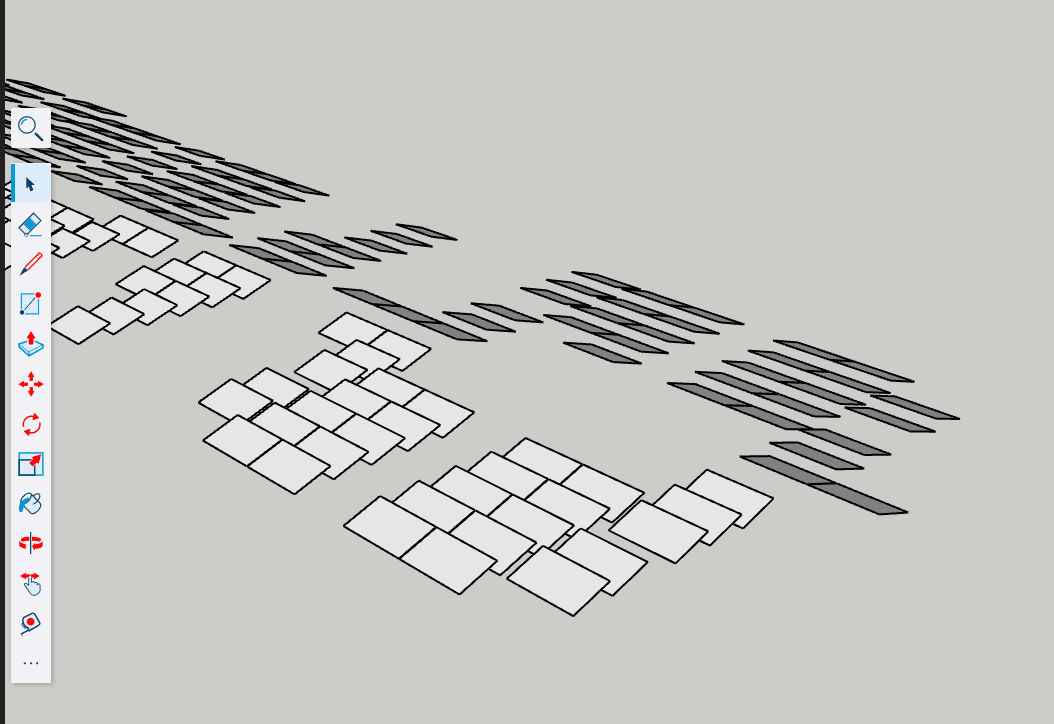
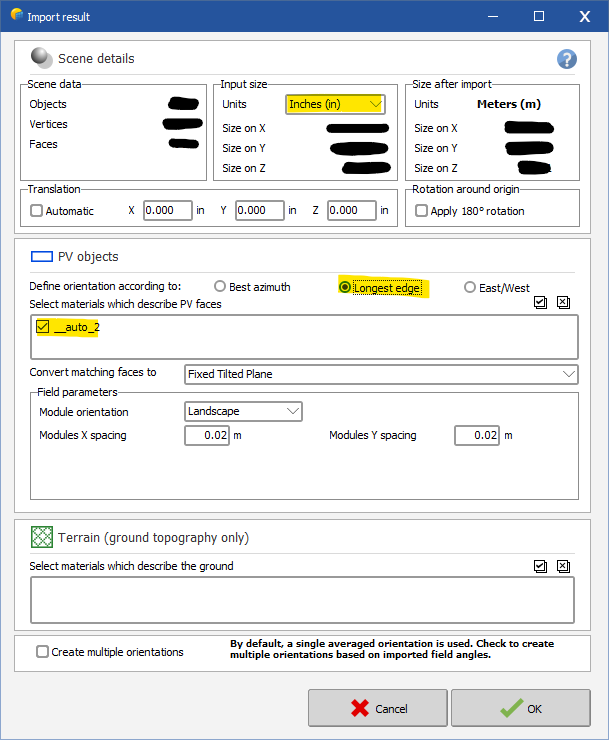
For anyone else who couldn't figure out the FBX converter, I found a solution. All of the other forum posts helped get started, so I thought it would only be fair for me to post the solution that worked for me. The following solution is for a rooftop PV system, so you might have to process the finished file differently than I do, but most should be the same. 1. Create your .DWG file as explained above. Don't forget after you create your 3D faces, delete all other 2D lines. This will help later when you import to PVsyst. Leave only 3D faces. Should look something like this: 2. Use SketchUp to convert .DWG to .DAE file. You can use the web-based version of SketchUp here: https://app.sketchup.com/app. You can also download the app, whichever is your preference. You can use the free trial if you only need it for one project, but you'll have to purchase the subscription after that. It's not that expensive. Import your .DWG or .DXF file to SketchUp with the correct units. Use the measure tool to verify module edge lengths. Finally, export your SketchUp scene to 3DS or Collada (.3DS or .DAE). PVsyst will accept either. I usually do Collada .DAE. 3. Import to PVsyst. Open a new 3D shading scene in your project file -> File -> Import -> Import a 3D scene. Select your SketchUp file (.3DS or .DAE). Select the right units under Input Size. Under PV objects, I usually check off "longest edge", and make sure you select the materials to describe the PV face (should be something like "auto_1". Do not touch anything in the terrain section, as it will make your objects import as a building object, not PV faces. 4. Once imported, you will need to move things around a little in PVsyst. My usual process is as follows. I import a ground image, and start creating my building objects that my PV faces will be on. After I create the buildings in PVsyst, I rotate and move the imported modules to fit on the buildings I created. (Tip: Raise the modules higher than the building on the Z axis, change the point of view to XY, then you can fit the modules pretty accurately on the building.) The most important part is to auto-set the height of the modules. Select the modules -> edit -> set auto altitude -> click set auto altitude on the right toolbar, and the modules will stick right onto the rooftop. This saved me so much time. Hopefully, this explanation helps someone out. Let me know if you have a question on this method.
-
 Hello, By definition a .PAN represents a PV modules with its performance. Even withing the same technology, there are a lot of variations of solar cell performance - from providers, from batch-to-batch, from improvement in the production line etc... So if you change the solar cells, it becomes a completly different product and all the values entered in the .PAN file should be reviewed for consistency. Now it all depends what is your simulation goal by doing this. I can only answer your question if you give me more details and context.
 -
For SolarEdge system there is two different advanced parameters limiting the Pnom ratio, one for inverters with less than 25kW nominal power, on for more than 25kW. Since the 50kUS is set to 16.7kW (1/3 of the physical inverter), the <25kW parameter. Please check these parameters in the advanced parameter menu (Settings => edit advanced parameters) You should be able to simulate your system if you change the parameter 404 to something higher than 39%
-

Shadow Loss Factor Graph Not Showing Up Anymore
Jéremie Bernier replied to Trall1945's topic in Problems / Bugs
Hello. Once a simulation has been performed, the loss diagrams available in PVsyst are shown as yearly or monthly values. You can select a specific month to visualize the different losses, including shading losses. However, at this level there is no option to display daily loss values throughout the day. Could you please share a screenshot of the window or the report where you previously saw the graph you are referring to? That would help clarify which feature or result you are mentioning. -
Hello, have you tried changing it from the project settings? Also what is that menu? where did you access it from?


higherthan1instand-alonePVbatterysystemsclarificationonE_UservsE_Loaddefinition.png.e55bbbeef42ee699bfa6b80e26738cb2.png)