All Activity
- Past hour
-
Yes, in this case, this is the ratio of the annual values. In fact, the P50/P90 statistical evaluation only make sense when you compare yearly results. These notions don't apply to hourly or daily values, and hardly on monthly values. For example for evaluating the P90 of the results of, say, January, you should avail of a list of January values from many years, and calculate the standard deviation of this sample. This will obviously be far larger than the yearly variability. This doesn't make sense. Now applying the P90 factor to each hour of a climatic data file is not correct. This would mean that each hour of a clear day would be diminished by this factor, which is obviously not the case. The P90 factor will induce a difference in the distribution of the bad and good days, not the absolute values of irradiances. The only way to get P90 hourly values is to use a TMY weather datafile specifically constructed in this way. I.e. choose periods for the TMY construction which result in a P90 predefined yearly sum. This file may be completely different than the original P50 weather file.
-

Horizon data is not saved when opening a variant
Auriane Canesse replied to RobSolar's topic in Problems / Bugs
Dear Rob, I cannot reproduce your error in version 8.13 (current latest version). Could you please send an email to support@pvsyst.com with the concerned project so I can investigate this issue? And could you confirm which version you are using? - Today
-
@dtarinDoes P90 factor mean Annual generation P90 / Annual generation P50 ?
-
 Your questions: Why is the “Produced Energy” (and PR) so much lower in the no injection scenario when the PV array performance and load supply remain the same? You have a system of 3.4 MWp, this probably produces more than 17 MWh during a clear day. Now during this day the internal consumption is 4.8 MWh and the possible storage is 3 MWh, therefore 7.8 MWh. If you don't reinject into the grid, you will have more than 9 MWh lost ! Is PVsyst not counting excess PV generation as “Produced Energy” when it is curtailed (i.e., when the battery is full and there's no injection allowed)? In this case the energy is indeed not used (it is even not produced), it is quite logical that it is named "Unused energy" Is there a better way to represent "total generation potential" in a self-consumption system without grid injection, so that I can compare energy yield more realistically? Why a better way? The "Total generation potential" is indeed the sum of the used energy and the unused energy, this seems quite clear for the user.
 -
With the latest versions of PVSYST, I noticed that when adding a Horizon profile (for instance, using PVGIS), saving the variant, change variant and go again to the inicial variant, the horizon profile is gone and it is required to add it again. I think this was not the case in previous versions and this may cause mistakes, since now you have to remember to always check the horizon when doing a simulation.
-
Dear Mikhail, The aging tool is a general tool to represent several situations. Unfortunately, the literature is a bit scarce on aging (real aging tests need years of field testing and there are a variations among technologies and climates - new technologies still need to be monitored more extensively) and on our side we don't have at the moment a clear literature review on the topic to hand out on to give clear recommendation on our side. However, here are a few additional clarifications: First recommendation: if provided, input the aver. degradation factor from the data sheet of your module (/!\ this is not equivalent to the warranty!). Know that average degradation factor lies between 0.2-0.6%/year. So you can adapt it if you want to see a more or less optimistic/conservator impact. The Imp / Vmp contribution is set by default to 80/20 %, to represent the fact that often the first impact on the long term are first of optical nature (=decrease the current), for example due to encapsulant yellowing. But this is to adapt with what you find in the literature about your technology or what you observe in the field. The Imp and Vmp RMS dispersion are tuning parameters of the model. If you set them at 0, all the PV modules will have the exact same degradation rate and your system will follow the blue curve. Set to higher values, the PV modules will have mismatch among them and an additional loss occurs because of this (mainly driven by the PV module whose current degrades the fastest). There is not really literature to advise what parameters to input here, but you can use this parameters to visualize the extra impact of this mismatch or tune it to make it correspond to existing measurements of a PV system.
- Yesterday
-
 Hello, I’ve run two PVsyst simulations for the same rooftop PV system on a warehouse in Malaysia. Both simulations have identical parameters: System size: 3423 kWp (6339 × JinkoSolar JKM-540M-72HL4-TV) Inverters: 12 × Sungrow SG250-HX (total 3000 kWac, Pnom ratio: 1.141) BESS: 2 × Huawei Luna2000 (2936.4 kWh usable capacity) Orientation: 6 fixed tilts (e.g., 13°/-20°, 13°/160°, etc.) User load: Fixed profile, ~4800 kWh/day (1,752,000 kWh/year) Self-consumption strategy with battery charging from PV surplus and discharging to support load The only difference between the two runs is: Case 1: Grid injection allowed (Grid reinjection: Yes) Case 2: Grid injection not allowed (Grid reinjection: No) However, the annual "Produced Energy" output differs dramatically: Case 1 (Inject): ~4.97 GWh/year, PR = 82.27% Case 2 (No Inject): ~1.74 GWh/year, PR = 28.81% Other metrics like EArray, E_InvOut, and load-supplied energy (E_Solar = 1.74 GWh, SF = 99.26%) are identical in both cases. My questions: Why is the “Produced Energy” (and PR) so much lower in the no injection scenario when the PV array performance and load supply remain the same? Is PVsyst not counting excess PV generation as “Produced Energy” when it is curtailed (i.e., when the battery is full and there's no injection allowed)? Is there a better way to represent "total generation potential" in a self-consumption system without grid injection, so that I can compare energy yield more realistically? I want to ensure I'm interpreting these results correctly, especially for techno-economic reporting under self-consumption-only policies (e.g., Malaysia’s SELCO guideline). Thank you!
 -
Sorry there is no workaround. This will be corrected in the version 8.0.14, to be released mid-July. In the meantime, you should reinstall the previous version 8.0.12. You can install it in parallel with this version 8.0.13, both versions may coexist without problem.
-
mingsolar joined the community
-
 Harry Sayannos joined the community
 -

-
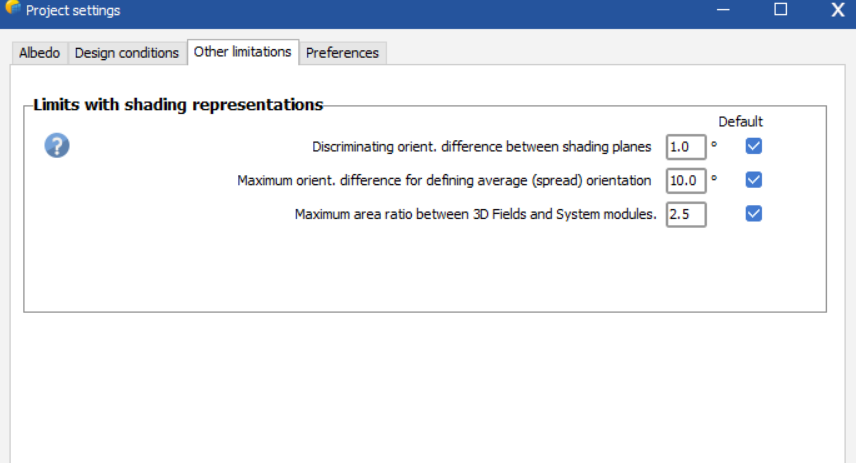
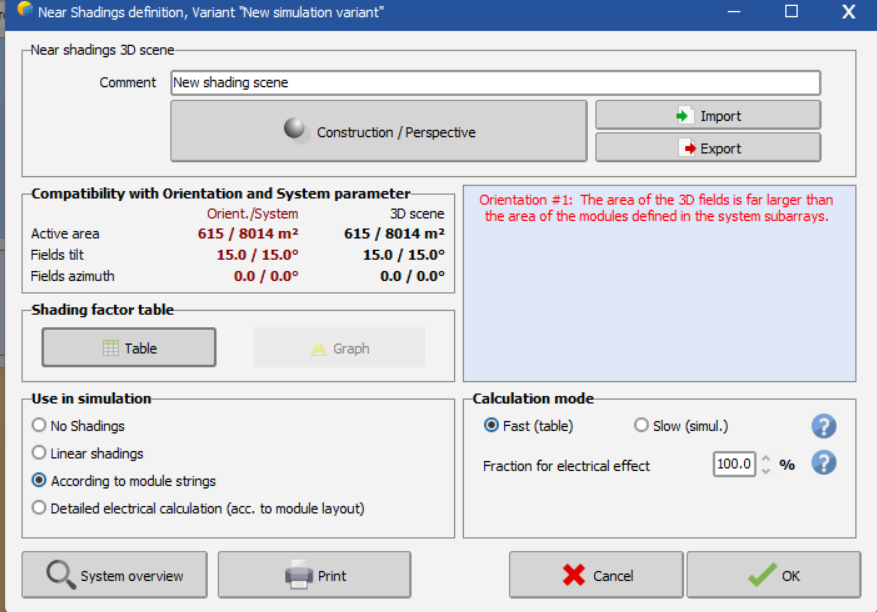
I have defined the exact scene and system but it still gives orientation is far larger error. Kindly tell me about this error.
-
Thank you
-
Hi PVSyst Support Team, I have the same problem and the bug persists despite trying to save the variant and reopen it. have you found another way to solve the problem please ?
-
 axel joined the community
 -
 Phisanu SMT joined the community
 -
 Jamesepido joined the community
 -
Hello, I advise you to start with the videos "My first Project" Regards,
- Last week
-
 Tschricker joined the community
 -
Hello guys, I am planning to self-learn PVsyst 8 but when I check PVsyst youtube channel’s playlists and PDF tutorial documents, I could not decide where to start and what could be the order of the videos/documents to study. Could you recommend a path for me to follow so that I can start from the scratch and learn all content? Thanks in advance!
-
 Kaan joined the community
 -
 Gillian1469 joined the community
 -
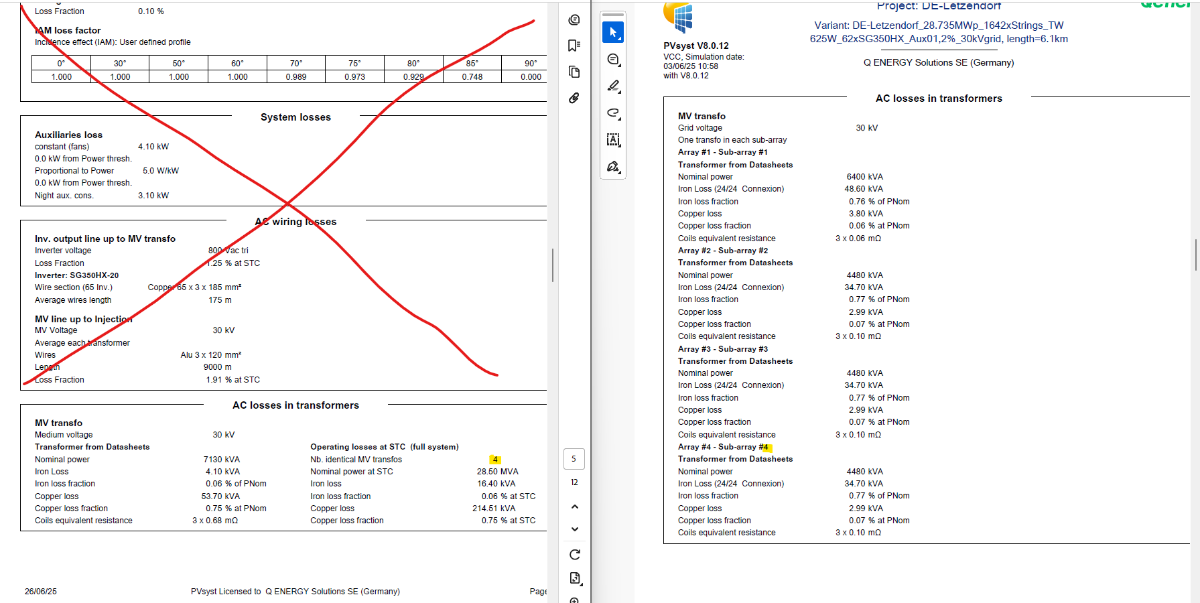
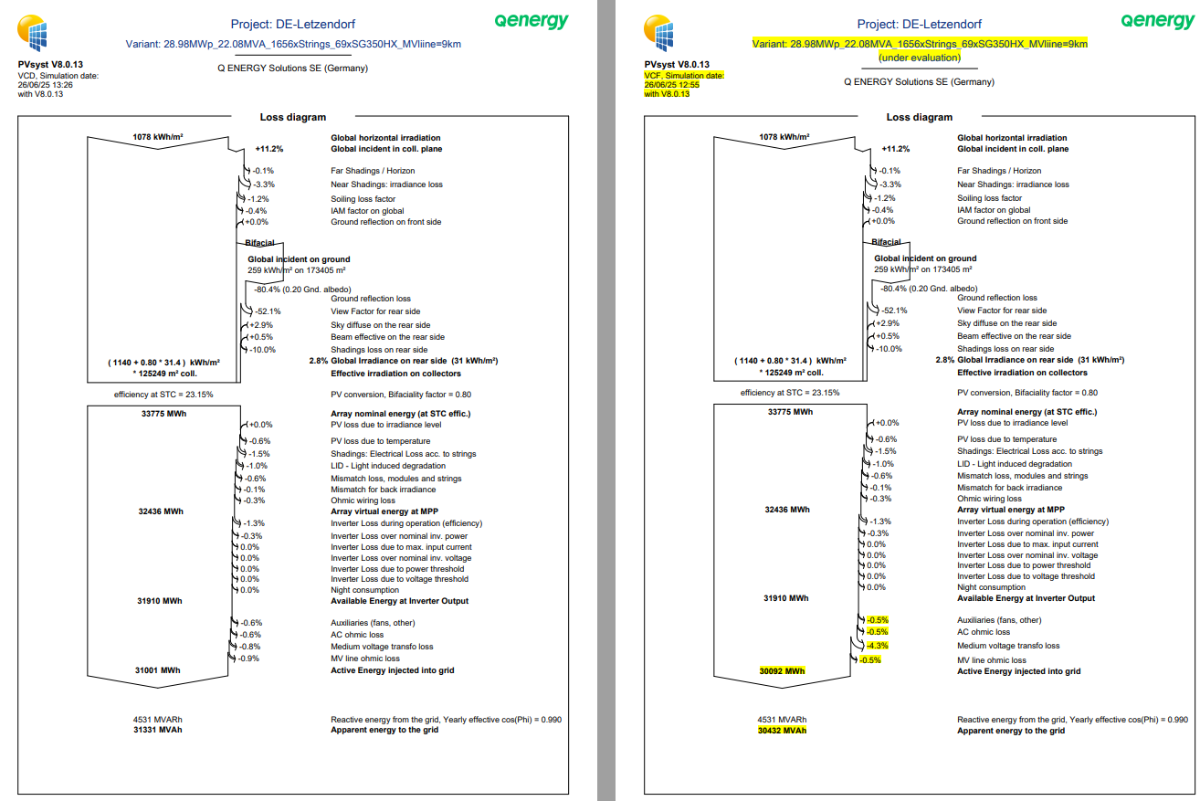
I observe that on the left, you have defined an iron loss fraction of 0.06%, which is reasonable (the usual values are around 0.1% of the nominal power). On the right, you have defined 0.77%, which is extremely high.
-
Sorry, this storage strategy - i.e. storing PV energy for a restitution in the evening - is not yet implemented in PVsyst. This should be done within some few months. I the meantime, if the battery has full priority at the beginning of the day, or charges with a fixed power, we can propose a workaround for at least evaluating the result. You could use the "Self-consumption" option, by defining a consumption corresponding to your foreseen reinjection power from 6pm, for a sufficient duration in order to discharge the whole battery (and null the rest of the day). Then you can consider the energy delivered to the user as the energy to the grid. You can ignore the missing energy.
-
Dear Sofia, Yes indeed, this is a bug we have in the current version. The bifacial model does not handle 0° tilts anymore. This will be fixed in the next patch 8.0.14. Sorry for the inconvenience..
-

PVsyst String Configuration and Shading Scene Simulation Issues.
Muhammed Sarikaya replied to NFI's topic in Simulations
I invite you to consult our help page regarding this: https://www.pvsyst.com/help/project-design/shadings/near-shadings-3d-construction/construction-tools/zones-of-tables.html?h=zones+tables -
Dear PVsyst, Our team has been running two different different ways to calculate the MV transfo losses. One assuming as a whole system, 4 MV transformers Second, by block, means that for each block, we have its corresponding MV transformer that in total are 4 MV transformer The problem and I don't understand why is that the losses between both versions are huge as you can see below. Could you explain me why it is such a big difference? Thanks
-
Dear PVsyst, I'm studying a new case in regards to microtilt of the modules. What strange is then when I apply a plane tilt of 1° de simulation run normally, but when I change to 0° a error comes up, not able to calculate the energy balance as it shows in the following figure. Is it possible to fix it?
-

PVsyst String Configuration and Shading Scene Simulation Issues.
NFI replied to NFI's topic in Simulations
Dear Muhammed, Thank you for your response and guidance. Sorry to trouble you again, but may I ask what the zone tools refer to? And how should they be used? Thank you very much! -
There is indeed an error in the Backside diffuse irradiance calculation (in some special cases) in the version 8.0.13. However this comes back to normal when you save the variant and reopent it.
-

IAM Profile Of a Module not yet in PVSyst Database
Lazare Fesnien replied to Alterna - Ingeniería's topic in Simulations
Dear Kittitut, When receiving PAN files from manufacturers, these usually define some parameters – not mentioned on the datasheets – which considerably boost the performance of their modules in the simulation. These PAN files may often be directly provided by “independent” laboratories (claimed as “certified”). PVsyst tries to detect these anomalies, and gives you this information. In these cases you are advised to use default parameters proposed by PVsyst, which are usually more realistic. There are mainly 2 classes of such uncertain parameters: The IAM profile. We are convinced that the IAM of most PV modules should follow the Fresnel’s physical laws, either for normal glass or for AR coatings. We received measurements from very serious laboratories which are very close to Fresnel. And we had still this confirmation recently after an informal discussion with a responsible of a well-known laboratory in the USA. See our FAQ https://forum.pvsyst.com/topic/1190-how-to-determine-the-iam-profile/#comment-3181 The low-light efficiency as measured by some laboratories is often biased by the fact that the filters used for the measurements at 200 and 400 W/m2 deliver slightly higher irradiance than nominal. I have analyzed many measurement reports from these labs, and observed that the Isc/G ratio is not stable, as it should be. When correcting this the low-light efficiency usually stays between -3% and -2%, rarely higher. See our FAQ https://forum.pvsyst.com/topic/1030-how-are-specified-the-pan-files-in-the-pvsyst-database/#comment-2731 When using these boosted PAN files in your simulations, you have the risk of getting over-estimated simulation results with respect to the real system.. Regards, -
Hello, I am trying to simulate a system on PVsyst where the battery storage is charged from the grid at certain times. Has this feature been added to PVSyst? if it has, how do I do this?
-
Hi, you need to enter the 3D scene and modify your PV objects to define partitions on them. Here is a help page with some guidelines on this: https://www.pvsyst.com/help/project-design/shadings/electrical-shadings-module-strings/partition-in-strings-of-modules.html