


André Mermoud
-
Posts
2038 -
Joined
-
Last visited
Posts posted by André Mermoud
-
-
Yes, in this case, this is the ratio of the annual values.
In fact, the P50/P90 statistical evaluation only make sense when you compare yearly results. These notions don't apply to hourly or daily values, and hardly on monthly values.
For example for evaluating the P90 of the results of, say, January, you should avail of a list of January values from many years, and calculate the standard deviation of this sample. This will obviously be far larger than the yearly variability. This doesn't make sense.
Now applying the P90 factor to each hour of a climatic data file is not correct. This would mean that each hour of a clear day would be diminished by this factor, which is obviously not the case. The P90 factor will induce a difference in the distribution of the bad and good days, not the absolute values of irradiances.
The only way to get P90 hourly values is to use a TMY weather datafile specifically constructed in this way. I.e. choose periods for the TMY construction which result in a P90 predefined yearly sum. This file may be completely different than the original P50 weather file.
-
Your questions:
Why is the “Produced Energy” (and PR) so much lower in the no injection scenario when the PV array performance and load supply remain the same?
You have a system of 3.4 MWp, this probably produces more than 17 MWh during a clear day. Now during this day the internal consumption is 4.8 MWh and the possible storage is 3 MWh, therefore 7.8 MWh. If you don't reinject into the grid, you will have more than 9 MWh lost !
Is PVsyst not counting excess PV generation as “Produced Energy” when it is curtailed (i.e., when the battery is full and there's no injection allowed)?
In this case the energy is indeed not used (it is even not produced), it is quite logical that it is named "Unused energy"
Is there a better way to represent "total generation potential" in a self-consumption system without grid injection, so that I can compare energy yield more realistically?
Why a better way? The "Total generation potential" is indeed the sum of the used energy and the unused energy, this seems quite clear for the user.
-
Sorry there is no workaround. This will be corrected in the version 8.0.14, to be released mid-July.
In the meantime, you should reinstall the previous version 8.0.12. You can install it in parallel with this version 8.0.13, both versions may coexist without problem.
-
I observe that on the left, you have defined an iron loss fraction of 0.06%, which is reasonable (the usual values are around 0.1% of the nominal power).
On the right, you have defined 0.77%, which is extremely high.
-
Sorry, this storage strategy - i.e. storing PV energy for a restitution in the evening - is not yet implemented in PVsyst. This should be done within some few months.
I the meantime, if the battery has full priority at the beginning of the day, or charges with a fixed power, we can propose a workaround for at least evaluating the result.
You could use the "Self-consumption" option, by defining a consumption corresponding to your foreseen reinjection power from 6pm, for a sufficient duration in order to discharge the whole battery (and null the rest of the day). Then you can consider the energy delivered to the user as the energy to the grid. You can ignore the missing energy.
-
There is indeed an error in the Backside diffuse irradiance calculation (in some special cases) in the version 8.0.13. However this comes back to normal when you save the variant and reopent it.
-
The cable type or installation mode may affect the resistance only in terms of "Resistivity as function of the Temperature".
In PVsyst, the resistivity is specified for a temperature of 50°C (alu or copper). This will be modifiable in a next version of PVsyst (probably in V 8.1). But in practice, we usually don't have any information about the cables temperature in the system during operation.
NB: The resistivity variation is 0.39 %/°C. Applied to a loss which is usually of the order of 1% of the total energy, the effect is completely negligible in the simulation results.
-
This warning has nothing to do with the Pmpp difference between the nameplate and the one-diode model result.
This is due to a problem in the simulation process (irradiance calculations), which has been corrected in the V 8.0. But sorry, I can't say anything more without analysing your project in detail.
-
PVsyst is a worldwide distributed software. We obviously cannot include such national or local requirements, especially like this one which seems to be very evolutive.
Moreover, we don’t want to take any responsibilities regarding such national administrative rules.
-
The transfo loss reported by the simulation (loss diagram) is the sum of the Copper losses and the Iron losses.
Remember that the Iron losses are a fixed value, permanent (24/24) if you did not check "Night disconnect". It represents an important contribuition.
-
You mention that "PVsyst requires that the saturation current of a module at STC (I0_ref) be at least 0.01 pA, or 1e-14 A."
I don't see where you found this statement in the documentation. Probably you have "added" the condition at STC (otherwise the documentation should indeed be corrected.
Please observe that the Io value is extremely dependent on the temperature. It varies by a factor of about 20'000 when passing from 25°C to -10°C. In the PVsyst database, we try to choose parameters which ensure that the saturation current Io(T) remains > 0.02 pA downto a temperature of -10°C.
See the help https://www.pvsyst.com/help/physical-models-used/pv-module-standard-one-diode-model/temperature-behaviour-correction.html#temperature-correction-on-gamma, especially the Nb2 paragraph.
-
This depends on the PV module you have defined in your subarray.
The LID box is only visible when the LID is pertinent, I.e. with crystalline modules: siMono, siPoly, HJT
-
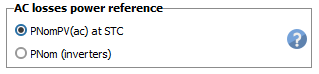
In the AC losses part, the reference power may be either the STC power of the PV array, or the PNomac output of the inveters. This choice is done in the project's settings:

In this case the PNomac of the inverters is the nominal power (not the possible max. power at low temperature).
NB: In your case the choice of the reference power is the array STC power (nameplate of the PV modules).
However the reference power choice affects the ohmic loss parameter when expressed in terms of percentage. The basic definition of the ohmic losses is the cable Resistance. When operating, the ohmic loss is proportional to the square of the current. When expressed as percentage of the power it is proportional to the power.
This is explained in detail the help https://www.pvsyst.com/help/project-design/array-and-system-losses/ohmic-losses/index.html.
As an example:
You have defined a MV lines loss of 1% for a PNom at STC = 8.2 MWp (PV array).
Now if you have a PNomac(inv) of, say, 6 MW, the relative loss at PNom(inv) will be 1% * 6MW/8.2MW = 0.73%.
You can check that if you change the referenc power in the project's settings, the relative losses will drop accodingly in this dialog.
-
This is explained in detail in the help https://www.pvsyst.com/help/project-design/array-and-system-losses/ageing-pv-modules-degradation/index.html?h=ageing
The LID degradation occurs in the first hours of the system operation. It is simply treated as a diminution of the PV module efficiency, whatever the operating year. In your case it should be specified as null.
This curve is a warranty for each individual module. It does not describe the average ageing behavior of the PV system.
-
I don't know what you have defined as Charging device power in the Grid storage dialog. Probably around 100 kW.
Now I see that these hourly values correspond to a power of 1.4 kW, i.e. 1.4% of the nominal power. At this power level, the inverter efficiency profile (defined by a maximal and EURO efficiency) is very low, close to 0.
-
It uses the last two points.
-
Yes indeed, one only other user reported this error. The error is indeed the unit's name, which should be MWh/year. With this the value itself is correct.
I really don't know the origin of this error. I tried to secure some initializations, but I really cannot reproduce this problem, so that I can't be quite sure that it has been corrected. The user who had reported it cannot reproduce it, too.
If you get this problem in a stable way, please send us you whole project, using "Files => Export project" in the main menu. Please send it to support@pvsyst.com.
-
No, due to by-pass diodes, the hot spot situation is not supposed to arise in normal operation.
-
Yes of course. If you don't check this option, there will not be any losses due to the HV transformer, nor the line after this transformer.
-
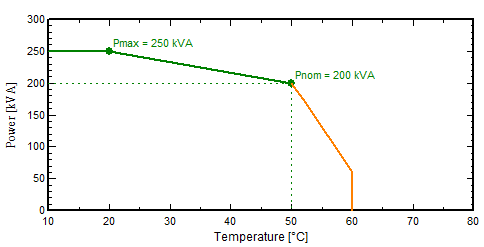
When you have a nominal power, defined up to a given temperature, say 50°C, and an enhancced maximum power up to lower specified temperature, say 20°C, the simulation will use the curve shown in the inverter's definition dialog, page "Output parameters":
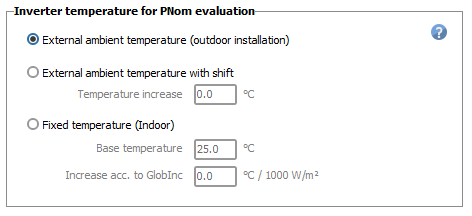
The inverter temperature to be used during the simulation is defined in the "Energy management" dialog:
Now the efficiency curve is specified by points at different powers, and interpolated between these points at each time step. If the actual power is over these points, the efficiency curve is simply extended linearly.
-
Sorry, no progress in the present time.
-
IRev is calculated according to the expression mentioned above, by neglecting Rserie (put Rs = 0).
This expression gives the IRev as a function of a specified voltage. Iph is the short circuit current for this shaded cell.
-
In PVsyst, the model for the reverse characteristics is this quadratic expression. This corresponds rather well to the reality, but this is a rough approximation.
By the way the values of this model have a quasi null impact on the PVsyst simulation results.
Now the term (Rserie * I) is indeed a little contribution (perhaps it should not be taken into account, we will check). You can forget it.
-
This tool shows what happens for a specified current (i.e. imposed by the rest of the string). You can drag the red point of this forced current for analysing what happens at different values.
The voltage of this point is the result of the reverse characterisics model:
You can find this formula in the help https://www.pvsyst.com/help/physical-models-used/pv-module-standard-one-diode-model/reverse-characteristic-of-a-cell.html
The temperature is obtained by applying the U-value on this cell, taking the dissipated power as input parameter instead of GlobInc.

Charging storage battery from grid
in How-to
Posted
I think you missed my previous answer, three days ago.
I wrote : "this storage strategy - i.e. storing PV energy for a restitution in the evening - is not yet implemented in PVsyst."
Is it not sufficiently clear ?